
Articles
- Page Path
- HOME > Endocrinol Metab > Volume 31(4); 2016 > Article
-
Original ArticleClinical Study The Recovery of Hypothalamic-Pituitary-Adrenal Axis Is Rapid in Subclinical Cushing Syndrome
-
Hee Kyung Kim
 , Jee Hee Yoon, Yun Ah Jeong, Ho-Cheol Kang
 -
Endocrinology and Metabolism 2016;31(4):592-597.
DOI: https://doi.org/10.3803/EnM.2016.31.4.592
Published online: December 20, 2016
Department of Internal Medicine, Chonnam National University Medical School, Gwangju, Korea.
- Corresponding author: Ho-Cheol Kang. Department of Internal Medicine, Chonnam National University Medical School, 160 Baekseo-ro, Dong-gu, Gwangju 61469, Korea. Tel: +82-61-379-7620, Fax: +82-61-379-7628, drkang@chonnam.ac.kr
• Received: August 10, 2016 • Revised: September 19, 2016 • Accepted: October 14, 2016
Copyright © 2016 Korean Endocrine Society
This is an Open Access article distributed under the terms of the Creative Commons Attribution Non-Commercial License (http://creativecommons.org/licenses/by-nc/4.0/) which permits unrestricted non-commercial use, distribution, and reproduction in any medium, provided the original work is properly cited.
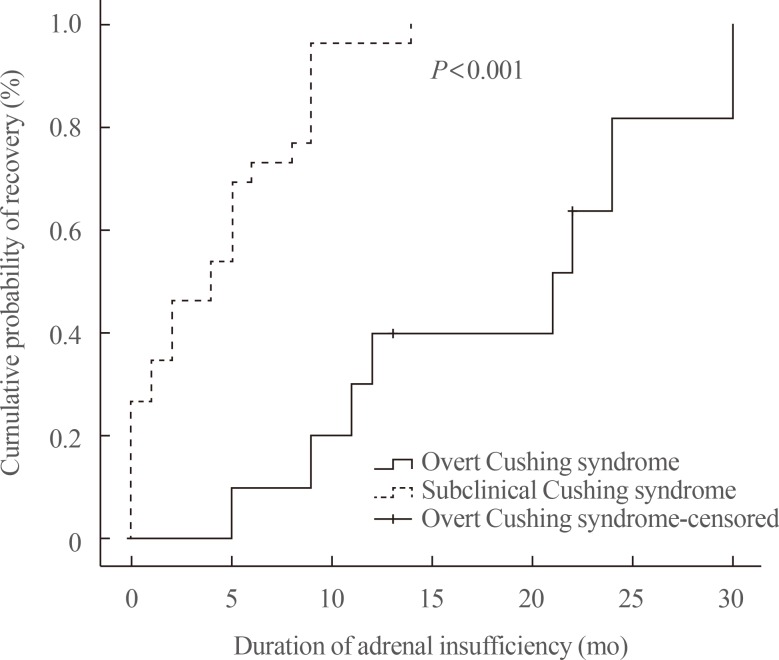
Figure & Data
References
Citations
Citations to this article as recorded by 
- Hypothalamic–pituitary–adrenal axis recovery after treatment of Cushing's syndrome
Annemarie Balasko, Karin Zibar Tomsic, Darko Kastelan, Tina Dusek
Journal of Neuroendocrinology.2022;[Epub] CrossRef - Early assessment of postoperative adrenal function is necessary after adrenalectomy for mild autonomous cortisol secretion
Trenton Foster, Irina Bancos, Travis McKenzie, Benzon Dy, Geoffrey Thompson, Melanie Lyden
Surgery.2021; 169(1): 150. CrossRef - Is Prophylactic Steroid Treatment Mandatory for Subclinical Cushing Syndrome After Unilateral Laparoscopic Adrenalectomy?
Dong Wang, Han-zhong Li, Yu-shi Zhang, Liang Wang, Zhi-gang Ji
Surgical Laparoscopy, Endoscopy & Percutaneous Techniques.2019; 29(1): 31. CrossRef - When to Intervene for Subclinical Cushing's Syndrome
Lily B. Hsieh, Erin Mackinney, Tracy S. Wang
Surgical Clinics of North America.2019; 99(4): 747. CrossRef - Serum Cortisol Levels via Radioimmunoassay vs Liquid Chromatography Mass Spectrophotometry in Healthy Control Subjects and Patients With Adrenal Incidentalomas
Martha K P Huayllas, Brian C Netzel, Ravinder J Singh, Claudio E Kater
Laboratory Medicine.2018;[Epub] CrossRef - Contralateral adrenal width predicts the duration of prolonged post‐surgical steroid replacement for subclinical Cushing syndrome
Masahiro Sugiura, Yusuke Imamura, Koji Kawamura, Satoshi Yamamoto, Tomokazu Sazuka, Kazuyoshi Nakamura, Shinichi Sakamoto, Hidekazu Nagano, Hisashi Koide, Tomoaki Tanaka, Takashi Imamoto, Akira Komiya, Tomohiko Ichikawa
International Journal of Urology.2018; 25(6): 583. CrossRef - Predictability of hypoadrenalism occurrence and duration after adrenalectomy for ACTH-independent hypercortisolism
V. Morelli, L. Minelli, C. Eller-Vainicher, S. Palmieri, E. Cairoli, A. Spada, M. Arosio, I. Chiodini
Journal of Endocrinological Investigation.2018; 41(4): 485. CrossRef - Articles inEndocrinology and Metabolismin 2016
Won-Young Lee
Endocrinology and Metabolism.2017; 32(1): 62. CrossRef
 PubReader
 Cite
Cite

