Articles
- Page Path
- HOME > Endocrinol Metab > Volume 31(3); 2016 > Article
-
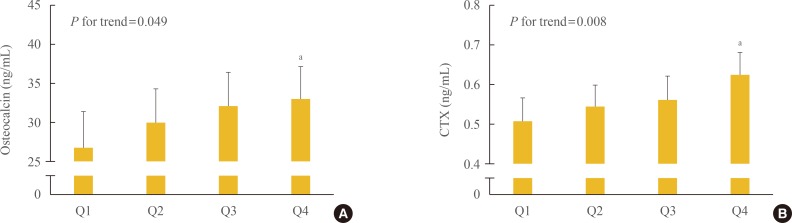
Original ArticleClinical Study The Association of Higher Plasma Macrophage Migration Inhibitory Factor Levels with Lower Bone Mineral Density and Higher Bone Turnover Rate in Postmenopausal Women
-
Hyeonmok Kim1*
 , Seong Hee Ahn2*, Chaeho Shin1, Seung Hun Lee1, Beom-Jun Kim1, Jung-Min Koh1
 -
Endocrinology and Metabolism 2016;31(3):454-461.
DOI: https://doi.org/10.3803/EnM.2016.31.3.454
Published online: July 26, 2016
1Division of Endocrinology and Metabolism, Asan Medical Center, University of Ulsan College of Medicine, Seoul, Korea.
2Department of Endocrinology, Inha University School of Medicine, Incheon, Korea.
- Corresponding author: Beom-Jun Kim. Division of Endocrinology and Metabolism, Asan Medical Center, University of Ulsan College of Medicine, 88 Olympic-ro 43-gil, Songpa-gu, Seoul 05505, Korea. Tel: +82-2-3010-5876, Fax: +82-2-3010-6962, umkbj0825@amc.seoul.kr
- *These authors contributed equally to this work.
• Received: April 12, 2016 • Revised: June 5, 2016 • Accepted: June 7, 2016
Copyright © 2016 Korean Endocrine Society
This is an Open Access article distributed under the terms of the Creative Commons Attribution Non-Commercial License (http://creativecommons.org/licenses/by-nc/3.0/) which permits unrestricted non-commercial use, distribution, and reproduction in any medium, provided the original work is properly cited.
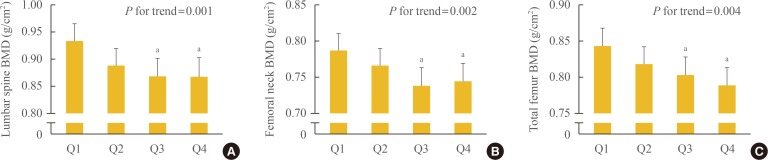

Figure & Data
References
Citations
Citations to this article as recorded by 
- The role of MIF in periodontitis: A potential pathogenic driver, biomarker, and therapeutic target
Tongfeng Fang, Liu Liu, Dongzhe Song, Dingming Huang
Oral Diseases.2023;[Epub] CrossRef - Variation of Bone Turnover Markers in Childhood and Adolescence
Yiduo Zhang, Jing Zhang, Xiaocui Huang, Xingnan Yu, Ye Li, Fan Yu, Wenjie Zhou, Ziqing Li
International Journal of Clinical Practice.2023; 2023: 1. CrossRef - Modulation of Dopamine Receptors on Osteoblasts as a Possible Therapeutic Strategy for Inducing Bone Formation in Arthritis
Elena Schwendich, Laura Salinas Tejedor, Gernot Schmitz, Markus Rickert, Jürgen Steinmeyer, Stefan Rehart, Styliani Tsiami, Jürgen Braun, Xenofon Baraliakos, Jörg Reinders, Elena Neumann, Ulf Müller-Ladner, Silvia Capellino
Cells.2022; 11(10): 1609. CrossRef - Macrophage migration inhibitory factor: a potential biomarker for chronic low back pain in patients with Modic changes
Elisabeth Gjefsen, Kristina Gervin, Guro Goll, Lars Christian Haugli Bråten, Monica Wigemyr, Hans Christian D Aass, Maria Dehli Vigeland, Elina Schistad, Linda Margareth Pedersen, Are Hugo Pripp, Kjersti Storheim, Kaja Kristine Selmer, John Anker Zwart
RMD Open.2021; 7(2): e001726. CrossRef - Potential Biomarkers to Improve the Prediction of Osteoporotic Fractures
Beom-Jun Kim, Seung Hun Lee, Jung-Min Koh
Endocrinology and Metabolism.2020; 35(1): 55. CrossRef - Elevated Expression of Macrophage Migration Inhibitory Factor Promotes Inflammatory Bone Resorption Induced in a Mouse Model of Periradicular Periodontitis
Mohammed Howait, Abdullah Albassam, Chiaki Yamada, Hajime Sasaki, Laila Bahammam, Mariane Maffei Azuma, Luciano Tavares Angelo Cintra, Abhay R. Satoskar, Satoru Yamada, Robert White, Toshihisa Kawai, Alexandru Movila
The Journal of Immunology.2019; 202(7): 2035. CrossRef - Preventive Effects of Low Parathyroid Hormone Levels on Hip Fracture in Patients with Vitamin D Deficiency
Seong-Eun Byun, Soonchul Lee, Ji Wan Kim, Yong-Chan Ha, Chul-Ho Kim, Cheungsoo Ha, Keun Jung Ryu, Jung-Min Koh, Hyung Kyung Kim, Jae Suk Chang
Journal of Bone Metabolism.2019; 26(2): 89. CrossRef - Articles inEndocrinology and Metabolismin 2016
Won-Young Lee
Endocrinology and Metabolism.2017; 32(1): 62. CrossRef - New Biological Markers of Bone Metabolism in Osteoporosis Treatment
Sun Wook Cho
Endocrinology and Metabolism.2016; 31(3): 400. CrossRef
 PubReader
 Cite
Cite