
Articles
- Page Path
- HOME > Endocrinol Metab > Volume 38(6); 2023 > Article
-
Original ArticleCalcium & bone metabolism Familial Correlation and Heritability of Hand Grip Strength in Korean Adults (Korea National Health and Nutrition Examination Survey 2014 to 2019)
 Keypoint
A Korean family-based study of 5,000+ participants found that hand grip strength, HGS was partially heritable (with a heritability estimate of 0.154). Significant correlations in HGS existed among parent-offspring pairs, siblings, and spouses, reflecting the influence of both genetic and environmental factors on HGS variance. Notably, the offspring, especially daughters, of parents with weak HGS had a higher risk of similar weakness, underscoring the interplay of genetics and environment in muscle health. -
Seong Hee Ahn1*
 , Eun Byeol Park2*, Seongha Seo1, Yongin Cho1, Da Hea Seo1, So Hun Kim1, Young Ju Suh3, Seongbin Hong1
 -
Endocrinology and Metabolism 2023;38(6):709-719.
DOI: https://doi.org/10.3803/EnM.2023.1740
Published online: November 7, 2023
1Department of Endocrinology and Metabolism, Inha University Hospital, Inha University College of Medicine, Incheon, Korea
2Department of Biostatistics, Korea University College of Medicine, Seoul, Korea
3Department of Biomedical Sciences, Inha University College of Medicine, Incheon, Korea
- Corresponding authors: Seongbin Hong. Department of Endocrinology and Metabolism, Inha University Hospital, Inha University College of Medicine, 27 Inhang-ro, Jung-gu, Incheon 22332, Korea Tel: +82-32-890-3597, Fax: +82-32-882-6578, E-mail: sbhongmd@inha.ac.kr
- Young Ju Suh. Department of Biomedical Sciences, Inha University College of Medicine, 27 Inhang-ro, Jung-gu, Incheon 22332, Korea Tel: +82-32-890-2833, Fax: +82-32-890-1120, E-mail: ysuh@inha.ac.kr
- *These authors contributed equally to this work.
Copyright © 2023 Korean Endocrine Society
This is an Open Access article distributed under the terms of the Creative Commons Attribution Non-Commercial License (http://creativecommons.org/licenses/by-nc/4.0/) which permits unrestricted non-commercial use, distribution, and reproduction in any medium, provided the original work is properly cited.
- 1,225 Views
- 48 Download
ABSTRACT
-
Background
- The onset and progression of sarcopenia are highly variable among individuals owing to genetic and environmental factors. However, there are a limited number of studies measuring the heritability of muscle strength in large numbers of parent-adult offspring pairs. We aimed to investigate the familial correlation and heritability of hand grip strength (HGS) among Korean adults.
-
Methods
- This family-based cohort study on data from the Korea National Health and Nutrition Examination Survey (2014 to 2019) included 5,004 Koreans aged ≥19 years from 1,527 families. HGS was measured using a digital grip strength dynamometer. Familial correlations of HGS were calculated in different pairs of relatives. Variance component methods were used to estimate heritability.
-
Results
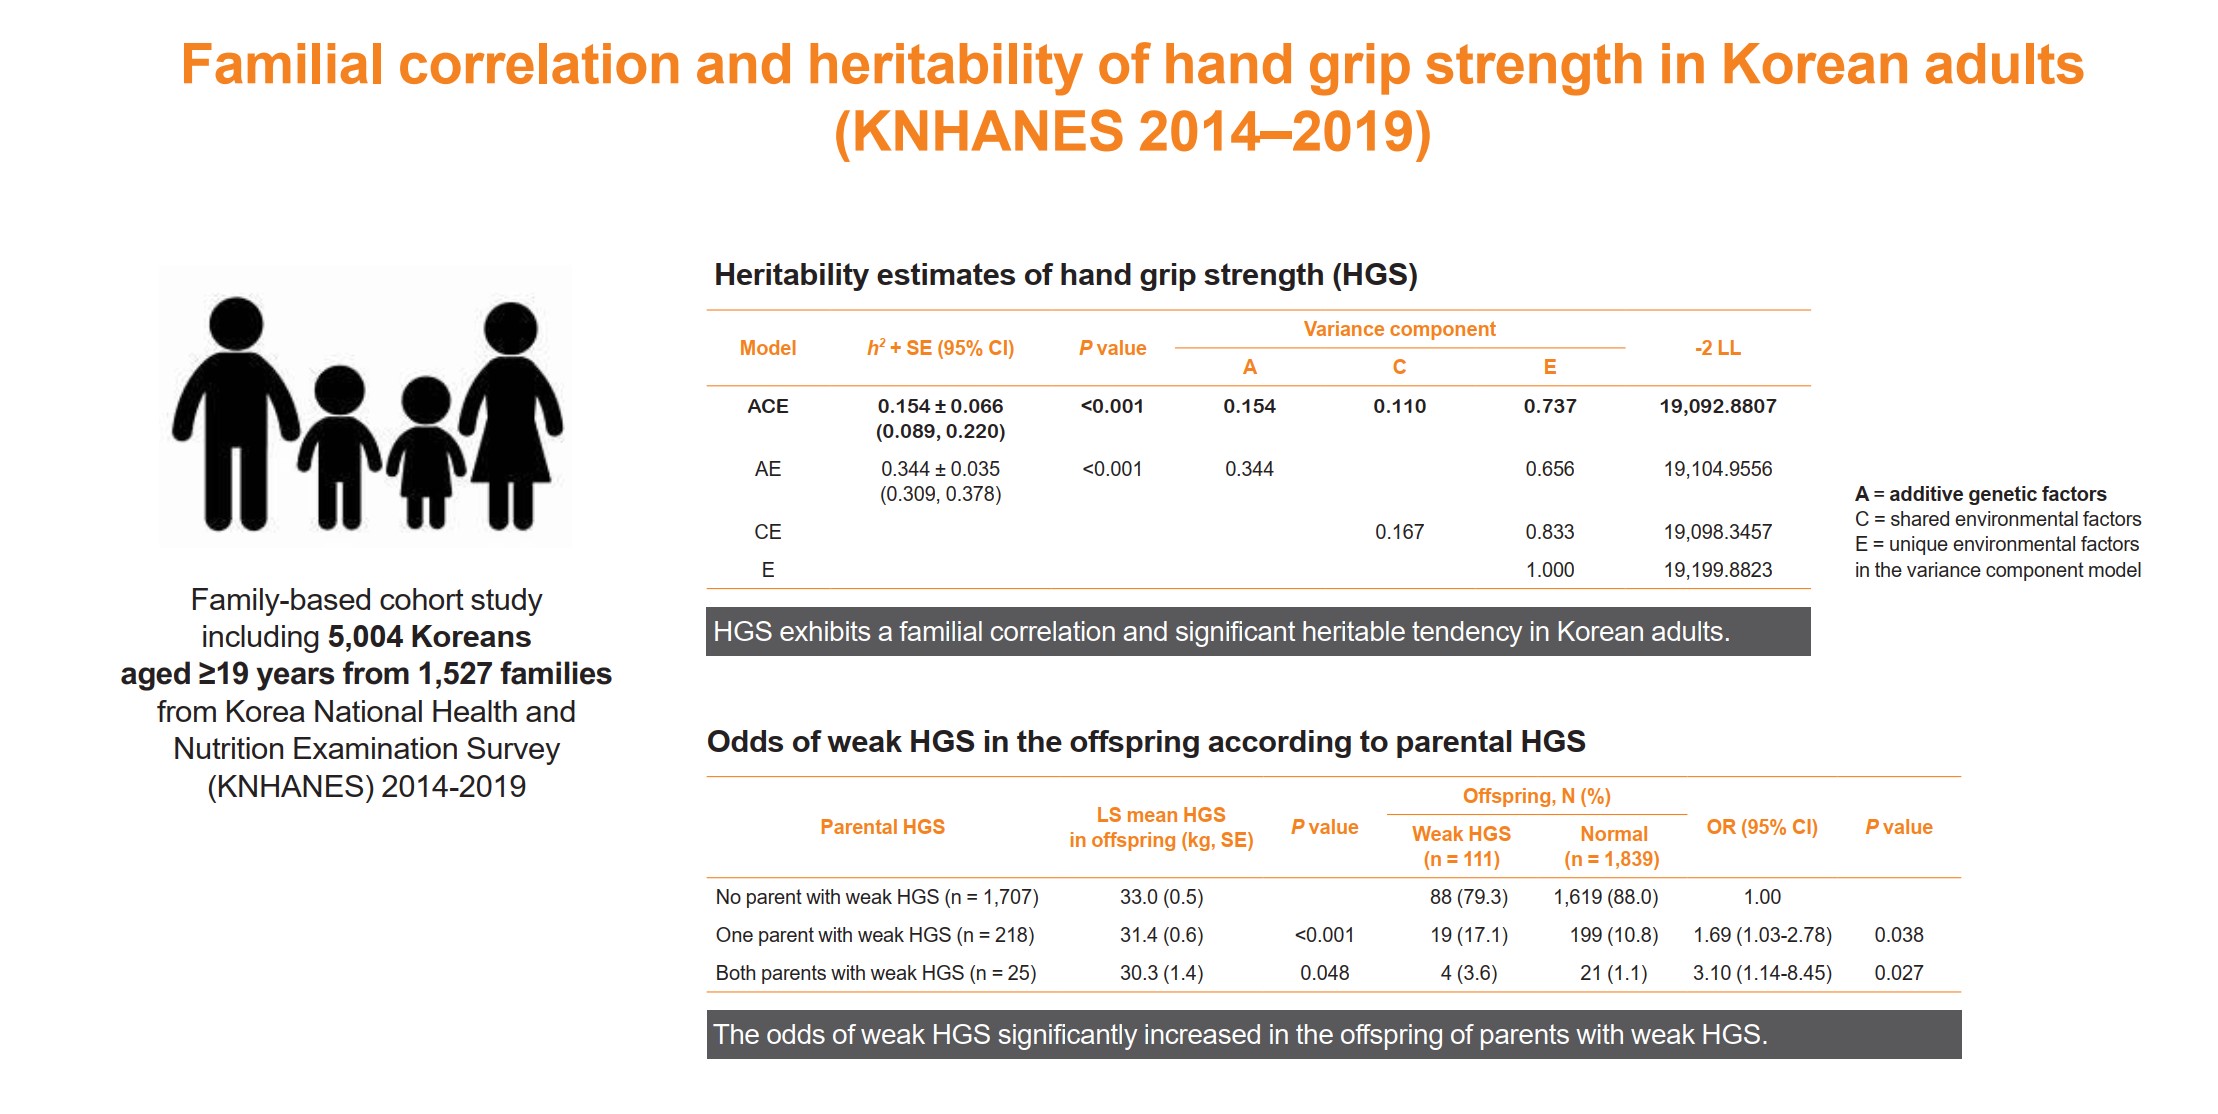
- The heritability estimate of HGS among Korean adults was 0.154 (standard error, 0.066). Correlation coefficient estimates for HGS between parent-offspring, sibling, and spouse pairs were significant at 0.07, 0.10, and 0.23 (p<0.001, p=0.041, and p<0.001, respectively). The total variance in the HGS phenotype was explained by additive genetic (15.4%), shared environmental (11.0%), and unique environmental (73.6%) influences. The odds of weak HGS significantly increased in the offspring of parents with weak HGS (odds ratio [OR], 1.69–3.10; p=0.027–0.038), especially in daughters (OR, 2.04–4.64; p=0.029–0.034).
-
Conclusion
- HGS exhibits a familial correlation and significant heritable tendency in Korean adults. Therefore, Asian adults, especially women, who have parents with weak HGS, need to pay special attention to their muscle health with the help of healthy environmental stimuli.
- Sarcopenia is an age-related disease, in which muscle mass, strength, and function may decline with age [1,2]. As sarcopenia increases the risk of falls and fractures, reduces the quality of life, and increases the risk of disease and even death, it has become a major threat to the health of older adults [3]. However, despite its seriousness, questions related to the underlying cellular mechanisms, biomarkers, accuracy of diagnostic tests, and effective preventive or treatment strategies remain unaddressed [4].
- Muscle mass and strength vary through a lifetime, generally increasing with growth in youth and young adulthood, being maintained in midlife, and subsequently decreasing with age [5]. Although the pathophysiology of sarcopenia is very complex, previous studies have clearly shown that the effects of both genetic and environmental factors are closely intertwined and can hasten muscle weakening toward functional impairment and disability. Accordingly, the onset and progression of sarcopenia are highly variable among individuals owing to genetic and environmental differences [6,7]. Moreover, it appears necessary to maximize muscle mass and strength in youth and young adulthood, maintain them in middle age, and minimize muscle loss in older age [8].
- Heritability, which is defined as the ratio of additional genetic variations to the total phenotypic variation, generally assesses the genetic contribution to a trait [9]. The remaining variance is explained by the shared family environmental and unique environmental factors. As an accurate measure of the average genetic share can be obtained based on family relationships, family studies can provide an estimate of the overall genetic impact of a particular trait [10]. However, previous studies reporting on the substantial contribution of genetic factors to muscle mass and strength in adult life were mostly twin studies, and heritability estimates of >50% were not uncommon in these studies [11]. To our knowledge, few studies have demonstrated the relative influence of genetic and environmental factors on the phenotypic variance of muscle strength during adulthood in a family-based cohort comprising parent-adult offspring pairs. Therefore, in this study, we aimed to investigate the familial correlation and heritability of hand grip strength (HGS) in a large family-based cohort among the participants in the Korea National Health and Nutrition Examination Survey (KNHANES) conducted between 2014 and 2019.
INTRODUCTION
- Study participants
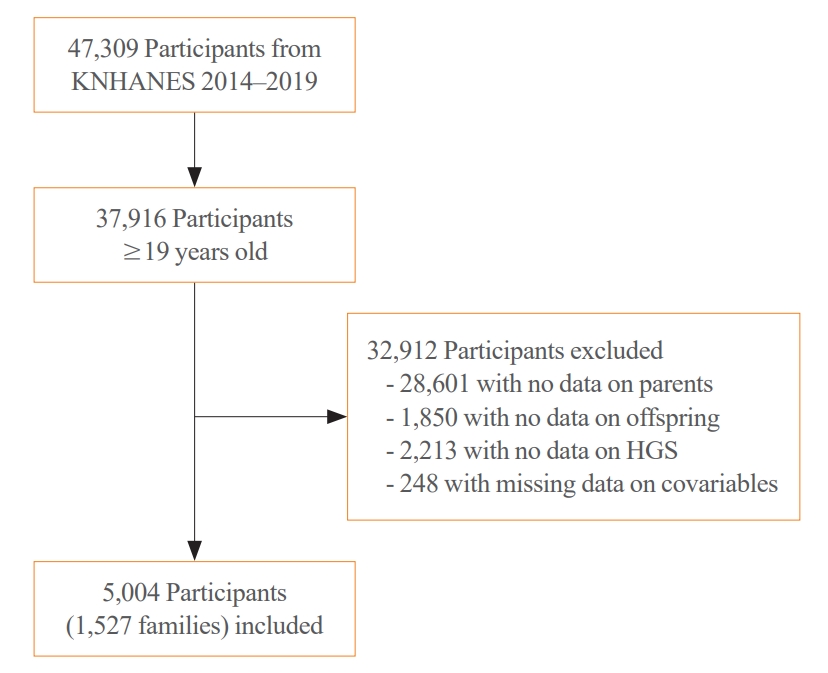
- Participants in this study were recruited from the KNHANES conducted from 2014 to 2019; HGS measurements were performed as part of the KNHANES. The KNHANES is a cross-sectional nationwide survey that employs a stratified, multistage, clustered probability sampling method to select a representative sample of non-institutionalized South Korean civilians [12]. The survey consists of a health interview, health examination, and nutrition survey. Data were collected through household interviews and standardized physical examinations conducted at mobile examination centers. The KNHANES database is available in English on a publicly accessible website (http://knhanes.kdca.go.kr/knhanes/eng). All the participants provided informed consent. All survey protocols were approved by the Institutional Review Board of the Korea Disease Control and Prevention Agency (approval number: 2013-12EXP-03-5C, 2018-01-03-PA, 2018-01-03-C-A). Of the 47,309 participants in KNAHNES (2014 to 2019), we initially selected those aged ≥19 years (n=37,916). Next, we excluded participants from families without data on the parents or offspring (n=28,061 and n=1,850, respectively). We also excluded participants without data on HGS (n=2,213) and those with missing data on smoking status, drinking habits, exercise habits, protein intake, or comorbidities, such as diabetes, hypertension, stroke, coronary artery diseases, chronic kidney diseases, arthritis, thyroid diseases, and cancers (n=248). The remaining 5,004 participants from 1,527 families, with data from both parents and their offspring, constituted the study cohort (Fig. 1).
- Anthropometric, lifestyle, and dietary parameters
- All the participants underwent a thorough physical examination. Data on age, weight, height, smoking status, drinking habits, and exercise habits were recorded. Weight and height were measured with the participants wearing light clothing without shoes. Body mass index (BMI) was calculated by dividing the weight by height squared. Smoking status was categorized as never, past, or current. Heavy alcohol consumption in men and women was defined as the consumption of ≥7 and ≥5 drinks, respectively, at one time, more than twice per week. Resistance exercise was defined as exercises, such as push-ups, dumbbell or barbell lifts, or chin-ups, performed more than once per week. Nutrient intake was estimated using a multiple-pass 24-hour dietary recall technique, and protein intake was measured on a food item basis.
- Measurement of HGS
- HGS was measured using a digital grip strength dynamometer (T.K.K 5401, Takei Scientific Instruments Co., Ltd., Tokyo, Japan), which measures between 5.0 and 100.0 kg of force with an accuracy of ±0.1 kg and has an adjustable span. During HGS measurement, participants were asked to stand upright with their feet placed hip-width apart and to look forward with the elbows fully extended. The dynamometer was held in a neutral comfortable position using one hand (not flexed or extended) with the index finger at 90° flexion. The participants were instructed to squeeze the grip continuously at full force for at least 3 seconds. Approximately 60 seconds were allowed for recovery between measurements. The maximum HGS value of the dominant hand during the three trials was chosen as the representative HGS measurement. In this study, weak HGS was defined as HGS values <28.9 and <16.8 kg in men and women, respectively, according to previously reported Korean reference data [13]. To enhance the robustness of our study results, we conducted sensitivity analyses using an alternative threshold for weak HGS based on the definition of sarcopenia from the Korean Working Group on Sarcopenia 2023 (KWGS 2023; HGS values <28.0 and <18.0 kg in men and women, respectively) [14].
- Statistical analysis
- Continuous and categorical variables are expressed as mean±standard deviation (SD) and numbers with percentages, respectively. Differences between the two groups in each variable among the baseline characteristics were analyzed using Student’s t test (for continuous variables) or the chi-square test (for categorical variables). Intraclass correlation coefficients (ICC) for HGS were estimated in order to evaluate familial correlations between specific pairs of relatives within the pedigrees. Being from the same family was considered as a random effect (shared family setting) in the model. ICCs were calculated for parentoffspring, sibling, and spouse pairs using the FCOR (familial correlation) program in the Statistical Analysis for Genetic Epidemiology (S.A.G.E.) software application version 6.4.2 (http://darwin.cwru.edu/sage/). The ICCs can be interpreted as indicating poor, fair to good, and excellent reliability when the values are <0.40, 0.40–0.75, and ≥0.75, respectively [15]. Comparison between ICCs of specific pairs of relatives was performed using Fisher’s r to z transformation method to determine the relative contribution of genetic and environmental effects (https://www.medcalc.org/calc/comparison_of_correlations.php). The heritability of HGS was estimated using variance component analysis after adjusting for important confounding variables, such as sex, age, BMI, protein intake, smoking status, alcohol consumption, exercise habits, and comorbidities. The residual variance in HGS was partitioned into three components: additive genetic factors (A), shared family environmental factors (C), and unique environmental factors (E). The best-fit model was chosen based on the likelihood estimates of the different models described by A, C, and E. The ACE model was initially fitted to the data and then compared with the following three submodels. One submodel contained additional genetic and unique environmental factors (AE), another submodel contained shared and unique environmental factors (CE), and the final submodel contained unique environmental factors (E). Heritability was defined as the ratio of the residual variation in a trait due to an additive genetic factor (A) to the total residual variation. To evaluate heritability for muscle strength, the SOLAR-Eclipse software package version 8.1.1 (http://solar-eclipse-genetics.org/) was used. To compare offspring HGS according to parental HGS, the least-square (LS) means with 95% confidence intervals (CIs) were estimated using a mixed model, on the assumption that random effects accounted for correlations within the same family. Conditional logistic regression was used to analyze the odds of weak HGS in the offspring according to parental HGS, by considering matching within the same family. Statistical analyses were performed using SAS version 9.4 (SAS Institute, Cary, NC, USA). Statistical significance was established at P<0.05 using a two-sided test.
METHODS
- Baseline characteristics of the study participants
- The clinical characteristics of the 5,004 participants from 1,527 families (1,527 fathers, 1,527 mothers, 1,017 sons, and 993 daughters) are shown in Table 1. Among the parents, fathers were older and heavier, consumed larger amounts of protein, and exercised more often than mothers (all P<0.001). A larger number of fathers were current smokers and binge drinkers than mothers (all P<0.001). Muscle strength was greater in fathers than in mothers (39.3±7.5 kg vs. 24.4±5.0 kg, P<0.001). Among the offspring, sons were older and heavier, consumed larger amounts of protein, and exercised more often than daughters (P<0.001 to 0.003). A larger number of sons were current smokers and binge drinkers than daughters (all P<0.001). HGS was greater in sons than in daughters (41.8±8.0 kg vs. 24.0±4.8 kg, P<0.001).
- Familial correlation of HGS
- The estimated correlation coefficients for HGS in each pair of relatives within a family after adjustments for important confounding variables, such as sex, age, BMI, protein intake, smoking status, alcohol consumption, exercise habits, and comorbidities, are shown in Table 2. The estimated correlation coefficients for HGS were as follows: between parents and their offspring, rparents_offspring=0.07 (95% CI, 0.05 to 0.09; P<0.001); between siblings, rsiblings=0.10 (95% CI, 0.05 to 0.14; P=0.041); and between spouses, rspouses=0.23 (95% CI, 0.20 to 0.25; P<0.001). When the correlation coefficients between different pairs of relatives were compared, there were no significant differences between rparents_offspring and rsiblings (P=0.547). However, there were significant differences between rparents_offspring and rspouses (P< 0.001) and between rsiblings and rspouses (P=0.013). These findings indicate a significant familial correlation of HGS in Korean adults, albeit with relatively weak reliability of the estimated correlation coefficients.
- Heritability of HGS
- To estimate the heritability of HGS, we first built the ACE model with all three components and then tested the model against the nested submodels AE, CE, and E before and after adjustments for confounding factors (Table 3). In the crude model, before adjustments for confounding factors, the removal of the A component from the ACE model significantly worsened the model fit, indicating that the ACE or AE model was optimal. In both the ACE and AE models, the heritability estimate (h2) was 0.215 (standard error [SE], ±0.038).
- In the adjusted model, after adjustments for age, sex, BMI, protein intake, smoking status, alcohol consumption, exercise habits, and comorbidities, the removal of the A or C components from the ACE model significantly worsened the model fit, indicating that the ACE model was optimal (Table 3). In the ACE model after adjustments for confounding factors, the h2 was 0.154±0.066, and the total variance in HGS could be explained by the additive genetic factors (A, 15.4%; 95% CI, 8.9% to 22.0%), shared environment factors (C, 11.0%; 95% CI, 7.9% to 14.1%), and unique environmental factors (E, 73.7%; 95% CI, 69.3% to 78.0%).
- Odds of weak HGS in offspring according to parental muscle strength
- Based on the findings indicating that HGS exhibited a familial correlation and that 15.4% of the variance in the HGS phenotype was explained by additive genetic influence, we analyzed the odds of weak HGS of the offspring according to the HGS of their parents (Table 4). The LS mean of HGS in the offspring from either one (31.4±0.5 kg, P<0.001) or both parents with weak HGS (30.3±1.4 kg, P=0.048) was significantly lower than that in the offspring from both parents with normal HGS (33.0±0.5 kg). Moreover, the odds of weak HGS was significantly higher in the offspring of either one parent with weak HGS (odds ratio [OR], 1.69; 95% CI, 1.03 to 2.78) than in those of both parents with normal HGS. The odds of weak HGS was even higher in the offspring of both parents with weak HGS (OR, 3.10; 95% CI, 1.14 to 8.45). In the sensitivity analyses, utilizing a different threshold for weak HGS based on the sarcopenia definition of KWGS 2023, we also observed significantly higher odds of weak HGS in the offspring of either one or both parents with weak HGS, in comparison to those with both parents having normal HGS (OR, 1.73; 95% CI, 1.09 to 2.75 and OR, 2.64; 95% CI, 1.07 to 6.49, respectively) (Supplemental Table S1).
- Next, we analyzed the odds of weak HGS in offspring, dividing them into sons and daughters, based on parental HGS (Table 5). In the sons, the LS mean of HGS and odds of weak HGS were not significantly different according to parental HGS (Table 5). However, in the daughters, the LS mean of HGS was significantly lower when either one of the parents had weak HGS (22.5±0.6 kg, P<0.001) than when both parents had normal HGS (24.4±0.4 kg). Moreover, the odds of weak HGS significantly increased in daughters when either one or both parents had weak HGS (OR, 2.04; 95% CI, 1.08 to 3.87 and OR, 4.64; 95% CI, 1.12 to 19.13, respectively) than when both parents had normal HGS (Table 5). However, the interaction term of the offspring’s sex on the presence of weak HGS in parents was not significant (data not shown). In the sensitivity analyses using the KWGS 2023 threshold, we observed that the odds for weak HGS did not differ significantly based on parental HGS in sons, while a significant increase was observed in daughters when either one or both parents exhibited weak HGS (OR, 1.76; 95% CI, 1.02 to 3.10 and OR, 3.73; 95% CI, 1.36 to 10.24, respectively) (Supplemental Table S2).
RESULTS
- In this study, we analyzed a Korean family-based cohort comprising a large number of parent-adult offspring pairs and found that there was a familial correlation in the HGS of adults. HGS also exhibited a significant heritable tendency in Korean families. Specifically, the phenotypic variance in HGS in Korean adults could be explained by additive genetic (15.4%), shared family environmental (11.0%), and unique individual environmental influences (73.7%). Moreover, the odds of weak HGS increased in the adult offspring of at least one parent with weak HGS than in those of both parents with normal HGS. However, on analyzing the odds of weak HGS by the sex of the offspring, significant changes based on parental HGS were only seen in daughters and not in sons.
- The heritability of the muscle phenotype, including muscle mass and strength, has long been an interesting subject of research because the genetic determination of the muscle phenotype in humans could lead to the discovery of the causes and contributors responsible for age-related muscle weakness and thus to the development of preventive strategies [11]. In previous studies on twin pairs, the heritability estimate of grip strength varied from 14% to 88% [16-19]. Moreover, a study including adult twin pairs revealed a slightly curvilinear heritability of grip strength across the ages of 45 to 96 years; the maximum heritability of approximately 60% was observed in the youngest group, which reached the minimum heritability of approximately 50% at the age of 70 years [20]. Similarly, in a recent meta-analysis of studies on the heritability of the muscle strength-related phenotype in twins and families, the total heritability estimate of grip strength was 56% and that of the muscle strength-related phenotype was inversely correlated with age [11]; these findings showed that muscle strength is heritable but that the effect of environmental factors may gradually increase with age. Various candidate gene association studies or genome-wide association studies conducted to gain a deeper understanding of the genetic association underpinning the muscle phenotypes relevant to sarcopenia have indicated that a number of genes, such as alpha-actinin 3 (ACTN3), angiotensin converting enzyme (ACE), and vitamin D receptor (VDR), are associated with the inter-individual variation in muscle phenotypes in the elderly [21]. Another studies that analyzed elderly Europeans from the Cohorts for Heart and Aging Research in Genomic Epidemiology (CHARGE) consortium also identified several loci associated with HGS [22,23]. Although these findings helped to further elucidate the genetic basis of sarcopenia, the genetic mechanism underpinning the age-related changes in the muscle phenotype is still largely uncharted due to the limited number of studies in this field.
- In this regard, the familial correlation and significant heritability of HGS in the large number of Korean families in the present study has provided additional evidence for the contribution of genetic factors to the inter-individual variability of the muscle phenotype in humans. In the present study, we analyzed Korean families comprising parents and their adult offspring and found that HGS was reduced and the odds of weak HGS was increased in Korean adult offspring of parents with weak HGS than in those of parents with normal HGS. While sarcopenia has been regarded as a disease that should be prevented or treated mainly in the elderly, the muscle health status in the elderly is also a result of that in their youth [24,25]. It is well known that muscle mass and strength reach maximal levels in young adulthood until up to approximately 40 years and that they start to decrease by approximately 1% to 5% per year beyond the age of 50 years [5,26]. Therefore, efforts to maximize muscle mass and strength in young adulthood and to maintain them in middle age will be helpful in preventing the problematic loss of these muscle parameters to the degree that sarcopenia develops in later life [8]. In this context, the heritable tendency and significant associations between the HGS of parents and their adult offspring in our study suggest that adults whose parents have weak HGS should pay a lot of attention to improving and maintaining their muscle health during their youth.
- While it has been well established that aging is associated with the deterioration of muscle health in both men and women, there have also been studies that have highlighted the influence of sex on changes in muscle mass and strength with aging [27]. A previous study compared the longitudinal change in muscle strength between male and female same-sex twins from early adolescence to young adulthood and reported that the variability and total increase in muscle strength were higher in male adolescents than in female ones [16]. Previous studies have reported that men may experience greater muscle mass loss with aging, while the deterioration of muscle quality may be greater in older women [28-30]. Moreover, a recent study on myocellular aging revealed more severe type II myofiber atrophy, higher type I myofiber grouping, and greater myofiber size heterogeneity in older women than in older men [31]. Although the mechanistic basis of these sex differences in aging-related changes in the muscle phenotype remains to be elucidated, the effects of sex hormones and genetic and environmental factors have been considered as possible contributors [27]. Testosterone increases muscle size and reinforces muscle strength, whereas estrogen does not produce definitive positive effects on muscles; therefore, androgen-mediated mechanisms involving various testosterone concentrations based on each individual’s genetic and environmental factors powerfully shape the development of muscle strength in male adolescents, while this effect is subdued or lacking in female adolescents [32,33]. Moreover, elderly men with declining testosterone levels exhibit more rapid muscle loss than women with decreasing estrogen levels [34-36]. In the present study, although there were significant familial correlations in the HGS of both sons and daughters with that of their parents, the odds of weak HGS in the offspring changed significantly based on parental HGS, especially in daughters rather than in sons. In light of the findings in previous studies, a possible reason for this might be that the heritable tendency and effect of shared family environmental factors within a family meaningfully affect muscle health in young Korean female adults, while the effects of testosterone and unique individual environmental factors are important in young Korean male adults. Therefore, women who have parents with weak HGS should pay more attention to muscle health from their youth since sarcopenia may be a greater public health problem in women in view of their longer lifespan and higher rates of disability [37].
- The HGS heritability estimates calculated in the large number of Korean families in our study were somewhat low compared with those reported in old twin or family studies that were mostly conducted in Western countries [11]. In our study, it appeared that a unique environmental influence, rather than a genetic influence, was a stronger determinant of the phenotypic variance in HGS, even though there is a significant heritable tendency in HGS. Furthermore, the higher correlation coefficient between spouses compared to that between parents and offspring, as well as between siblings, suggests that shared environmental influences play a more dominant role in determining the familial correlation of HGS than genetic influences in Korean families. Environmental factors, such as nutrition and physical exercise, can influence musculoskeletal development by favoring and maintaining peak muscle mass and strength in early and adult life and can also affect the decline in muscle mass and strength commonly seen with aging [4,38,39]. Since the rate of decline in muscle mass and strength during older life depends on the previously reached peak, the implementation of preventive strategies for maximizing the peak at a young age and for maintaining the peak in adulthood with adequate nutrition and physical activity has been regarded as an important intervention for minimizing the decline in muscle mass and strength in older life [40]. Previous studies have reported that unhealthy behaviors in midlife are associated with poor physical performance in older life, while higher levels of physical activity during midlife are associated with good physical performance in older life [41,42]. Therefore, the results of our present study have highlighted the importance of healthy environmental stimuli for promoting muscle health during youth in order to prevent age-related muscle deterioration, especially when an individual’s parents have weak HGS. In a similar context, the fact that sons consumed larger amounts of protein and exercised more often than daughters in the present study might be the possible reason why the risk of weak HGS in sons did not change based on parental HGS, unlike in daughters. Additionally, serum vitamin D levels are known to be linked with HGS [43-45] and prior research has highlighted a familial correlation in serum vitamin D levels, primarily influenced by shared environmental factors rather than genetics [46]. Therefore, it is possible that the familial correlation of HGS observed in our study may have been driven by the familial correlation in serum vitamin D levels although we were unable to directly examine the impact of serum vitamin D levels on the familial correlation of HGS due to limited serum vitamin D level data for most of our study participants. However, the low heritability estimates of HGS in our study compared with those in previous studies might have also originated from differences in race and study period.
- This study has several strengths. First, this study is the first to evaluate the familial correlation and heritability of HGS in a large number of Asian families. Although many differences in human health and diseases between races or ethnicities can originate from genetic differences [47], most previous studies investigating the heritability of muscle health were performed in Western countries with a very small number of Asians. Therefore, the present study provides novel insights into the pattern of genetic influences on the phenotypic variation in HGS in Asian populations. Second, we analyzed data from a nationwide survey conducted in Korea (KNHANES), which included a nationally representative sample of non-institutionalized Korean civilians; this enhances the credibility of our study’s results. However, this study had some limitations. First, the cross-sectional nature of the KNHANES meant that we could not determine causation in this study. Second, since there are no standard cutoff values for determining weak HGS in young and middle-aged adults, we applied the same cutoff values in both parents and their offspring. The cutoff values for weak HGS used in this study were those presented in a previous KNHANES study, which established a reference value for HGS in 7,969 South Koreans according to age and proposed a cutoff value for weak HGS by deriving –2 SD values in young healthy Korean adults, as recommended by the European Working Group on Sarcopenia in Older People (EWGSOP) [13,38]. Lastly, while sarcopenia encompasses multiple components, such as reduced muscle mass, diminished muscle strength, and compromised physical performance, our investigation primarily focused on examining the heritability of muscle strength utilized HGS as the parameter of interest. Therefore, further research aimed at encompassing a broader range of factors contributing to sarcopenia would enhance our understanding of the genetic underpinnings of sarcopenia.
- In conclusion, we found a familial correlation and significant heritable tendency in HGS in a large nationally representative family-based cohort in South Korea. In this study, the possible parental influences on the risk of weak HGS in adult offspring seemed especially important in daughters. Nevertheless, unique individual environmental factors were the strongest determinants of the phenotypic variance in HGS. Therefore, we recommend that Asian adults, especially women, who have parents with weak HGS, pay special attention to their muscle health with the help of healthy environmental stimuli.
DISCUSSION
Supplementary Material
Supplemental Table S1.
Supplemental Table S2.
-
CONFLICTS OF INTEREST
No potential conflict of interest relevant to this article was reported.
-
AUTHOR CONTRIBUTIONS
Conception or design: S.H.A., Y.J.S. Acquisition, analysis, or interpretation of data: S.H.A., E.B.P., Y.J.S., S.H. Drafting the work or revising: S.H.A., Y.J.S. Final approval of the manuscript: S.H.A., E.B.P., S.S., Y.C., D.H.S., S.H.K., Y.J.S., S.H.
Article information
-
Acknowledgements
- This study was supported by Inha University Research Grant.
| Variable |
Parents |
Offspring |
|||||
|---|---|---|---|---|---|---|---|
| Father (n=1,527) | Mother (n=1,527) | P valuea | Son (n=1,017) | Daughter (n=933) | P valuea | ||
| Age, yr | 58.4±7.9 | 55.1±7.6 | <0.001 | 27.8±7.6 | 26.8±6.6 | 0.004 | |
| BMI, kg/m2 | 24.4±2.9 | 23.9±3.4 | <0.001 | 24.3±4.1 | 21.7±3.8 | <0.001 | |
| HGS, kg | 39.3±7.5 | 24.4±5.0 | <0.001 | 41.8±8.0 | 24.0±4.8 | <0.001 | |
| Weak HGS | 121 (7.9) | 105 (6.9) | 0.269 | 53 (5.2) | 58 (6.2) | 0.339 | |
| Smoking | 1,187 (79.1) | 57 (3.8) | <0.001 | 533 (53.1) | 111 (12.0) | <0.001 | |
| Drinking | 326 (21.7) | 45 (3.0) | <0.001 | 159 (16.0) | 68 (7.3) | <0.001 | |
| Exercise | 429 (29.7) | 220 (14.8) | <0.001 | 366 (37.4) | 174 (19.0) | <0.001 | |
| Protein intake, g/day | 80.9 (68.4) | 58.9 (27.2) | <0.001 | 95.3 (58.9) | 67.2 (38.2) | <0.001 | |
| Comorbidities | |||||||
| Diabetes | 288 (19.8) | 151 (10.2) | <0.001 | 16 (1.7) | 11 (1.2) | 0.441 | |
| Hypertension | 626 (41.9) | 421 (27.9) | <0.001 | 94 (9.5) | 27 (2.9) | <0.001 | |
| Arthritis | 65 (4.5) | 212 (14.2) | <0.001 | 8 (0.8) | 5 (0.6) | 0.472 | |
| Thyroid disease | 21 (1.4) | 53 (3.6) | <0.001 | 3 (0.3) | 7 (0.8) | 0.170 | |
| Cancers | 70 (4.8) | 106 (7.1) | 0.009 | 3 (0.3) | 11 (1.2) | 0.023 | |
| Stroke | 18 (1.2) | 4 (0.3) | 0.002 | 2 (0.2) | 0 | 0.171 | |
| Coronary artery disease | 60 (4.1) | 17 (1.1) | <0.001 | 2 (0.2) | 0 | 0.171 | |
| Chronic kidney disease | 8 (0.6) | 2 (0.1) | 0.052 | 1 (0.1) | 2 (0.2) | 0.526 | |
ICC for hand grip strength were estimated to evaluate familial correlations between specific family pairs within the pedigrees, after adjustments for important confounding variables, such as sex, age, body mass index, protein intake, smoking status, alcohol consumption, exercise habits, and comorbidities.
ICC, intraclass correlation coefficient; CI, confidence interval.
| Modela |
Crude model |
Adjusted model |
|||||||
|---|---|---|---|---|---|---|---|---|---|
| h2±SE (95% CI) | P value | –2 LLb | h2±SE (95% CI) | P value |
Variance componentc |
–2 LLd | |||
| A | C | E | |||||||
| ACEe | 0.215±0.038 (0.177–0.253) | <0.001 | 28,363.2036 | 0.154±0.066 (0.089–0.220)e | <0.001e | 0.154e | 0.110e | 0.737e | 19,092.8807e |
| AE | 0.215±0.038 (0.177–0.253) | <0.001 | 28,363.2036 | 0.344±0.035 (0.309–0.378) | <0.001 | 0.344 | 0.656 | 19,104.9556 | |
| CE | 28,395.8128 | 0.167 | 0.833 | 19,098.3457 | |||||
| E | 28,395.8128 | 1.000 | 19,199.8823 | ||||||
Heritability (h2) was estimated as the proportion of the total phenotypic variance explained by additive genetic effects using variance component analysis.
Adjusted model included sex, age, body mass index, protein intake, smoking status, alcohol consumption, exercise habits, and comorbidities as confounders.
SE, standard error; CI, confidence interval; LL, log-likelihood.
a ACE=additive genetic factors and shared and unique environmental factors included in the variance component model, AE=additive genetic factors and unique environmental factors included in the variance component model, CE=shared and unique environmental factors included in the variance component model, and E=unique environmental factors included in the variance component model;
b –2×log-likelihood for the corresponding model before adjustments for confounders;
c A=additive genetic factors, C=shared environmental factors, and E=unique environmental factors in the variance component model after adjustments for confounders;
d –2×log-likelihood for the corresponding model after adjustments for confounders;
e Best-fitted model after adjusting for confounders was selected using the likelihood ratio test.
| Parental HGS | LS mean HGS in offspring, kg | P valuea |
Offspring |
OR (95% CI) | P valueb | |
|---|---|---|---|---|---|---|
| Weak HGS (n=111) | Normal (n=1,839) | |||||
| No parent with weak HGS (n=1,707) | 33.0±0.5 | - | 88 (79.3) | 1,619 (88.0) | 1.00 | - |
| One parent with weak HGS (n=218) | 31.4±0.6 | <0.001 | 19 (17.1) | 199 (10.8) | 1.69 (1.03–2.78) | 0.038 |
| Both parents with weak HGS (n=25) | 30.3±1.4 | 0.048 | 4 (3.6) | 21 (1.1) | 3.10 (1.14–8.45) | 0.027 |
Values are expressed as mean±standard error or number (%) unless otherwise indicated. The cutoff values for weak HGS were defined as <28.9 and <16.8 kg in men and women, respectively.
HGS, hand grip strength; LS, least-square; OR, odds ratio; CI, confidence interval.
a P values were obtained in the mixed model, on assuming that random effects accounted for correlations within the same family;
b P values were obtained through conditional logistic regression analysis.
| Parental HGS | LS mean HGS in offspring, kg | P valuea |
Offspring |
OR (95% CI) | P valueb | ||
|---|---|---|---|---|---|---|---|
| Weak HGS | Normal | ||||||
| Son | n=53 | n=964 | |||||
| No parent with weak HGS (n=891) | 40.8±1.2 | - | 44 (83.0) | 847 (87.9) | 1.00 | - | |
| One parent with weak HGS (n=109) | 39.2±1.4 | 0.063 | 7 (13.2) | 102 (10.6) | 1.30 (0.59–2.89) | 0.519 | |
| Both parents with weak HGS (n=17) | 37.5±2.2 | 0.095 | 2 (3.8) | 15 (1.6) | 2.38 (0.58–9.83) | 0.230 | |
| Daughter | n=58 | n=875 | |||||
| No parent with weak HGS (n=816) | 24.4±0.4 | - | 44 (75.9) | 772 (88.2) | 1.00 | - | |
| One parent with weak HGS (n=109) | 22.5±0.6 | <0.001 | 12 (20.7) | 97 (11.1) | 2.04 (1.08–3.87) | 0.029 | |
| Both parents with HGS (n=8) | 22.5±1.8 | 0.283 | 2 (3.5) | 6 (0.7) | 4.64 (1.12–19.13) | 0.034 | |
Values are expressed as mean±standard error or number (%) unless otherwise indicated. The cutoff values for weak HGS were defined as <28.9 and <16.8 kg in men and women, respectively.
HGS, hand grip strength; LS, least-square; OR, odds ratio; CI, confidence interval.
a P values were obtained in the mixed model, on assuming that random effects accounted for correlations within the same family;
b P values were obtained through conditional logistic regression analysis.
- 1. Rosenberg IH. Sarcopenia: origins and clinical relevance. J Nutr 1997;127(5 Suppl):990S–1S.ArticlePubMed
- 2. Dao T, Green AE, Kim YA, Bae SJ, Ha KT, Gariani K, et al. Sarcopenia and muscle aging: a brief overview. Endocrinol Metab (Seoul) 2020;35:716–32.ArticlePubMedPMCPDF
- 3. Beaudart C, Zaaria M, Pasleau F, Reginster JY, Bruyere O. Health outcomes of sarcopenia: a systematic review and meta-analysis. PLoS One 2017;12:e0169548.ArticlePubMedPMC
- 4. Cruz-Jentoft AJ, Sayer AA. Sarcopenia. Lancet 2019;393:2636–46.ArticlePubMed
- 5. Dodds RM, Syddall HE, Cooper R, Benzeval M, Deary IJ, Dennison EM, et al. Grip strength across the life course: normative data from twelve British studies. PLoS One 2014;9:e113637.ArticlePubMedPMC
- 6. Degens H, Korhonen MT. Factors contributing to the variability in muscle ageing. Maturitas 2012;73:197–201.ArticlePubMed
- 7. Khanal P, He L, Herbert AJ, Stebbings GK, Onambele-Pearson GL, Degens H, et al. The association of multiple gene variants with ageing skeletal muscle phenotypes in elderly women. Genes (Basel) 2020;11:1459.ArticlePubMedPMC
- 8. Sayer AA, Syddall H, Martin H, Patel H, Baylis D, Cooper C. The developmental origins of sarcopenia. J Nutr Health Aging 2008;12:427–32.ArticlePubMedPMCPDF
- 9. Visscher PM, Hill WG, Wray NR. Heritability in the genomics era: concepts and misconceptions. Nat Rev Genet 2008;9:255–66.ArticlePubMedPDF
- 10. Mayhew AJ, Meyre D. Assessing the heritability of complex traits in humans: methodological challenges and opportunities. Curr Genomics 2017;18:332–40.ArticlePubMedPMC
- 11. Zempo H, Miyamoto-Mikami E, Kikuchi N, Fuku N, Miyachi M, Murakami H. Heritability estimates of muscle strength-related phenotypes: a systematic review and meta-analysis. Scand J Med Sci Sports 2017;27:1537–46.ArticlePubMedPDF
- 12. Korea Disease Control and Prevention Agency. The sixth to eighth Korea National Health and Nutrition Examination Survey (KNHANES VI-VIII); Cheongju: KDCA; 2014-2019.
- 13. Kim CR, Jeon YJ, Kim MC, Jeong T, Koo WR. Reference values for hand grip strength in the South Korean population. PLoS One 2018;13:e0195485.ArticlePubMedPMC
- 14. Baek JY, Jung HW, Kim KM, Kim M, Park CY, Lee KP, et al. Korean Working Group on Sarcopenia Guideline: expert consensus on sarcopenia screening and diagnosis by the Korean Society of Sarcopenia, the Korean Society for Bone and Mineral Research, and the Korean Geriatrics Society. Ann Geriatr Med Res 2023;27:9–21.ArticlePubMedPMCPDF
- 15. Rosner B. Fundamentals of biostatistics; 8th ed. Boston: Cengage; 2015.
- 16. Isen J, McGue M, Iacono W. Genetic influences on the development of grip strength in adolescence. Am J Phys Anthropol 2014;154:189–200.ArticlePubMedPMC
- 17. Arden NK, Spector TD. Genetic influences on muscle strength, lean body mass, and bone mineral density: a twin study. J Bone Miner Res 1997;12:2076–81.ArticlePubMed
- 18. Frederiksen H, Gaist D, Petersen HC, Hjelmborg J, McGue M, Vaupel JW, et al. Hand grip strength: a phenotype suitable for identifying genetic variants affecting mid- and latelife physical functioning. Genet Epidemiol 2002;23:110–22.ArticlePubMed
- 19. Silventoinen K, Magnusson PK, Tynelius P, Kaprio J, Rasmussen F. Heritability of body size and muscle strength in young adulthood: a study of one million Swedish men. Genet Epidemiol 2008;32:341–9.ArticlePubMed
- 20. McGue M, Christensen K. Growing old but not growing apart: twin similarity in the latter half of the lifespan. Behav Genet 2013;43:1–12.ArticlePubMedPMCPDF
- 21. Pratt J, Boreham C, Ennis S, Ryan AW, De Vito G. Genetic associations with aging muscle: a systematic review. Cells 2019;9:12.ArticlePubMedPMC
- 22. Matteini AM, Tanaka T, Karasik D, Atzmon G, Chou WC, Eicher JD, et al. GWAS analysis of handgrip and lower body strength in older adults in the CHARGE consortium. Aging Cell 2016;15:792–800.ArticlePubMedPMCPDF
- 23. Jones G, Trajanoska K, Santanasto AJ, Stringa N, Kuo CL, Atkins JL, et al. Genome-wide meta-analysis of muscle weakness identifies 15 susceptibility loci in older men and women. Nat Commun 2021;12:654.PubMedPMC
- 24. Cruz-Jentoft AJ, Bahat G, Bauer J, Boirie Y, Bruyere O, Cederholm T, et al. Sarcopenia: revised European consensus on definition and diagnosis. Age Ageing 2019;48:601.ArticlePubMedPMCPDF
- 25. Gustafsson T, Ulfhake B. Sarcopenia: what is the origin of this aging-induced disorder? Front Genet 2021;12:688526.ArticlePubMedPMC
- 26. Keller K, Engelhardt M. Strength and muscle mass loss with aging process: age and strength loss. Muscles Ligaments Tendons J 2014;3:346–50.ArticlePubMedPMC
- 27. Doherty TJ. The influence of aging and sex on skeletal muscle mass and strength. Curr Opin Clin Nutr Metab Care 2001;4:503–8.ArticlePubMed
- 28. Janssen I, Heymsfield SB, Wang ZM, Ross R. Skeletal muscle mass and distribution in 468 men and women aged 18-88 yr. J Appl Physiol (1985) 2000;89:81–8.ArticlePubMed
- 29. Phillips SK, Rook KM, Siddle NC, Bruce SA, Woledge RC. Muscle weakness in women occurs at an earlier age than in men, but strength is preserved by hormone replacement therapy. Clin Sci (Lond) 1993;84:95–8.ArticlePubMedPDF
- 30. Frontera WR, Suh D, Krivickas LS, Hughes VA, Goldstein R, Roubenoff R. Skeletal muscle fiber quality in older men and women. Am J Physiol Cell Physiol 2000;279:C611–8.ArticlePubMed
- 31. Roberts BM, Lavin KM, Many GM, Thalacker-Mercer A, Merritt EK, Bickel CS, et al. Human neuromuscular aging: sex differences revealed at the myocellular level. Exp Gerontol 2018;106:116–24.ArticlePubMedPMC
- 32. Hansen L, Bangsbo J, Twisk J, Klausen K. Development of muscle strength in relation to training level and testosterone in young male soccer players. J Appl Physiol (1985) 1999;87:1141–7.ArticlePubMed
- 33. Harris JA, Vernon PA, Boomsma DI. The heritability of testosterone: a study of Dutch adolescent twins and their parents. Behav Genet 1998;28:165–71.PubMed
- 34. Bhasin S, Storer TW, Berman N, Callegari C, Clevenger B, Phillips J, et al. The effects of supraphysiologic doses of testosterone on muscle size and strength in normal men. N Engl J Med 1996;335:1–7.ArticlePubMed
- 35. Baumgartner RN, Waters DL, Gallagher D, Morley JE, Garry PJ. Predictors of skeletal muscle mass in elderly men and women. Mech Ageing Dev 1999;107:123–36.ArticlePubMed
- 36. Waters DL, Yau CL, Montoya GD, Baumgartner RN. Serum sex hormones, IGF-1, and IGFBP3 exert a sexually dimorphic effect on lean body mass in aging. J Gerontol A Biol Sci Med Sci 2003;58:648–52.ArticlePubMed
- 37. Roubenoff R, Hughes VA. Sarcopenia: current concepts. J Gerontol A Biol Sci Med Sci 2000;55:M716–24.ArticlePubMed
- 38. Cruz-Jentoft AJ, Baeyens JP, Bauer JM, Boirie Y, Cederholm T, Landi F, et al. Sarcopenia: European consensus on definition and diagnosis: report of the European Working Group on Sarcopenia in Older People. Age Ageing 2010;39:412–23.PubMedPMC
- 39. Rogeri PS, Zanella R Jr, Martins GL, Garcia MD, Leite G, Lugaresi R, et al. Strategies to prevent sarcopenia in the aging process: role of protein intake and exercise. Nutrients 2021;14:52.ArticlePubMedPMC
- 40. Azzolino D, Spolidoro GCI, Saporiti E, Luchetti C, Agostoni C, Cesari M. Musculoskeletal changes across the lifespan: nutrition and the life-course approach to prevention. Front Med (Lausanne) 2021;8:697954.ArticlePubMedPMC
- 41. Sabia S, Elbaz A, Rouveau N, Brunner EJ, Kivimaki M, Singh-Manoux A. Cumulative associations between midlife health behaviors and physical functioning in early old age: a 17-year prospective cohort study. J Am Geriatr Soc 2014;62:1860–8.ArticlePubMedPMCPDF
- 42. Patel KV, Coppin AK, Manini TM, Lauretani F, Bandinelli S, Ferrucci L, et al. Midlife physical activity and mobility in older age: the InCHIANTI study. Am J Prev Med 2006;31:217–24.PubMedPMC
- 43. Houston DK, Tooze JA, Neiberg RH, Hausman DB, Johnson MA, Cauley JA, et al. 25-Hydroxyvitamin D status and change in physical performance and strength in older adults: the Health, Aging, and Body Composition Study. Am J Epidemiol 2012;176:1025–34.ArticlePubMedPMC
- 44. Iolascon G, Mauro GL, Fiore P, Cisari C, Benedetti MG, Panella L, et al. Can vitamin D deficiency influence muscle performance in postmenopausal women?: a multicenter retrospective study. Eur J Phys Rehabil Med 2018;54:676–82.ArticlePubMed
- 45. Kitsu T, Kabasawa K, Ito Y, Kitamura K, Watanabe Y, Tanaka J, et al. Low serum 25-hydroxyvitamin D is associated with low grip strength in an older Japanese population. J Bone Miner Metab 2020;38:198–204.ArticlePubMedPDF
- 46. Hong N, Lee YK, Rhee Y. Familial clustering of vitamin D deficiency via shared environment: the Korean National Health and Nutrition Examination Survey 2008-2012. Eur J Clin Nutr 2018;72:1700–8.ArticlePubMedPDF
- 47. Huang T, Shu Y, Cai YD. Genetic differences among ethnic groups. BMC Genomics 2015;16:1093.ArticlePubMedPMC
References
Figure & Data
References
Citations
 PubReader
 ePub Link
 Cite
Cite- Figure
-


- Related articles
-
- Intake of Fruit and Glycemic Control in Korean Patients with Diabetes Mellitus Using the Korea National Health and Nutrition Examination Survey
- Corrigendum: Abstract and Text Correction. Thyroid Stimulating Hormone Reference Range and Prevalence of Thyroid Dysfunction in the Korean Population: Korea National Health and Nutrition Examination Survey 2013 to 2015

