
Articles
- Page Path
- HOME > Endocrinol Metab > Volume 36(3); 2021 > Article
-
Original ArticleDiabetes, Obesity and Metabolism Reference Values for Skeletal Muscle Mass at the Third Lumbar Vertebral Level Measured by Computed Tomography in a Healthy Korean Population
-
Ja Kyung Yoon1
 , Sunyoung Lee1, Kyoung Won Kim2, Ji Eun Lee3, Jeong Ah Hwang4, Taeyong Park5, Jeongjin Lee5
 -
Endocrinology and Metabolism 2021;36(3):672-677.
DOI: https://doi.org/10.3803/EnM.2021.1041
Published online: June 8, 2021
1Department of Radiology and Research Institute of Radiological Science, Severance Hospital, Yonsei University College of Medicine, Seoul, Korea
2Department of Radiology and Research Institute of Radiology, Asan Medical Center, University of Ulsan College of Medicine, Seoul, Korea
3Department of Radiology, Soonchunhyang University Bucheon Hospital, Soonchunhyang University College of Medicine, Bucheon, Korea
4Department of Radiology and Center for Imaging Science, Samsung Medical Center, Sungkyunkwan University School of Medicine, Seoul, Korea
5School of Computer Science and Engineering, Soongsil University, Seoul, Korea
- Corresponding author: Sunyoung Lee. Department of Radiology and Research Institute of Radiological Science, Severance Hospital, Yonsei University College of Medicine, 50-1 Yonsei-ro, Seodaemun-gu, Seoul 03722, Korea, Tel: +82-2-2228-7400, Fax: +82-2-2227-8337, E-mail: carnival0126@gmail.com
Copyright © 2021 Korean Endocrine Society
This is an Open Access article distributed under the terms of the Creative Commons Attribution Non-Commercial License (https://creativecommons.org/licenses/by-nc/4.0/) which permits unrestricted non-commercial use, distribution, and reproduction in any medium, provided the original work is properly cited.
ABSTRACT
-
Background
- Sarcopenia is defined as the loss of skeletal muscle mass and is associated with negative clinical outcomes. This study aimed to establish sex-specific cutoff values for the skeletal muscle area (SMA) and skeletal muscle index (SMI) at the third lumbar vertebral (L3) level using computed tomography (CT) imaging to identify sarcopenia in healthy Korean liver donors.
-
Methods
- This retrospective study included 659 healthy liver donors (408 men and 251 women) aged 20 to 60 years who had undergone abdominal CT examinations between January 2017 and December 2018. Assessment of body composition was performed with an automated segmentation technique using a deep-learning system. Sex-specific SMA and SMI distributions were assessed, and cutoff values for determining sarcopenia were defined as values at either two standard deviations (SDs) below the mean reference value or below the fifth percentile.
-
Results
- Using the SD definition, cutoff values for SMA and SMI were 117.04 cm2 and 39.33 cm2/m2, respectively, in men and 71.39 cm2 and 27.77 cm2/m2, respectively, in women. Using the fifth percentile definition, cutoff values for SMA and SMI were 126.88 cm2 and 40.96 cm2/m2, respectively, in men and 78.85 cm2 and 30.60 cm2/m2, respectively, in women.
-
Conclusion
- Our data provide sex-specific cutoff values for the SMA and SMI at the L3 level measured by CT imaging in a healthy Korean population, which may be applicable for identifying sarcopenia in this population.
- Sarcopenia is defined as the generalized and progressive loss of skeletal muscle mass (SMM) and muscle strength associated with metabolic, physiologic, and functional impairments and poor clinical outcomes, including increased mortality and disability and a reduced quality of life [1–3]. Despite its clinical significance, the evaluation of sarcopenia has been hindered by a diversity of measurement methods, including dual energy X-ray absorptiometry (DXA), bioelectric impedance analysis (BIA), magnetic resonance imaging, and computed tomography (CT) imaging. The most widely used assessment tool for SMM is DXA, and sex-specific cutoff values have been established for this technique using the appendicular skeletal muscle index (SMI; appendicular SMM/height2) [2–4].
- CT imaging is considered a gold standard for the evaluation of body composition, and cross-sectional muscle areas of specific muscles or body locations is an easily applicable method for measuring the SMM using CT imaging [2,3]. Quantitative measurements of the cross-sectional skeletal muscle area (SMA) and SMI (SMA/height2) using CT imaging are most commonly assessed at the level of the third lumbar vertebra (L3) and are known to significantly correlate with whole-body muscle [3,5,6]. Cutoff values for the SMI at the L3 level using CT imaging have been reported in healthy Western populations [7,8]. In addition, recent studies have suggested that the psoas muscle area measured by CT imaging can be a simple method for identifying sarcopenia [3]. In healthy Asian populations, cutoff values for the psoas muscle index (PMI) at the L3 level have been proposed, although using such a small muscle for assessing the total SMM is controversial [9,10]. However, cutoff values for the SMA and SMI at the L3 level on CT scans have not been reported for sarcopenia in healthy Korean liver donors thus far.
- Therefore, this study aimed to establish sex-specific cutoff values for the SMA and SMI at the L3 level using CT imaging to identify sarcopenia in healthy Korean liver donors.
INTRODUCTION
- The study was approved by the Institutional Review Board of Asan Medical Center (AMC 2021-0473). The requirement for written informed consent was waived due to the retrospective nature of the analysis.
- Study population
- Subjects aged 20 to 60 years who had undergone abdominal CT examinations as part of an evaluation for liver donation from January 2017 to December 2018 were retrospectively identified. Data on patient age, sex, weight, and height from just before the date of CT examinations were collected from the medical record. Subjects who had fully visible abdominal muscles at the L3 level on CT imaging and who were deemed healthy enough to undergo organ donation were included in this study.
- CT image acquisition
- CT scans were performed using a 128-slice (Definition AS+ or edge, Siemens, Erlangen, Germany) multidetector-row CT scanner. Unenhanced CT scans were obtained, followed by biphasic contrast-enhanced CT imaging (hepatic arterial phase and portal venous phase) after administration of 150 mL of iopromide (Ultravist 370, Bayer Schering Pharma, Berlin, Germany) for anatomical mapping of the hepatic vasculature and CT volumetry. The scanning and reconstruction parameters were as follows: beam collimation of 128 slices (0.6 mm); spiral pitch of 1; gantry rotation time of 0.5 second; tube voltage of 100 or 120 kVp; and tube current of 120 to 200 mAs with automatic exposure control (Care Dose 4D, Siemens) and a section thickness and interval of 5 mm.
- Assessment of skeletal muscle parameters
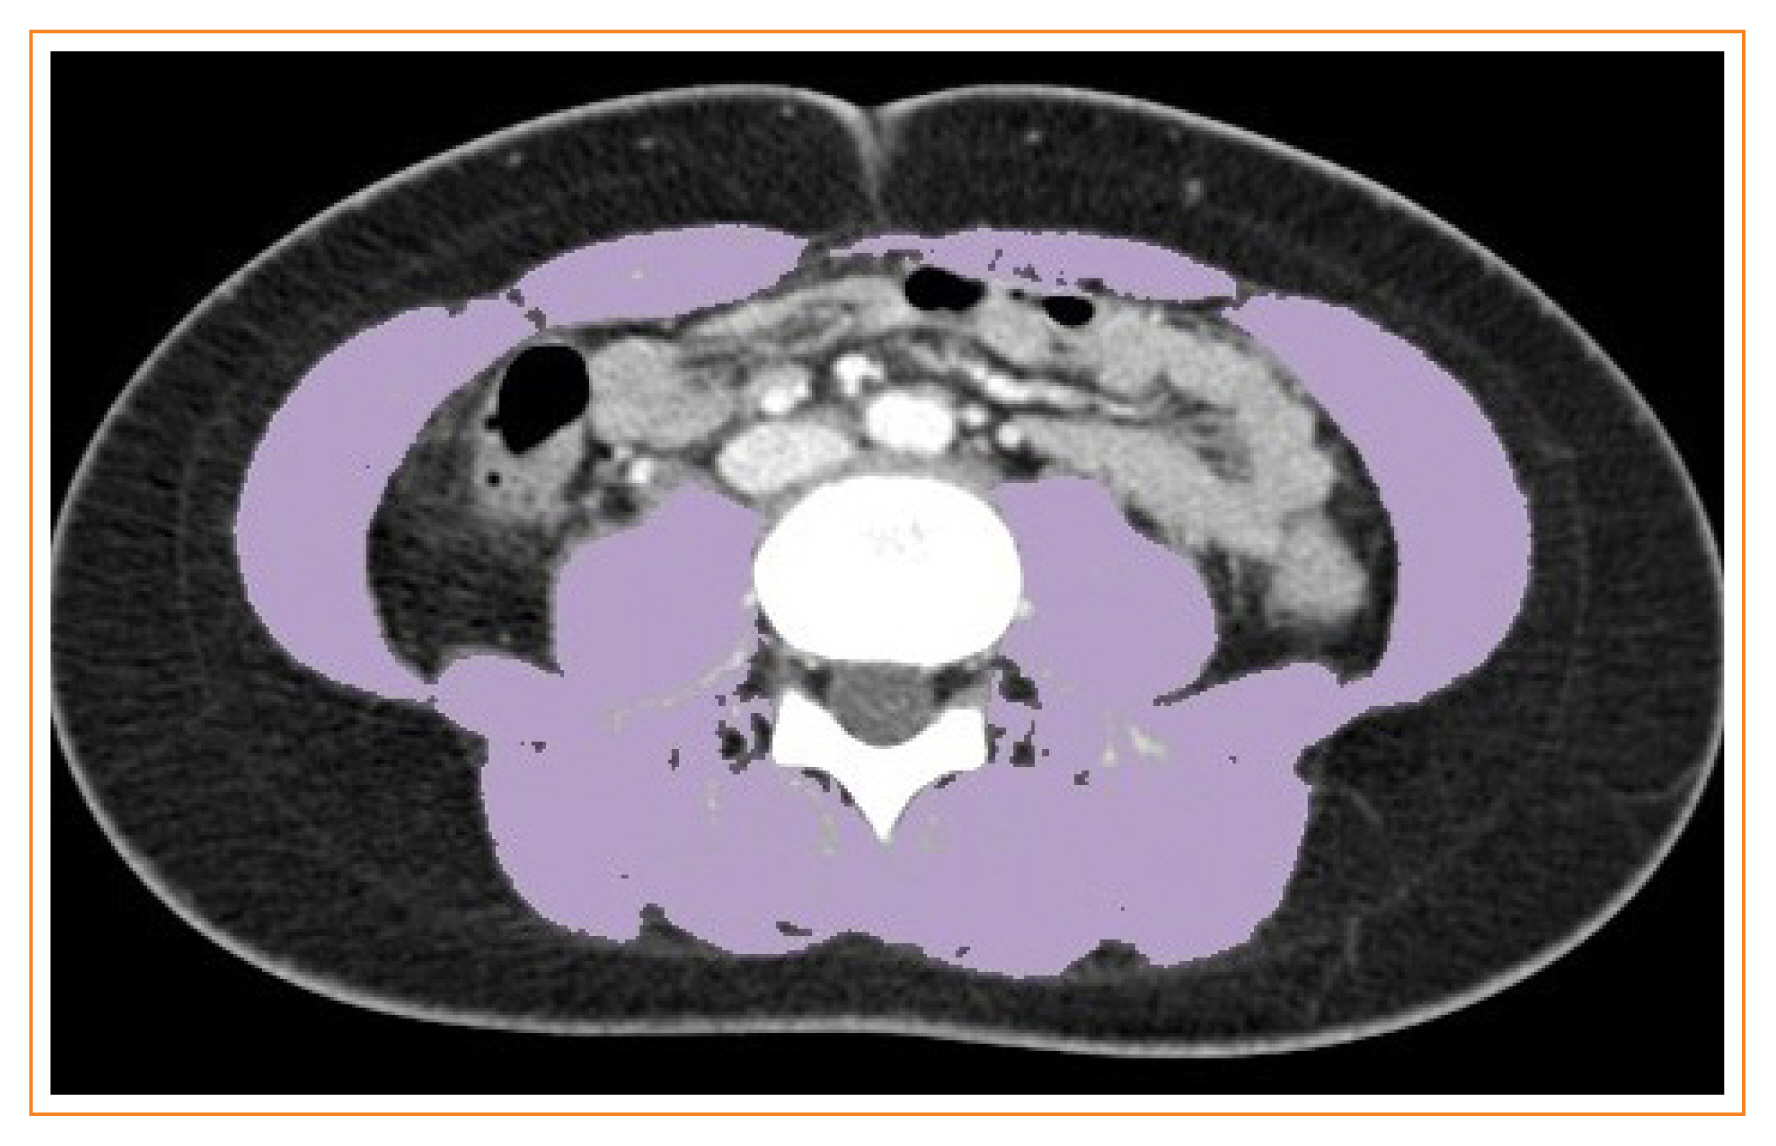
- A single axial CT image at the level of the inferior endplate of the L3 vertebra was processed for each patient. Abdominal CT image analyses were conducted with a fully convolutional network-based automatic segmentation technique using a deep-learning system [11]. The body composition was assessed using artificial intelligence software (AID-U™, iAID Inc., Seoul, Korea) [11]. CT images were automatically segmented to generate boundaries, and the total abdominal muscle area was measured. The SMA (cm2), including all muscles on selected axial images (i.e., psoas, paraspinals, transversus abdominis, rectus abdominis, quadratus lumborum, and internal and external oblique muscles) were demarcated using predetermined thresholds (−29 to 150 Hounsfield units) (Fig. 1). SMI was normalized to stature by dividing the muscle area by the height squared, as follows: SMA (cm2)/height (m2).
- Statistical analysis
- Shapiro-Wilk and Kolmogorov-Smirnov normality tests were used to determine the normality of age, weight, height, and body mass index (BMI). A two-sample t test was used for parametric variables (height), while the Mann-Whitney U test was used for non-parametric variables (age, weight, and BMI). Cutoff values for determining sarcopenia were defined as those at either two standard deviations (SDs) below the mean reference value or below the fifth percentile [1–3,7]. Statistical analyses were performed using SPSS version 23.0 (IBM, Armonk, NY, USA). A P≤0.05 was considered statistically significant.
METHODS
- The baseline subject characteristics are shown in Table 1. A total of 659 healthy liver donors (mean age±SD, 31.5±8.3 years) were included in the analysis, consisting of 408 (61.9%) men and 251 (38.1%) women. The mean age was significantly lower in men than in women (30.2 years vs. 33.5 years, P<0.001). Men were significantly heavier (73.0 kg vs. 59.1 kg, P<0.001) and taller (174.5 cm vs. 161.7 cm, P<0.001) than women.
- When the SD definition was used for defining sarcopenia in subjects aged 20 to 60 years, the cutoff values for SMA and SMI were 117.04 cm2 and 39.33 cm2/m2, respectively, in men and 71.39 cm2 and 27.77 cm2/m2, respectively, in women. For the subgroup of subjects aged 20 to 40 years, the cutoff values for SMA and SMI were 118.42 cm2 and 39.79 cm2/m2, respectively, in men and 70.11 cm2 and 27.22 cm2/m2, respectively, in women (Table 2).
- Sex-specific mean, median, minimum, maximum, and percentile values for SMA and SMI are shown in Table 3. When the fifth percentile definition was used for determining sarcopenia in subjects aged 20 to 60 years, the cutoff values for SMA and SMI were 126.88 cm2 and 40.96 cm2/m2, respectively, in men and 78.85 cm2 and 30.60 cm2/m2, respectively, in women. In the subgroup of subjects aged 20 to 40 years, the fifth percentile cutoff values for SMA and SMI were 127.99 cm2 and 42.71 cm2/m2, respectively, in men and 78.68 cm2 and 30.27 cm2/m2, respectively, in women (Table 3).
RESULTS
- In our study, sex-specific SMI cutoff values for defining sarcopenia in healthy Korean liver donors using the SD definition at the L3 level of CT scans were 39.33 cm2/m2 in men and 27.77 cm2/m2 in women. Sex-specific SMI cutoff values using the fifth percentile definition were 40.96 cm2/m2 and 30.60 cm2/m2 in men and women, respectively.
- Previous studies have proposed cutoff values using the PMI at the L3 level on CT scans in a healthy Korean population and in healthy Japanese liver donor subjects [9,10]. Although significant associations between the PMI and SMI have been reported using BIA results, SMI is known to be more accurate for assessing SMM than PMI [6,9]. Previous studies have suggested that a single SMA at the L3 level is the best compromise site for assessing total skeletal muscle and a valid proxy for assessing whole-body skeletal muscle [5,6]. Moreover, the use of the PMI to determine whole-body skeletal muscle is controversial because of the relatively small size of this muscle [3,4].
- Using the SD definition, various ranges for sex-specific cutoff values for SMI at the L3 level on CT scans have been suggested in healthy populations with different ethnicities [8,12,13]. In the present study, the sex-specific cutoff values using this definition were lower than those derived from both healthy kidney donors in the United States (45.4 cm2/m2 in men and 34.4 cm2/m2 in women) and in Turkey (42.6 cm2/m2 in men and 33.9 cm2/m2 in women) [8,13]. In healthy Asian Indians, the cutoff values using this definition were 36.5 cm2/m2 in men and 30.2 cm2/m2 in women [12]. Cutoff values for the SMI at the L3 level on CT scans using the fifth percentile definition in potential kidney donors were 41.6 cm2/m2 in men and 32.0 cm2/m2 in women in a Caucasian population, both higher than the fifth percentile cutoffs in this study [7]. In a Turkish population, the fifth percentile cutoffs were 45.0 cm2/m2 in men and 36.1 cm2/m2 in women aged 20 to 60 years old and 45.5 cm2/m2 in men and 36.2 cm2/m2 in women aged 20 to 40 years old [13]. These cutoffs were also higher than the sex-specific fifth percentile cutoff values in the respective age groups in our study [13]. These discrepant findings may be attributable to differences in ethnicity, body size, lifestyle, or culture [2,3,14,15].
- This study had several limitations. First, its retrospective design introduced an inherent bias. Second, recruiting this population of organ donors from a university hospital may have induced selection biases related to socioeconomic status and patient characteristics. In addition, since the study population of liver donors are usually in better health than the average healthy population, it may not be representative of the general healthy population. Living liver donors undergo extensive screening and they must not have diabetes nor even fatty liver. Therefore, muscle mass in this population might be overestimated. Lastly, whether the physical activity levels or muscular strength of subjects can influence the diagnosis of sarcopenia was not assessed.
- In conclusion, our data provide sex-specific cutoff values for the SMA and SMI at the L3 level measured by CT imaging in a healthy Korean population which may be applicable for identifying sarcopenia in the Korean population.
DISCUSSION
-
CONFLICTS OF INTEREST
No potential conflict of interest relevant to this article was reported.
-
AUTHOR CONTRIBUTIONS
Conception or design: J.K.Y., S.L., J.E.L., J.A.H., T.P., J.L. Acquisition, analysis, or interpretation of data: J.K.Y., S.L., K.W.K., J.E.L., J.A.H., T.P., J.L. Drafting the work or revising: J.K.Y., S.L. Final approval of the manuscript: J.K.Y., S.L., K.W.K.
Article information
-
Acknowledgements
- This research was partly supported by the MSIT (Ministry of Science and ICT), Korea, under the National Program for Excellence in SW (2018-0-00209) supervised by the IITP (Institute of Information & communications Technology Planning & Evaluation).
| Characteristic | Total | Men | Women | P value |
|---|---|---|---|---|
| Aged 20–60 yr | 659 | 408 | 251 | |
| Age, yr | ||||
| Mean±SD | 31.5±8.3 | 30.2±6.1 | 33.5±8.2 | <0.001a |
| Median | 30.0 | 28.0 | 33.0 | |
| Range | 20–59 | 20–59 | 20–59 | |
| Weight, kg | ||||
| Mean±SD | 67.7±12.0 | 73.0±10.1 | 59.1±9.6 | <0.001a |
| Median | 67.8 | 72.6 | 57.0 | |
| Range | 40.1–118.1 | 49.6–118.1 | 40.1–90.0 | |
| Height, cm | ||||
| Mean±SD | 169.6±8.5 | 174.5±6.1 | 161.7±5.3 | <0.001b |
| Median | 170.2 | 174.6 | 161.8 | |
| Range | 148.1–193.4 | 154.0–193.4 | 148.1–175.2 | |
| BMI, kg/m2 | ||||
| Mean±SD | 23.4±3.1 | 23.9±2.8 | 22.6±3.4 | <0.001a |
| Median | 23.3 | 23.7 | 22.1 | |
| Range | 16.1–38.3 | 16.1–38.3 | 16.4–35.2 | |
|
|
||||
| Aged 20–40 yr | 560 | 358 | 202 | |
| Age, yr | ||||
| Mean±SD | 28.9±5.6 | 27.9±5.3 | 30.5±5.8 | <0.001a |
| Median | 28.0 | 28.0 | 31.0 | |
| Range | 20–39 | 20–39 | 20–39 | |
| Weight, kg | ||||
| Mean±SD | 68.0±12.1 | 72.9±10.3 | 59.3±9.8 | <0.001a |
| Median | 67.9 | 72.5 | 57.4 | |
| Range | 40.5–118.1 | 49.6–118.1 | 40.5–90.0 | |
| Height, cm | ||||
| Mean±SD | 170.3±8.3 | 174.8±5.9 | 162.3±5.1 | <0.001b |
| Median | 170.9 | 174.7 | 162.1 | |
| Range | 148.1–193.4 | 161.0–193.4 | 148.1–175.2 | |
| BMI, kg/m2 | ||||
| Mean±SD | 23.4±3.1 | 23.8±2.8 | 22.5±3.4 | <0.001a |
| Median | 23.3 | 23.7 | 22.0 | |
| Range | 16.1–38.3 | 16.1–38.3 | 16.4–35.2 | |
- 1. Cruz-Jentoft AJ, Baeyens JP, Bauer JM, Boirie Y, Cederholm T, Landi F, et al. Sarcopenia: European consensus on definition and diagnosis: report of the European Working Group on Sarcopenia in Older People. Age Ageing 2010;39:412–23.ArticlePubMedPMC
- 2. Chen LK, Liu LK, Woo J, Assantachai P, Auyeung TW, Bahyah KS, et al. Sarcopenia in Asia: consensus report of the Asian Working Group for Sarcopenia. J Am Med Dir Assoc 2014;15:95–101.ArticlePubMed
- 3. Cruz-Jentoft AJ, Bahat G, Bauer J, Boirie Y, Bruyere O, Cederholm T, et al. Sarcopenia: revised European consensus on definition and diagnosis. Age Ageing 2019;48:16–31.ArticlePubMed
- 4. Walowski CO, Braun W, Maisch MJ, Jensen B, Peine S, Norman K, et al. Reference values for skeletal muscle mass: current concepts and methodological considerations. Nutrients 2020;12:755.ArticlePubMedPMC
- 5. Mourtzakis M, Prado CM, Lieffers JR, Reiman T, McCargar LJ, Baracos VE. A practical and precise approach to quantification of body composition in cancer patients using computed tomography images acquired during routine care. Appl Physiol Nutr Metab 2008;33:997–1006.ArticlePubMed
- 6. Schweitzer L, Geisler C, Pourhassan M, Braun W, Gluer CC, Bosy-Westphal A, et al. What is the best reference site for a single MRI slice to assess whole-body skeletal muscle and adipose tissue volumes in healthy adults? Am J Clin Nutr 2015;102:58–65.ArticlePubMed
- 7. van der Werf A, Langius JAE, de van der Schueren MAE, Nurmohamed SA, van der Pant KAMI, Blauwhoff-Buskermolen S, et al. Percentiles for skeletal muscle index, area and radiation attenuation based on computed tomography imaging in a healthy Caucasian population. Eur J Clin Nutr 2018;72:288–96.ArticlePubMed
- 8. Derstine BA, Holcombe SA, Ross BE, Wang NC, Su GL, Wang SC. Skeletal muscle cutoff values for sarcopenia diagnosis using T10 to L5 measurements in a healthy US population. Sci Rep 2018;8:11369.ArticlePubMedPMC
- 9. Hamaguchi Y, Kaido T, Okumura S, Kobayashi A, Hammad A, Tamai Y, et al. Proposal for new diagnostic criteria for low skeletal muscle mass based on computed tomography imaging in Asian adults. Nutrition 2016;32:1200–5.ArticlePubMed
- 10. Kim JS, Kim WY, Park HK, Kim MC, Jung W, Ko BS. Simple age specific cutoff value for sarcopenia evaluated by computed tomography. Ann Nutr Metab 2017;71:157–63.ArticlePubMed
- 11. Park HJ, Shin Y, Park J, Kim H, Lee IS, Seo DW, et al. Development and validation of a deep learning system for segmentation of abdominal muscle and fat on computed tomography. Korean J Radiol 2020;21:88–100.ArticlePubMed
- 12. Benjamin J, Shasthry V, Kaal CR, Anand L, Bhardwaj A, Pandit V, et al. Characterization of body composition and definition of sarcopenia in patients with alcoholic cirrhosis: A computed tomography based study. Liver Int 2017;37:1668–74.ArticlePubMed
- 13. Ufuk F, Herek D. Reference skeletal muscle mass values at L3 vertebrae level based on computed tomography in healthy Turkish adults. Int J Gerontol 2019;13:221–5.
- 14. Mijnarends DM, Koster A, Schols JM, Meijers JM, Halfens RJ, Gudnason V, et al. Physical activity and incidence of sarcopenia: the population-based AGES-Reykjavik Study. Age Ageing 2016;45:614–20.ArticlePubMedPMC
- 15. Bloom I, Shand C, Cooper C, Robinson S, Baird J. Diet quality and sarcopenia in older adults: a systematic review. Nutrients 2018;10:308.ArticlePubMedPMC
References
Figure & Data
References
Citations
- Myosteatosis is associated with poor survival after kidney transplantation: a large retrospective cohort validation
Jie Chen, Yue Li, Chengjie Li, Turun Song
Abdominal Radiology.2024; 49(4): 1210. CrossRef - The effect of biological agent on body composition in patients with Crohn’s disease
Eun Jeong Choi, Dong Hoon Baek, Hong Sub Lee, Geun Am Song, Tae Oh Kim, Yong Eun Park, Chang Min Lee, Jong Hoon Lee
BMC Gastroenterology.2023;[Epub] CrossRef - The Association between the L3 Skeletal Muscle Index Derived from Computed Tomography and Clinical Outcomes in Patients with Urinary Tract Infection in the Emergency Department
Jinjoo An, Seung Pill Choi, Jae Hun Oh, Jong Ho Zhu, Sung Wook Kim, Soo Hyun Kim
Journal of Clinical Medicine.2023; 12(15): 5024. CrossRef - Validity of computed tomography defined body composition as a prognostic factor for functional outcome after kidney transplantation
Tim D. A. Swaab, Evelien E. Quint, Lisa B. Westenberg, Marcel Zorgdrager, Dorry L. Segev, Mara A. McAdams‐DeMarco, Stephan J. L. Bakker, Alain R. Viddeleer, Robert A. Pol
Journal of Cachexia, Sarcopenia and Muscle.2023; 14(6): 2532. CrossRef - Assessment of the Diaphragm Thickness Decrease in Critically Ill COVID-19 Patients: Could Computed Tomography Be of Aid Regarding Diaphragm Muscle Mass?
Oana-Elena Branea, Sanda Maria Copotoiu, Diana Andreea Becica, AnaMaria Romina Budeanu, Razvan Gabriel Budeanu, Mihai Emanuel Becica, Dragos Constantin Cucoranu, Septimiu Voidazan, Monica Chis, Alexandra Elena Lazar
Cureus.2023;[Epub] CrossRef - Clinical implication of thoracic skeletal muscle volume as a predictor of ventilation-weaning failure in brain-injured patients: A retrospective observational study
Jimi Oh, Hyun Lim, Chang Won Jeong, Min Su Kim, Jinseok Lee, Wu Seong Kang, Ui Ri An, Joo Un Park, Youngick Ahn, Youe Ree Kim, Chul Park
Medicine.2023; 102(43): e35847. CrossRef - Estimation of Muscle Mass Using Creatinine/Cystatin C Ratio in Japanese Community-Dwelling Older People
Hiroshi Kusunoki, Yasuharu Tabara, Shotaro Tsuji, Yosuke Wada, Kayoko Tamaki, Koutatsu Nagai, Masako Itoh, Kyoko Sano, Manabu Amano, Hatsuo Maeda, Hideyuki Sugita, Yoko Hasegawa, Hiromitsu Kishimoto, Soji Shimomura, Michiya Igase, Ken Shinmura
Journal of the American Medical Directors Association.2022; 23(5): 902.e21. CrossRef - Defining reference values for low skeletal muscle index at the L3 vertebra level based on computed tomography in healthy adults: A multicentre study
Ming Kong, Nan Geng, Ying Zhou, Ning Lin, Wenyan Song, Manman Xu, Shanshan Li, Yuetong Piao, Zuoqing Han, Rong Guo, Chao Yang, Nan Luo, Zhong Wang, Mengyuan Jiang, Lili Wang, Wanchun Qiu, Junfeng Li, Daimeng Shi, Rongkuan Li, Eddie C. Cheung, Yu Chen, Zho
Clinical Nutrition.2022; 41(2): 396. CrossRef - The Value of Artificial Intelligence-Assisted Imaging in Identifying Diagnostic Markers of Sarcopenia in Patients with Cancer
Ying-Tzu Huang, Yi-Shan Tsai, Peng-Chan Lin, Yu-Min Yeh, Ya-Ting Hsu, Pei-Ying Wu, Meng-Ru Shen, Zhongjie Shi
Disease Markers.2022; 2022: 1. CrossRef - Assessment of Muscle Quantity, Quality and Function
Bo Kyung Koo
Journal of Obesity & Metabolic Syndrome.2022; 31(1): 9. CrossRef - Computed Tomography-Derived Skeletal Muscle Radiodensity Is an Early, Sensitive Marker of Age-Related Musculoskeletal Changes in Healthy Adults
Yeon Woo Jung, Namki Hong, Joon Chae Na, Woong Kyu Han, Yumie Rhee
Endocrinology and Metabolism.2021; 36(6): 1201. CrossRef
 PubReader
 ePub Link
 Cite
Cite

