Articles
- Page Path
- HOME > Endocrinol Metab > Volume 30(1); 2015 > Article
-
Original ArticleMitochondrial Complexes I and II Are More Susceptible to Autophagy Deficiency in Mouse β-Cells
-
Min Joo Kim1,2, Ok Kyong Choi3, Kyung Sil Chae3, Min Kyeong Kim1, Jung Hee Kim1, Masaaki Komatsu4, Keiji Tanaka4, Hakmo Lee3, Sung Soo Chung3, Soo Heon Kwak1
 , Young Min Cho1, Kyong Soo Park1, Hye Seung Jung1
 -
Endocrinology and Metabolism 2015;30(1):65-70.
DOI: https://doi.org/10.3803/EnM.2015.30.1.65
Published online: March 27, 2015
1Department of Internal Medicine, Seoul National University College of Medicine, Korea.
2Department of Internal Medicine, Korea Cancer Center Hospital, Korea.
3Innovative Research Institute for Cell Therapy, Seoul, Korea.
4Tokyo Metropolitan Institute of Medical Science, Tokyo, Japan.
- Corresponding author: Hye Seung Jung. Department of Internal Medicine, Seoul National University College of Medicine, 101 Daehak-ro, Jongno-gu, Seoul 110-744, Korea. Tel: +82-2-2072-0240, Fax: +82-2-762-9662, junghs@snu.ac.kr
• Received: May 9, 2015 • Revised: June 17, 2015 • Accepted: June 18, 2015
Copyright © 2015 Korean Endocrine Society
This is an Open Access article distributed under the terms of the Creative Commons Attribution Non-Commercial License (http://creativecommons.org/licenses/by-nc/3.0/) which permits unrestricted non-commercial use, distribution, and reproduction in any medium, provided the original work is properly cited.
ABSTRACT
-
Background
- Damaged mitochondria are removed by autophagy. Therefore, impairment of autophagy induces the accumulation of damaged mitochondria and mitochondrial dysfunction in most mammalian cells. Here, we investigated mitochondrial function and the expression of mitochondrial complexes in autophagy-related 7 (Atg7)-deficient β-cells.
-
Methods
- To evaluate the effect of autophagy deficiency on mitochondrial function in pancreatic β-cells, we isolated islets from Atg7F/F:RIP-Cre+ mice and wild-type littermates. Oxygen consumption rate and intracellular adenosine 5'-triphosphate (ATP) content were measured. The expression of mitochondrial complex genes in Atg7-deficient islets and in β-TC6 cells transfected with siAtg7 was measured by quantitative real-time polymerase chain reaction.
-
Results
- Baseline oxygen consumption rate of Atg7-deficient islets was significantly lower than that of control islets (P<0.05). Intracellular ATP content of Atg7-deficient islets during glucose stimulation was also significantly lower than that of control islets (P<0.05). By Oxygraph-2k analysis, mitochondrial respiration in Atg7-deficient islets was significantly decreased overall, although state 3 respiration and responses to antimycin A were unaffected. The mRNA levels of mitochondrial complexes I, II, III, and V in Atg7-deficient islets were significantly lower than in control islets (P<0.05). Down-regulation of Atg7 in β-TC6 cells also reduced the expression of complexes I and II, with marginal significance (P<0.1).
-
Conclusion
- Impairment of autophagy in pancreatic β-cells suppressed the expression of some mitochondrial respiratory complexes, and may contribute to mitochondrial dysfunction. Among the complexes, I and II seem to be most vulnerable to autophagy deficiency.
- Autophagy is a cellular degradation-recycling system for aggregated proteins and damaged organelles. Autophagy to remove damaged mitochondria is termed mitophagy. Impairment of autophagy is known to induce the accumulation of damaged mitochondria and to cause mitochondrial dysfunction in most mammalian cells. The accumulation of deformed mitochondria has been noted in hepatocytes and cardiomyocytes of autophagy- deficient mice [1,2]. Autophagy-related 7 (Atg7), an E1-like gene, is essential for the formation of autophagosomes [3], and Atg7-deficient erythrocytes show altered mitochondrial membrane potential [4]. This suggests that mitophagy plays a pivotal role in the control of mitochondrial quality and quantity [5].
- Recently, autophagy has also been implicated in the regulation of pancreatic β-cell function and mass [6]. Mice with β-cell-specific deletion of Atg7 showed impaired glucose tolerance and decreased serum insulin levels [7,8]. In those studies, electron microscopy of the autophagy-deficient β-cells revealed mitochondrial swelling. Other groups have reported decreased oxygen consumption rate and adenosine 5'-triphosphate (ATP) production in Atg7-deficient islets ex vivo, suggesting mitochondrial dysfunction [8,9]. In addition, reduced Ca2+ transients in response to glucose in autophagy-deficient β-cells have been noted [7], which may indicate abnormal mitochondrial function. Mitochondria are crucial in the generation of ATP, affecting both the closure of ATP-sensitive K+ channels and Ca2+ influx. Here, we further investigated changes in Atg7-deficient β-cells, focusing on the level of the mitochondrial respiratory chain complexes.
INTRODUCTION
- Mice and islet isolation
- To generate mice with β-cell-specific deletion of Atg7 (Atg7Δβ-cell), Atg7-floxed (Atg7F/F) mice were crossed with RIP-Cre mice. RIP-Cre mice or Atg7F/F mice were used as controls. After overnight fasting, pancreatic islets were isolated from 20-week-old mice using a collagenase digestion technique [7]. All animal experiments were conducted in accordance with the Institutional Guide for the Care and Use of Laboratory Animals of Seoul National University Hospital.
- Cells and Atg7 RNA interference
- β-TC6 cells were obtained from ATCC (Manassas, VA, USA). The cells were cultured in Dulbecco's Modified Eagle's Medium (GIBCO, Carlsbad, CA, USA) supplemented with 10% fetal bovine serum, 100 units/mL penicillin, and 100 µg/mL streptomycin (GIBCO), in a humidified atmosphere of 95% air and 5% CO2. To generate Atg7-deficient cells, β-TC6 cells were transfected with siAtg7 by electroporation using an Amaxa Cell Line Nucleofector Kit V system (Lonza, Basel, Switzerland). The glucose concentration of the culture medium was changed to 15 mM during the 48 hours of transfection. Down-regulation of Atg7 was verified by quantitative real-time polymerase chain reaction (RT-PCR).
- Oxygen consumption rate
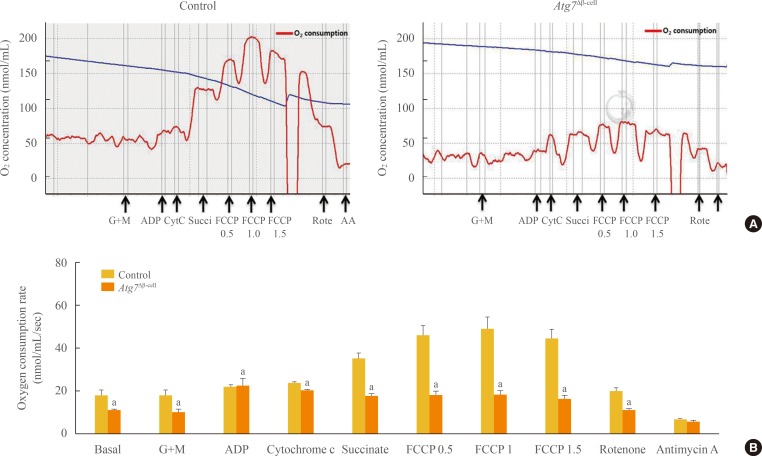
- Baseline oxygen consumption rate was measured from 200 islets over 2 hours, using a BD Oxygen Biosensor System, according to the manufacturer's protocol (Becton Dickinson, San Jose, CA, USA). An Oxygraph-2k (OROBOROS Instruments, Innsbruck, Austria) was used to examine the responses to mitochondrial effectors of 1,000 islets suspended in Krebs-Ringer bicarbonate HEPES (KRBH) buffer with 10 mM glucose, at 37℃. During the experiments, substances were added serially as described [10,11]: glutamate (10 mM) and malate (2 mM) (G+M) were first added as substrates for mitochondrial respiration; adenosine diphosphate (ADP, 2.5 mM) was then added to induce state 3 respiration; cytochrome c (10 µM) was added to test the integrity of the outer mitochondrial membrane; succinate (10 mM) was added for electron transfer to complex II; next, 0.5 to 1.5 µM carbonyl-cyanide-4-(trifluoromethoxy)-phenylhydrazone (FCCP), a mitochondrial respiration uncoupler, was added to obtain maximal oxygen consumption rate; rotenone (0.5 µM) was added to inhibit complex I, and then antimycin A (1.5 µM) to inhibit complex III.
- Intracellular ATP content
- Ten isolated islets in each of five culture wells were treated with low glucose-KRBH buffer (1.6 mM) or high glucose-KRBH buffer (16 mM) for 1 hour, after 1 hour of fasting. ATP content of the islets was then measured, using a bioluminescence assay kit (Sigma-Aldrich, St. Louis, MO, USA), and the values were normalized to total cellular protein in each sample. Protein concentration was determined using a NanoDrop 1000 spectrophotometer (Thermo Fisher Scientific Inc., Wilmington, DE, USA).
- Real-time quantitative reverse transcription polymerase chain reaction of mitochondrial complex mRNAs
- We isolated total RNA from mouse islets or β-TC6 cells using TRizol reagent (Ambion, Foster City, CA, USA), synthesized cDNA using M-MLV reverse transcriptase (Promega, Madison, WI, USA), and amplified it using the SYBR Premix Ex Taq polymerase (TaKaRa, Otsu, Japan). Quantitative RT-PCR was performed and analyzed using a LightCycler 96 Real-Time PCR System (Roche, Mannheim, Germany). Primer sequences are presented in Table 1.
- Statistical analysis
- Results are presented as means±standard error. Statistical analyses of differences between groups were performed using Student t test or the Mann-Whitney U test, depending on sample variances. P values <0.05 were considered to indicate statistical significance.
METHODS
- Basal oxygen consumption rate
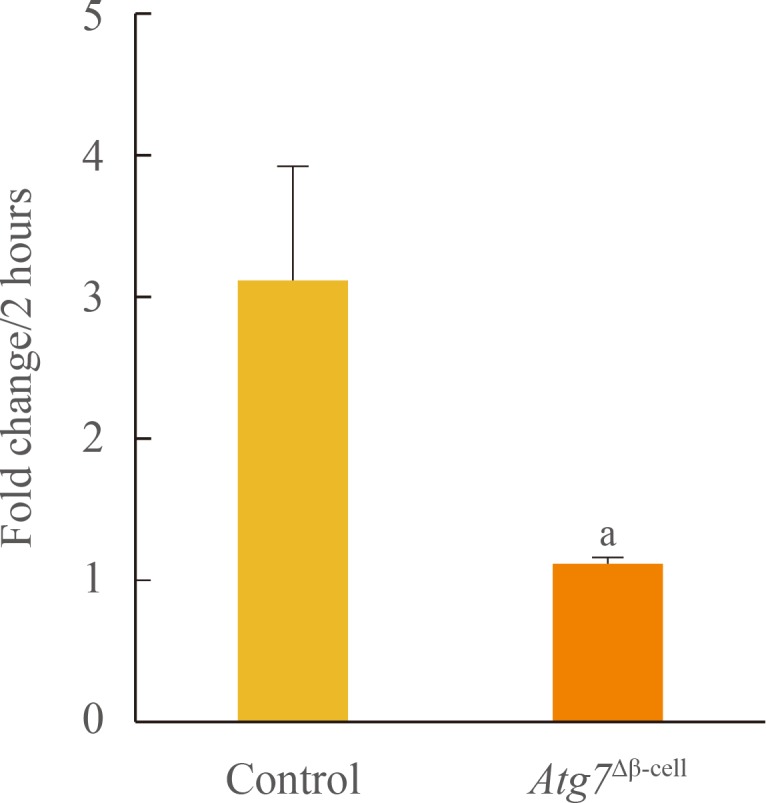
- To investigate the effects of autophagy on mitochondrial function, islets were isolated from Atg7Δβ-cell and control mice, and oxygen consumption rate was measured ex vivo for 2 hours (Fig. 1). Oxygen consumption rate during that time increased 3-fold over initial values in control islets, while that of the Atg7Δβ-cell islets changed nonsignificantly. This difference between the groups in fold change after 2 hours was significant (P<0.05).
- Intracellular ATP content
- We measured intracellular ATP content ex vivo in response to glucose stimulation. The intracellular ATP content of islets from Atg7Δβ-cell mice was significantly lower than that from control mice, under both low- and high-glucose conditions (P<0.05) (Fig. 2A). However, the fold change in ATP production with high glucose was comparable between the two groups (Fig. 2B). This may be due to suppressed ATP production under both low- and high-glucose concentrations.
- Mitochondrial respiration
- It is unclear whether mitochondrial dysfunction reflects only the accumulation of damaged mitochondria or if there are other, direct effects on mitochondrial function. To determine whether specific respiratory states are influenced, we performed Oxygraph-2k analyses with isolated islets. Representative graphs are presented in Fig. 3A. Throughout the experiment, a marked reduction in oxygen consumption rate was observed in Atg7Δβ-cell islets compared to controls (P<0.01 by repeated measures analysis of variance) (Fig. 3B). Inhibitory effects of succinate (an inhibitor of complex II) and rotenone (an inhibitor of complex I) were relatively prominent, while there was no difference in responses to ADP (stage 3 respiration) or to antimycin A (an inhibitor of complex III). These findings suggest that complexes I and II are most vulnerable to autophagy deficiency.
- Expression of mitochondrial complex genes
- We examined the expression of mitochondrial respiratory complex genes in isolated islets and in β-TC6 cells. In Atg7Δβ-cell islets, expression of Atg7 mRNA was reduced by half (Fig. 4A). Among mitochondrial complexes, mitochondrial complex IV gene expression predominated. The expressions of mitochondrial complexes except complex IV were significantly lower in Atg7Δβ-cell islets than in controls (P<0.05) (Fig. 4A). In β-TC6 cells transfected with siAtg7 for 48 hours, Atg7 expression was also reduced by half (P<0.05); the expression of mitochondrial complexes I and II was reduced, but the statistical significance of this effect was marginal (Fig. 4B).
RESULTS
- In pancreatic β-cells, as in other mammalian cells, damaged mitochondria are removed by autophagy [12]. Impairment of autophagy is thus expected to result in the accumulation of damaged mitochondria, and we have previously reported abnormal swollen mitochondria in Atg7Δβ-cell mice [7]. In this study, we observed the decreased oxygen consumption rate and ATP content, noted previously in autophagy-deficient pancreatic β-cells [8,9]. We also report that impaired autophagy affects specific steps in the mitochondrial electron transfer system. Although Atg7Δβ-cell islets showed a significant overall decrease in mitochondrial respiration compared to control islets (Fig. 3A), state 3 respiration estimated by treatment with ADP was unaffected by autophagy deficiency, and treatment with antimycin A, an inhibitor of complex III, abolished the difference in oxygen consumption rate between Atg7Δβ-cell islets and controls (Fig. 3B). Given the results of the significant differences by succinate and rotenone treatments, mitochondrial complexes I and II seemed to be most vulnerable to autophagy deficiency. Wu et al. [9] reported that Atg7-deficient mouse islets showed decreased mitochondrial respiration when treated with oligomycin, an inhibitor of complex V (ATP synthase), or with FCCP.
- We evaluated mRNA expression of genes for components of each mitochondrial complex, both in mouse islets and in β-TC6 cells. Although Wu et al. [9] reported no difference in expression of these genes in Atg7-deficient skeletal muscle, we found the expression of all but one complex IV component gene to be decreased significantly in Atg7Δβ-cell islets (Fig. 4A). Inhibition of Atg7 in β-TC6 cells in vitro also reduced mitochondrial complex expression, although this effect was generally not statistically significant (Fig. 4B). The reduction in mitochondrial complexes I and II was marginally significant (P=0.057 and P=0.097, respectively). We presume that autophagy inhibition initially affects the expression of complexes I and II, and that prolonged suppression of autophagy influences expression of complexes III and V, but not IV. Such differences in gene expression would contribute to differences in the functions of the complexes.
- Although we did not investigate reactive oxygen species (ROS), it may also contribute to mitochondrial dysfunction in autophagy-deficient β-cells. Mitochondria are the primary organelle producing ROS, and are also significantly influenced by ROS. As inhibition of Atg7 has been reported to increase the generation of ROS in pancreatic β-cells, and the attenuation of ROS recovered cellular function [9], mitochondrial dysfunction in autophagy-deficient β-cells may be closely related to ROS generation. In this study, we determined that autophagy impaired mitochondrial function. On the other hand, mitochondrial damage can generate ROS, leading to autophagy induction [13]. Rotenone, an inhibitor of complex I, and theonoyltrifluoroacetone (TTFA), an inhibitor of complex II, induced autophagic cell death, and inhibition of Atg5 ameliorated rotenone- or TTFA-induced cell death in transformed and cancer cell lines [14].
- In conclusion, impairment of autophagy in β-cells in vivo induced mitochondrial dysfunction, particularly of mitochondrial respiratory complexes I and II. This suggests that not only the simple accumulation of damaged mitochondria but also direct effects on mitochondria, including altered expression of respiratory complex genes, may cause disturbed energy homeostasis by autophagy deficiency.
DISCUSSION
-
Acknowledgements
- This study was supported by a grant from the Innovative Research Institute for Cell Therapy (A062260) of the Ministry of Health and Welfare, Republic of Korea, and by a grant from Seoul National University Hospital (03-2010-0300).
ACKNOWLEDGMENTS
-
CONFLICTS OF INTEREST: No potential conflict of interest relevant to this article was reported.
Article information
- 1. Komatsu M, Waguri S, Ueno T, Iwata J, Murata S, Tanida I, Ezaki J, Mizushima N, Ohsumi Y, Uchiyama Y, Kominami E, Tanaka K, Chiba T. Impairment of starvation-induced and constitutive autophagy in Atg7-deficient mice. J Cell Biol 2005;169:425–434. ArticlePubMedPMCPDF
- 2. Nakai A, Yamaguchi O, Takeda T, Higuchi Y, Hikoso S, Taniike M, Omiya S, Mizote I, Matsumura Y, Asahi M, Nishida K, Hori M, Mizushima N, Otsu K. The role of autophagy in cardiomyocytes in the basal state and in response to hemodynamic stress. Nat Med 2007;13:619–624. ArticlePubMedPDF
- 3. Levine B, Deretic V. Unveiling the roles of autophagy in innate and adaptive immunity. Nat Rev Immunol 2007;7:767–777. ArticlePubMedPMCPDF
- 4. Mortensen M, Ferguson DJ, Edelmann M, Kessler B, Morten KJ, Komatsu M, Simon AK. Loss of autophagy in erythroid cells leads to defective removal of mitochondria and severe anemia in vivo. Proc Natl Acad Sci U S A 2010;107:832–837. ArticlePubMed
- 5. Youle RJ, Narendra DP. Mechanisms of mitophagy. Nat Rev Mol Cell Biol 2011;12:9–14. ArticlePubMedPMCPDF
- 6. Quan W, Lee MS. Role of autophagy in the control of body metabolism. Endocrinol Metab (Seoul) 2013;28:6–11. ArticlePubMedPMC
- 7. Jung HS, Chung KW, Won Kim J, Kim J, Komatsu M, Tanaka K, Nguyen YH, Kang TM, Yoon KH, Kim JW, Jeong YT, Han MS, Lee MK, Kim KW, Shin J, Lee MS. Loss of autophagy diminishes pancreatic beta cell mass and function with resultant hyperglycemia. Cell Metab 2008;8:318–324. ArticlePubMed
- 8. Ebato C, Uchida T, Arakawa M, Komatsu M, Ueno T, Komiya K, Azuma K, Hirose T, Tanaka K, Kominami E, Kawamori R, Fujitani Y, Watada H. Autophagy is important in islet homeostasis and compensatory increase of beta cell mass in response to high-fat diet. Cell Metab 2008;8:325–332. ArticlePubMed
- 9. Wu JJ, Quijano C, Chen E, Liu H, Cao L, Fergusson MM, Rovira II, Gutkind S, Daniels MP, Komatsu M, Finkel T. Mitochondrial dysfunction and oxidative stress mediate the physiological impairment induced by the disruption of autophagy. Aging (Albany NY) 2009;1:425–437. ArticlePubMedPMC
- 10. Gnaiger E. Mitochondrial pathways and respiratory control: an introduction to OXPHOS analysis; 3rd ed. Innsbruck: OROBOROS MiPNet Publications; 2012. p. 64.
- 11. Moon MK, Kim MJ, Jung IK, Koo YD, Ann HY, Lee KJ, Kim SH, Yoon YC, Cho BJ, Park KS, Jang HC, Park YJ. Bisphenol A impairs mitochondrial function in the liver at doses below the no observed adverse effect level. J Korean Med Sci 2012;27:644–652. ArticlePubMedPMC
- 12. Twig G, Elorza A, Molina AJ, Mohamed H, Wikstrom JD, Walzer G, Stiles L, Haigh SE, Katz S, Las G, Alroy J, Wu M, Py BF, Yuan J, Deeney JT, Corkey BE, Shirihai OS. Fission and selective fusion govern mitochondrial segregation and elimination by autophagy. EMBO J 2008;27:433–446. ArticlePubMedPMC
- 13. Scherz-Shouval R, Shvets E, Fass E, Shorer H, Gil L, Elazar Z. Reactive oxygen species are essential for autophagy and specifically regulate the activity of Atg4. EMBO J 2007;26:1749–1760. ArticlePubMedPMC
- 14. Chen Y, McMillan-Ward E, Kong J, Israels SJ, Gibson SB. Mitochondrial electron-transport-chain inhibitors of complexes I and II induce autophagic cell death mediated by reactive oxygen species. J Cell Sci 2007;120(Pt 23):4155–4166. ArticlePubMed
References
Fig. 1

Basal oxygen consumption rates in islets isolated from Atg7Δβ-cell and control mice (n=5 to 8 per group). Data are presented as fold changes±SE, and comparisons were performed using a Mann-Whitney U test. Atg7, autophagy-related 7. aP<0.05 compared to the control.
Fig. 2
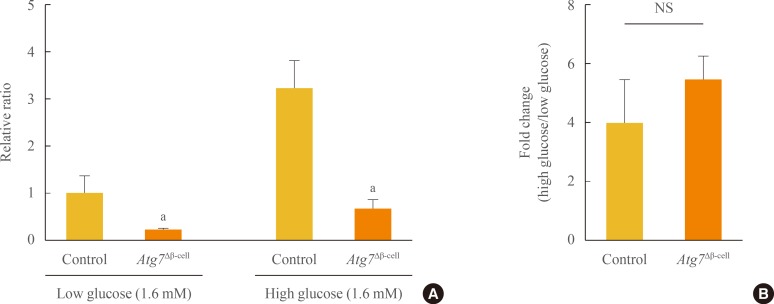
Intracellular adenosine 5'-triphosphate (ATP) content induced by glucose stimulation of islets isolated from Atg7Δβ-cell and control mice (n=3 to 10 per group). (A) ATP content under low-glucose (1.6 mM) and high-glucose (16 mM) conditions. All values were normalized relative to those of control islets under low glucose conditions. (B) Fold change in ATP content induced by high-glucose stimulation. Data are presented as fold changes±SE, and comparisons were performed using a Mann-Whitney U test. Atg7, autophagy-related 7; NS, not significant. aP<0.05 compared to control.
Fig. 3

Mitochondrial respiration in islets isolated from Atg7Δβ-cell and control mice (n=9 to 10 per group). (A) Representative graphs of mitochondrial respiration using Oxygraph-2k. Red lines indicate oxygen consumption rate in response to sequential loading of mitochondrial effectors (indicated by arrows below the graphs). (B) Quantitative comparisons of oxygen consumption rate in response to effectors. Data are presented as means±SE, and comparisons were performed using repeated measures analysis of variance and Mann-Whitney U tests. G+M, glutamate and malate; ADP, adenosine diphosphate; FCCP, carbonyl-cyanide-4-(trifluoromethoxy)-phenylhydrazone; AA, antimycin A; Atg7, autophagy-related 7. aP<0.05 compared to control islets.
Fig. 4
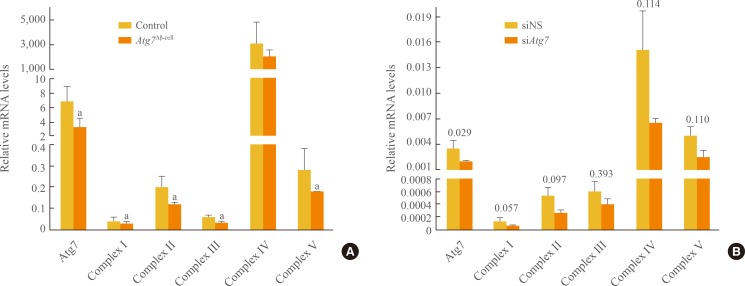
Expression of mitochondrial complex genes by quantitative real-time polymerase chain reaction (A) in Atg7Δβ-cell and control islets (n=7 to 8 per group), and (B) in β-TC6 cells transfected with siAtg7 or with siNS as a control (n=4). The expression levels were normalized to that of glyceraldehyde 3-phosphate dehydrogenase. Data are presented as means±SE, and comparisons were performed using Student t tests or Mann-Whitney U tests, depending on sample variances. P value is presented above the bar graph. Atg7, autophagy-related 7. aP<0.05 compared to control islets.
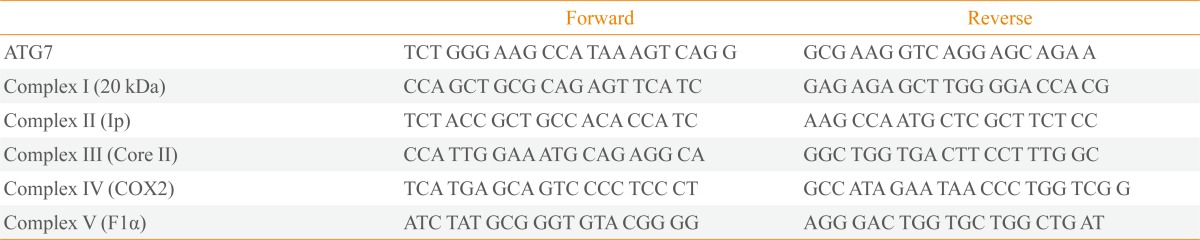
Figure & Data
References
Citations
Citations to this article as recorded by 
- Proteomic pathways to metabolic disease and type 2 diabetes in the pancreatic islet
Belinda Yau, Sheyda Naghiloo, Alexis Diaz-Vegas, Austin V. Carr, Julian Van Gerwen, Elise J. Needham, Dillon Jevon, Sing-Young Chen, Kyle L. Hoehn, Amanda E. Brandon, Laurence Macia, Gregory J. Cooney, Michael R. Shortreed, Lloyd M. Smith, Mark P. Keller,
iScience.2021; 24(10): 103099. CrossRef - Natural compound oblongifolin C inhibits autophagic flux, and induces apoptosis and mitochondrial dysfunction in human cholangiocarcinoma QBC939 cells
Aiqing Zhang, Wei He, Huimin Shi, Xiaodan Huang, Guozhong Ji
Molecular Medicine Reports.2016; 14(4): 3179. CrossRef - Autophagy deficiency in β cells blunts incretin-induced suppression of glucagon release from α cells
Min Joo Kim, Ok Kyong Choi, Kyung Sil Chae, Hakmo Lee, Sung Soo Chung, Dong-Sik Ham, Ji-Won Kim, Kun-Ho Yoon, Kyong Soo Park, Hye Seung Jung
Islets.2015; 7(5): e1129096. CrossRef
 PubReader
 Cite
Cite