Articles
- Page Path
- HOME > Endocrinol Metab > Volume 36(6); 2021 > Article
-
Original ArticleDiabetes, Obesity and Metabolism Association between Lung Function and New-Onset Diabetes Mellitus in Healthy Individuals after a 6-Year Follow-up
-
Hwa Young Lee1
 , Juyoung Shin2,3, Hyunah Kim4, Seung-Hwan Lee3,5, Jae-Hyoung Cho3,5, Sook Young Lee1, Hun-Sung Kim3,5
 -
Endocrinology and Metabolism 2021;36(6):1254-1267.
DOI: https://doi.org/10.3803/EnM.2021.1249
Published online: December 13, 2021
1Division of Allergy, Department of Internal Medicine, Seoul St. Mary’s Hospital, College of Medicine, The Catholic University of Korea, Seoul, Korea
2Health Promotion Center, Seoul St. Mary’s Hospital, College of Medicine, The Catholic University of Korea, Seoul, Korea
3Division of Endocrinology and Metabolism, Department of Internal Medicine, Seoul St. Mary’s Hospital, College of Medicine, The Catholic University of Korea, Seoul, Korea
4College of Pharmacy, Sookmyung Women’s University, Seoul, Korea
5Department of Medical Informatics, College of Medicine, The Catholic University of Korea, Seoul, Korea
- Corresponding author: Hun-Sung Kim. Department of Medical Informatics, College of Medicine, The Catholic University of Korea, 222 Banpo-daero, Seocho-gu, Seoul 06591, Korea Tel: +82-2-2258-8262, Fax: +82-0504-292-9080, E-mail: 01cadiz@hanmail.net
Copyright © 2021 Korean Endocrine Society
This is an Open Access article distributed under the terms of the Creative Commons Attribution Non-Commercial License (http://creativecommons.org/licenses/by-nc/4.0/) which permits unrestricted non-commercial use, distribution, and reproduction in any medium, provided the original work is properly cited.
ABSTRACT
-
Background
- We analyzed hemoglobin A1c (HbA1c) levels and various lung function test results in healthy individuals after a 6-year follow-up period to explore the influence of lung function changes on glycemic control.
-
Methods
- Subjects whose HbA1c levels did not qualify as diabetes mellitus (DM) and who had at least two consecutive lung function tests were selected among the people who visited a health promotion center. Lung function parameters, including forced expiratory volume in 1 second (FEV1), forced vital capacity (FVC), FEV/FVC ratio, and forced expiratory flow 25% to 75% (FEF25%−75%), were divided into four groups based on their baseline quantiles. To evaluate future DM onset risk in relation to lung function changes, the correlation between baseline HbA1c levels and changes in lung function parameters after a 6-year follow-up period was analyzed.
-
Results
- Overall, 17,568 individuals were included; 0.9% of the subjects were diagnosed with DM. The individuals included in the quartile with FEV1/FVC ratio values of 78% to 82% had lower risk of DM than those in the quartile with FEV1/FVC ratio values of ≥86% after adjusting for age, sex, and body mass index (P=0.04). Baseline percent predicted FEV1, FVC, FEV1/FVC ratio, and FEF25%−75%, and differences in the FEV1/FVC ratio or FEF25%−75%, showed negative linear correlations with baseline HbA1c levels.
-
Conclusion
- Healthy subjects with FEV1/FVC ratio values between 78% and 82% had 40% lower risk for future DM. Smaller differences and lower baseline FEV1/FVC ratio or FEF25%−75% values were associated with higher baseline HbA1c levels. These findings suggest that airflow limitation affects systemic glucose control and that the FEV1/FVC ratio could be one of the factors predicting future DM risk in healthy individuals.
- Diabetes mellitus (DM) is a metabolic disease characterized by hyperglycemia resulting from insulin defects or resistance, which is associated with long-term organ dysfunction [1]. Recent studies [2-4] have demonstrated a positive correlation between glycemic control and lung function impairment in patients with DM. A meta-analysis including 3,182 diabetes patients and 27,080 control subjects found that patients with diabetes had decreased forced expiratory volume in 1 second (FEV1) and forced vital capacity (FVC) compared with a healthy control group [2]. One large-scale 5-year prospective study reported that individuals with diabetes had a 1.6-fold higher risk of restrictive lung function impairment than those without diabetes after adjusting for baseline lung function [4].
- The relationship between glycemic control and lung function changes has been described in patients with DM in previous literature. Davis et al. [5] showed that declining lung function measures (FEV1, FVC) were consistently predicted by higher hemoglobin A1c (HbA1c) levels on follow-up in the Fremantile Diabetes study. The decline in lung function under poor glycemic control had been explained not only in DM but also in the prediabetes stages. Prediabetes, defined by HbA1c levels between 5.7% and 6.4% [1], had a negative correlation with both FVC (γ=–0.113, P<0.001) and FEV1 (γ=–0.079, P=0.003). A multivariable logistic regression model showed that restrictive patterns and FEV1 of <80% showed a positive correlation with HbA1c levels [6]. Moreover, epidemiological studies suggest that diabetes and hyperglycemia are associated with the development of several pulmonary diseases, including airway diseases and interstitial lung disease [7,8]. These studies suggest that the metabolic changes induced by hyperglycemia affect the lung, consistent with the pathologic autopsy findings showing involvement of the alveolar capillaries and arterioles, with hyalinosis, plasmorrhagia, and insudation, in diabetic microangiopathy [9]. The common links between diabetes and pulmonary diseases are systemic inflammatory pathways, including those involving proinflammatory cytokines such as tumor necrosis factor-α and interleukin-6, which induce insulin resistance [10,11]. Moreover, obesity, an important risk factor for DM, is considered to activate an inflammatory cascade that could affect lung function [7,12].
- However, evidence regarding the association between lung function and glycemic control status in healthy individuals without prediabetes or DM is lacking. The prevalence of DM increases with age and is 34% in women and 14% in men among patients aged 20 to 39 years, whereas it is approximately 50% in those aged >80 years [13]. However, long-term follow-up studies are limited for the development of new-onset diabetes mellitus (NODM) in middle-aged adults. As the development of NODM is increasing in these patients, it is becoming increasingly important to determine the future risks of developing DM. Therefore, this study was designed to analyze HbA1c after a 6-year follow-up according to various lung function test results in healthy individuals, exploring the influence of lung function changes on glycemic control.
INTRODUCTION
- Data collection and study design
- Subjects with an HbA1c of <6.5% at their initial visit and more than two consecutive lung function measurements were selected among those who visited a health promotion center for examination in Seoul St Mary’s hospital, a 1,200-bed tertiary university hospital, from March 2009 to October 2012. We examined the development of NODM in 6-year follow-up visits and collected the data of baseline characteristics of the subjects, including medical history, blood chemistry, lung function test results, anthropometric measurements, and body composition. We divided the selected healthy participants into four groups according to their baseline lung function results. Lung function parameters, FEV1, FVC, FEV/FVC ratio, and forced expiratory flow 25% to 75% (FEF25%−75%) were categorized depending on their baseline quantiles. Baseline characteristics were analyzed according to four ranges of different lung function parameters, and we evaluated the risk of future DM in a 6-year follow-up period according to these lung function ranges. DM diagnosis was defined by HbA1c of ≥6.5% according to the American Diabetes Association statement in 2011 [1].
- The study population was aged from 19 to 85 years, and regular health check-ups were performed to facilitate early detection of the diseases. The health promotion program collects data of the medical histories of the subjects and their family members with standardized questionnaires, blood chemistry tests, lung function tests, Body composition analysis, and imaging studies, including chest radiography, computed tomography, sonogram, and gastroenteroscopy. Retrospective data collection was performed to gather data of baseline characteristics of the participants, such as age, sex, body mass index (BMI), medical history, blood pressure (BP), anthropometric measurements, body composition, blood cholesterol level, and HbA1c.
- Body composition metrics, including height, weight, waist circumference (WC), skeletal muscle mass (MM), fat mass (FM), and fat mass index (FMI), were measured according to the bioelectrical impedance method using InBody 720 (Biospace, Seoul, Korea). BP was measured using an automatic BP monitor (TM-2655P, P.M.S., Berkshire, UK) after 5 minutes of rest. After fasting for at least 6 hours, blood samples were collected in sodium fluoride tubes for plasma glucose measurement and in serum-separating tubes for others. All measurements were performed using the Hitachi 7600 autoanalyzer (Hitachi Ltd., Tokyo, Japan) in the central laboratory of Seoul St Mary’s Hospital. Triglyceride, total, and low-density lipoprotein (LDL) cholesterol levels were measured through enzymatic assays, and high-density lipoprotein (HDL) cholesterol levels were measured through selective inhibition. HbA1c was measured by high-performance liquid chromatography using Diabetes Control and Complication Trial (DCCT)-aligned methods (TosohG8, Tosoh, Tokyo, Japan).
- Lung function assessment
- Spirometry was performed as recommended by the American Thoracic Society/European Respiratory Society guidelines [14] by trained examiners, using Vmax2130 (SensorMedics, Yorba Linda, CA, USA). FEF25%−75% was calculated according to the same guidelines. The absolute values of FVC and FEV1 were obtained, and the percentage of predicted values (% pred) for FVC and FEV1 was calculated from the following equations obtained in a representative sample from the Republic of Korea [15].
- Predicted FVC=–4.8434–[0.00008633×age2 (years)]+[0.05292×height (cm)]+[0.01095×weight (kg)]
- Predicted FEV1=–3.4132–[0.0002484×age2 (years)]+[0.04578×height (cm)]
- Data privacy and protection
- The data extracted in this study were stored as an encrypted file on the research director’s encrypted computer, and only the principal researcher could access it. For statistical analysis, all personal information was deleted, and in the case of data that can be individually identified, pseudonymization and anonymization were performed. Because of its retrospective nature, the requirement for informed consent was waived, and this study was approved by the Clinical Research Ethics Committee of the Catholic Medical Center (approval number: KC20RISI0886).
- Statistical analyses
- Data are expressed as means±standard deviations for continuous variables and numbers with percentages for categorical variables. Patients were grouped by quartile based on their initial FVC, FEV1, FEV1/FVC ratio, and FEF25%−75%. The associations between initial lung function biomarkers and diagnostic diabetes were determined by logistic regression considering confounders. All statistical analyses were performed using SAS version 9.4 (SAS Institute, Cary, NC, US), and P values that are <0.05 were considered statistically significant.
METHODS
- Baseline characteristics
- A total of 17,568 individuals were selected, and the participants were divided into four groups based on the quartiles of percent predicted FVC, FEV1, FEV1/FVC ratio, and FEF25%−75%. Based on the percent predicted FVC, the four categories were as follows: <86% in quartile 1, 86%–93% in quartile 2, 93%–101% in quartile 3, and ≥101% in quartile 4. Quartiles based on percent predicted FEV1 were as follows: <92% in quartile 1, 92%–100% in quartile 2, 100%–108% in quartile 3, and ≥108% in quartile 4. Quartiles based on the percent predicted FEV1/FVC ratio were as follows: <78% in quartile 1, 78%–82% in quartile 2, 82%–86% in quartile 3, and ≥86% in quartile 4. In addition, quartiles based on the percent predicted FEF25%−75% were as follows: <82% in quartile 1, 82%–99% in quartile 2, 99%–117% in quartile 3, and ≥117% in quartile 4.
- Table 1 describes the baseline characteristics of all included healthy individuals. The mean age was 45.3±9.9 years, 58.6% (10,298/17,568) were male, with a mean BMI of 23.5±3.1 kg/m2. When we compared lung function parameters according to a 10-year age scale, the FEV1/FVC ratio and FEF25%−75% had decreased in older adults (age of ≥60 years) compared with that in the younger population (age of <40 years). Among them, males had lower FEV1 (%) and FEV1/FVC ratios than females with statistical significances (FEV1 [%]: 99.4±0.1 vs. 101.4±0.2, P<0.001; FEV1/FVC ratio: 81.1±0.1 vs. 84.2±0.1, P<0.001). In addition, the FEV1/FVC ratio showed a decreasing tendency as the BMI increased (P<0.00). There were 1,328 (7.6%) participants who were treated for pulmonary tuberculosis (Tbc) and 253 (1.4%) who were treated for bronchial asthma. Lung function parameters including FEV1, FVC, FEV1/FVC ratio, and FEF25%−75% were lower in patients with histories of pulmonary Tbc or asthma, with significant differences. Histories of coronary-cerebrovascular disease was associated with a lower FEV1/FVC ratio (P=0.01), hypertension with the FEV1/FVC ratio (P<0.001), and FEF25%−75% (P<0.001). A family history of DM was associated with slightly lower FEV1 (%), FVC (%), FEF25%−75%, and a higher FEV1/FVC ratio. Initial anthropometric measurements and laboratory results are shown in Supplemental Table S1. The mean HbA1c was 5.4%±0.3%, and the mean fasting glucose level was 91.2±11.7 mg/dL. The mean MM was 27.0±6.2 kg, the mean FM was 17.0±5.2 kg, the mean WC was 82.5±8.7 cm, and the mean BP was 118.7± 13.8/73.1±10.3 mm Hg. In addition, the mean total cholesterol level was 194.7±32.2 mg/dL; the triglyceride level was 112.8± 80.0 mg/dL; HDL cholesterol level, 53.2±12.7 mg/dL; and LDL cholesterol level, 117.9±30.0 mg/dL.
- Comparison of baseline clinical characteristics according to lung function ranges
- We analyzed the differences in baseline characteristics according to the range of lung function parameters. FVC, FEV1, FEV1/FVC ratio, and FEF25%−75% were divided into four groups based on their quartiles. Table 2 shows that the histories of pulmonary Tbc, hypertension, and familial DM were different among the four groups of percent predicted FVC range, with the highest rate of history of pulmonary Tbc in the first quartile (P=0.004). Male sex, age, BMI, HbA1c, lipid profile, MM, FM, FMI, and WC also significantly differed between the four groups in all cases. MM was lowest in the first quartile group (FVC <86%), and body FM was highest. The percent predicted FEV1 showed different results; percentages of pulmonary Tbc and bronchial asthma histories were highest in the first quartile (FEV1 <92%), and participants in the first quartile group showed tendencies to have higher triglyceride (P<0.001) and lower HDL cholesterol (P<0.001) levels, with higher FM (P<0.001) and WC (P<0.001). Table 2 describes the different variables according to ranges of the FEV1/FVC ratio. The percentage of pulmonary Tbc history and bronchial asthma was highest in Q1 (FEV1/FVC ratio <78); moreover, subjects in the first quartile had increased age (P<0.001), HbA1c (P<0.001), and triglyceride level together with decreased HDL-cholesterol levels (P<0.001). MM and WC were highest in quartile 1. FEF25%−75% showed similar tendencies with the FEV1/FVC ratio. The percentages of pulmonary Tbc and asthma histories were highest in the first quartile (FEF25%−75% <82), and increased age; HbA1c, triglyceride, and lower HDL-cholesterol levels; and FM and WC were noted.
- Association between future DM risk and lung function parameters after 6 years
- To find the association between baseline lung function parameters and the development of DM after a 6-year follow-up, we performed multivariable logistic regression analyses, shown in Table 3. Among the 17,568 participants, 152 (0.9%) were diagnosed with DM. The mean follow-up duration was 2,214.7±193.6 days. Lung function increased in terms of percent predicted FVC (3.6±0.01), FEV1 (9.8±0.1), FEV1/FVC ratio (0.8±0.03), and FEF25%−75% (0.3±0.1) during the 6 years. The differences in lung function values between the baseline and the 6-year follow-up tended to increase from Q1 to Q4 (lowest to highest value). In subjects with the lowest FEV1/FVC ratio (Q1), the odds ratio (OR) of DM was 1.6 (95% confidence interval [CI], 1.1 to 2.5) compared with the highest quartile reference category (P=0.03). However, when we adjusted for age and sex, the OR for DM decreased in Q1–3 compared with the Q4 reference category and decreased in Q2, with significant differences (OR, 0.6; 95% CI, 0.4 to 1.0; P=0.04). In addition, the OR was 0.6 (95% CI, 0.3 to 0.9) after adjusting for age, sex, and BMI in Q2 compared with the Q4 reference (P=0.02). Baseline airflow obstruction and small airway disease, defined as an FEV1/FVC ratio of <0.7 and FEF25%−75% <80, individually had no association with the future risk of DM.
- Changes in lung function results and the correlation between lung function and other variables
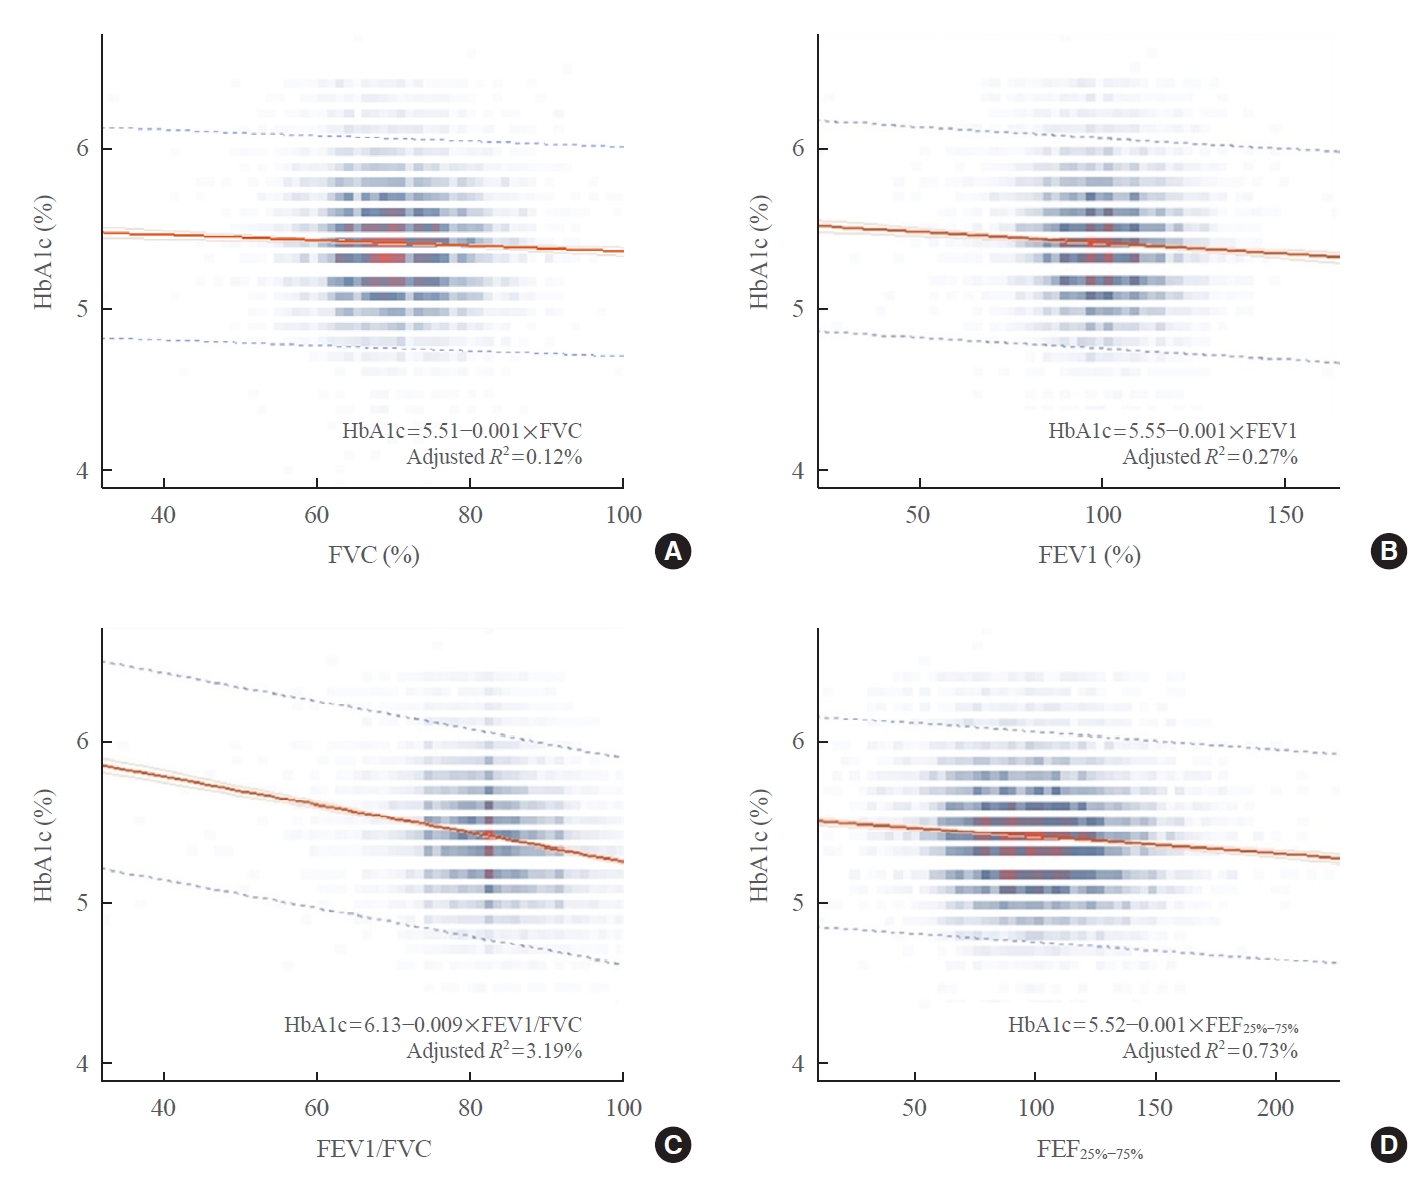
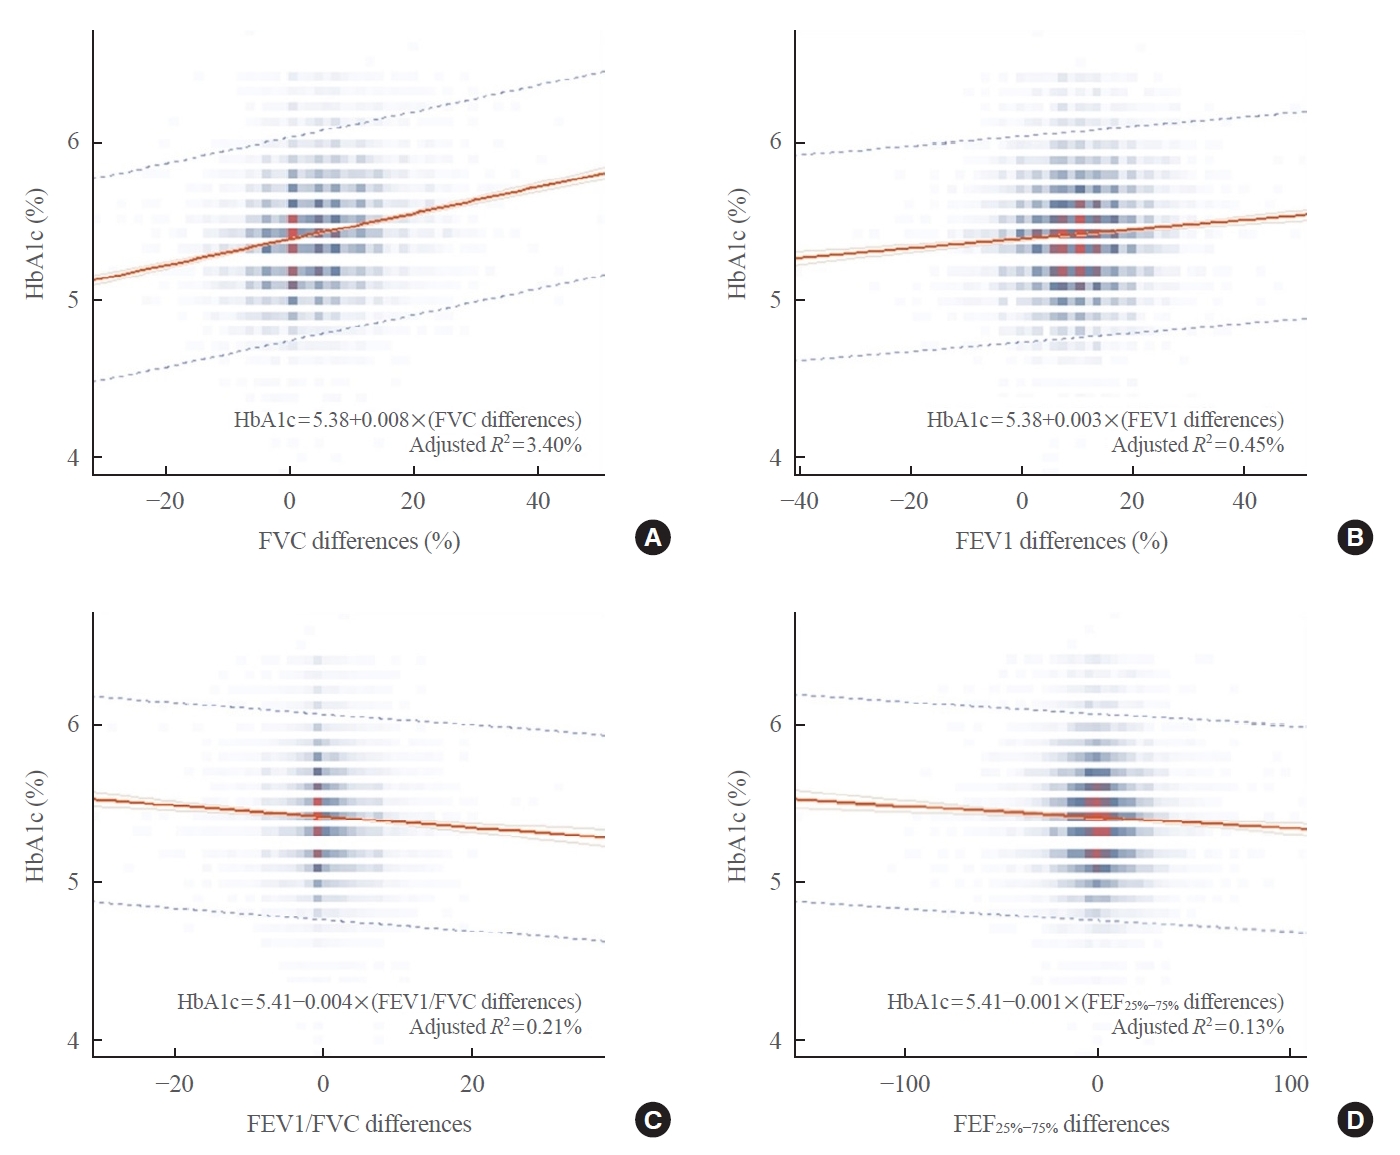
- Table 4 shows the correlation between baseline lung function results and other variables. There were negative correlations between HbA1c and all baseline lung function parameters. These findings, which are also described in Fig. 1, showed that HbA1c had negative linear correlations with lung function values. When we analyzed the correlation between the differences in lung function results and HbA1c, the FEV1/FVC ratio still showed a negative linear correlation to HbA1c, while FVC and FEV1 were positively correlated (Fig. 2).
RESULTS
- This study described an interesting negative association between the FEV1/FVC ratio and future DM risk in healthy individuals. Subjects with an FEV1/FVC ratio of 78 to 82 had a 40% lower risk of DM diagnosis in a 6-year follow-up compared with the reference group (FEV1/FVC ratio ≥86) after adjusting for age, BMI, and sex. However, percent predicted FVC, FEV1, FEV1/FVC ratio, and FEF25%−75% showed a negative linear correlation with baseline HbA1c. During the 6-year interval, a negative correlation was still observed in the plot of changes in FEV1/FVC ratio or FEF25%−75% versus HbA1c. That is, certain ranges of the FEV1/FVC ratio (78 to 82) could predict a decreased future risk of DM, and HbA1c increased with decreasing lung function parameters at baseline in non-diabetes individuals. Moreover, baseline HbA1c increased with changes in the FEV1/FVC ratio or FEF25%−75% decrease for 6 years.
- Several previous longitudinal studies evaluated the risk of future type 2 DM according to different baseline pulmonary function test results in non-diabetes subjects [16-20]. The consistent common findings of these studies were the increased risk of DM in the lowest quartile of predicted FEV1 (%) or FVC (%) compared with that in the highest quartile. They observed the incidence of DM during 9 to 37 years of follow-up using various diagnostic methods of DM. The diagnostic method was subjects’ report [18], fasting blood glucose level [19,20], or international classification of disease codes [16]. Instead of using these parameters to diagnose DM, Lazarus et al. [17] measured insulin levels and the fasting insulin resistance index to define insulin resistance. They found that baseline FVC, FEV1, and mid-expiratory flow rate were negatively associated with future insulin resistance after adjusting for baseline age, BMI, fat distribution pattern, and cigarette smoking [17]. Moreover, insulin secretion was also shown to be correlated to lung function parameters in previous studies. Alicandro et al. [21] reported that lower fasting blood C-peptide levels were associated with lower FEV1 values. Nezer et al. [22] also demonstrated that there was a negative correlation between baseline FEV1 and glucose level after a 2-hour oral glucose tolerance test (OGTT) and higher insulin secretion during pulmonary exacerbations in patients with cystic fibrosis.
- Contrary to this, the results of our study revealed a decreased risk of NODM associated with an FEV1/FVC ratio of 78 to 82 compared with higher reference ranges (FEV1/FVC ratio ≥86) which could be explained by our study’s distinct population. We excluded diabetes patients according to HbA1c at baseline, who were mainly middle-aged with some older adults aged >60 years. These inclusion criteria would have strictly excluded hyperglycemic individuals compared with other studies, which defined DM based on self-reporting. Moreover, subjects who were taking glucose-lowering agents might have been missed at the 6-year follow-up because of the definition of DM based on HbA1c. In fact, the proportion of participants diagnosed with DM after the 6-year follow-up was 0.9% in our study, which is smaller than that of 2.2% after a 5-year follow-up among individuals from another health check-up program in the Republic of Korea as described in another report [23]. However, the main strength of this study is its large population cohort recruited from one tertiary referral university hospital. We included 17,568 subjects who had serial lung function test results with 6-year intervals performed by trained technicians according to international guidelines. To the best of our knowledge, this is the largest study population that has been used to predict future DM risk according to different ranges of lung function in non-diabetes individuals.
- The occurrence of NODM in the young population has been recently gained much focus [24]. Because only few studies stratified the risk of NODM by age groups, our study could suggest new real-world evidence based on data from routine health check-ups. Data obtained from regular health check-up programs have several advantages compared with other big data regarding a variable number of clinical parameters and an easily tracked and consistent lung function testing protocol throughout the study. Moreover, we used NODM, a clear primary outcome for our analysis. These factors had enabled us to successfully identify the associations between variable clinical characteristics and NODM diagnoses.
- One cross-sectional study explained the impaired glucose metabolism was an independent mechanism of airway resistance in patients with obesity and asthma. Karampatakis et al. [25] had reported that asthmatics with insulin resistance had significantly lower values of bronchial hyperresponsiveness (BHR) than those without insulin resistance. They described that obesity alone was not a causal factor in BHR because BMI was not associated with changes in the value of the provocation dose of mannitol required to achieve 15% drop in FEV1 [25,26]. Kim et al. [27] also found that among the 1,058 healthy subjects, 33 (3.1%) had BHR based on methacholine bronchial provocation test, and insulin resistance and BMI were the significant risk factor for BHR after adjusting for age in women. At the molecular level, the effect of hyperinsulinemia on airway smooth muscle contractility by mast cells [28,29], to alter small airway parasympathetic innervation [30], or to increase transforming growth factor-β activity in the airway [31] were suggested as possible mechanisms for the association between BHR and insulin resistance. Although we could not suggest an exact mechanism for the link between airway limitation and future DM risk in healthy subjects without diabetes, the impairment of glucose metabolism would be one of the important factors contributing to airflow resistance, based on these studies and our results.
- However, evidence regarding the association between NODM and airflow obstruction from long-term follow-up studies is lacking. An FEV1/FVC ratio of <70 to 75 is defined as airway obstruction for the diagnosis and treatment of chronic obstructive pulmonary disease (COPD) according to international guidelines [32]. FEF25%−75% is a forced mid-expiratory flow, known to be the most sensitive measure of airflow in the peripheral airways, associated with small airway diseases [33]. Impaired FEF25%−75% in asymptomatic subjects has been defined as a surrogate marker for the early onset of asthma, BHR, or lower airway inflammation [34]. Moreover, the FEF25%−75% value was suggested as a predictor for COPD development in patients with normal lung function in a recent analysis [35]. Because the participants included in this study were healthy middle-aged individuals from a health promotion center, we included FEF25%−75% in analyzing the association between baseline lung function and future risk of DM to detect early small airway dysfunction. In previous studies, the baseline FEV1/FVC ratio did not show a statistically significant correlation with the diagnosis of DM [16,20]. The negative linear correlation between the FEV1/FVC ratio and future DM risk is a novel finding. Moreover, this is also the first trial to perform a regression analysis using FEF25%−75% regarding the risk of NODM diagnosis.
- The crude risk of DM diagnosis was 1.6 (95% CI, 1.1 to 2.5; P=0.03) in the lowest quartile (Q1) of the FEV1/FVC ratio compared with the reference quartile (Q4) (Table 3). However, this correlation was not observed after adjusting for compounding variables, including age and sex (model 1) or age, sex, and BMI (model 2). The risks were decreased in models 1 and 2 and were lowest in Q2 compared with reference Q4. Additional adjustment for history of pulmonary Tbc and asthma, which could affect airflow obstruction, showed the same result (data not shown). Therefore, the second quartile FEV1/FVC ratio would be an independent negative factor for future DM diagnosis after adjusting for older age, male sex, higher BMI, history of pulmonary Tbc, and bronchial asthma. This result is quite interesting because subjects in Q2 had higher proportion of hypertension, higher HbA1c, and slightly higher triglyceride and LDL-cholesterol levels than those in Q4 at baseline. Moreover, the negative linear correlation between baseline lung function parameter and HbA1c could describe uncovered equations in non-diabetes healthy individuals.
- There are several limitations to our study. The first limitation is the relatively short follow-up duration and absence of annual HbA1c values. Zaigham et al. [20] analyzed the hazard ratios of DM according to lung function over a 30-year follow-up period and showed that there was increased future DM risk in the latter years compared with that in the earlier phase. Moreover, the prevalence of DM increases significantly with age in the general population [36], and a 5-year follow-up period would have underdiagnosed those at risk for DM. While HbA1c levels can reflect the blood glucose status of individuals in the preceding 2 to 3 months [37], an analysis of annual follow-up HbA1c levels could reflect hyperglycemic changes more accurately. Instead of the cross-sectional study design employed in this study, a prospective longitudinal observational study design analyzing the risk of DM according to the FEV1/FVC ratio would be needed in future research. Another possible limitation of this study was that we missed adjusting for cigarette smoking history in the multivariate regression analysis. It is possible that the slightly decreased baseline FEV1 and FEV1/FVC ratio values in the male participants could have been affected by cigarette smoking. Although we included male sex as a confounding factor in the risk of DM, smoking history should be considered in future analyses. The third limitation is the restricted age group at baseline since 91.4% of the 17,568 individuals enrolled in our study were under the age of 60. However, in terms of predicting lung function deterioration in the future, this may be a clinically appropriate age range. Furthermore, this study was limited to patients who underwent a health check-up. There was also a limitation in the data that we were able to collect from the health-promotion center. Since the subjects visited the center at intervals of approximately 3 to 24 months, we could not define the exact timing of NODM diagnosis and HbA1c differences during the 6-year period. In addition, that we did not consider physical activity as a risk factor for NODM risk analysis could be a limitation. Epidemiological studies have demonstrated that low levels of physical activity and fitness are prominent, independent, and modifiable risk factors for the development of type 2 DM [38-40]. Finally, the single-center cohort design of this study was a limitation. However, since we performed a comparison of the parameters after a 6-year period, we considered the reliability of the laboratory data to be high enough that this may be considered a strength.
- In conclusion, our study described that the baseline FEV1/FVC ratio of 78 to 82 was associated with a 40% lower risk of future DM diagnosis than a higher FEV1/FVC ratio of ≥86 after adjusting for age, sex, and BMI. In non-diabetes individuals, decreased FEV1 (%), FVC (%), FEV1/FVC ratio, and FEF25%−75% were associated with an increased HbA1c level in linear regression analysis. These findings could enable the determination of the risk of new-onset diabetes after 6 years based on lung function parameters in healthy subjects, which could identify the at-risk population for DM through further large-scale research.
DISCUSSION
Supplementary Information
Supplemental Table S1.
-
CONFLICTS OF INTEREST
This study was supported by the Daewoong Pharmaceutical company.
-
AUTHOR CONTRIBUTION
Conception or design: H.Y.L., H.S.K. Acquisition, analysis, or interpretation of data: J.S., H.S.K. Drafting the work or revising: H.Y.L., H.S.K. Final approval of the manuscript: H.K., S.H.L., J.H.C., S.Y.L.
Article information

Values are expressed as number (%) or mean±standard deviation.
FVC, forced vital capacity; BMI, body mass index; HbA1c, hemoglobin A1c; HDL-C, high-density lipoprotein cholesterol; LDL-C, low-density lipoprotein cholesterol; FMI, fat mass index; WC, waist circumference; Tbc, tuberculosis; CVD, cerebrovascular disease; DM, diabetes mellitus; FEV1, forced expiratory volume for 1 second; FEF25%−75%, forced expiratory flow at 25% to 75%.
Values are expressed as mean±standard deviation or number (%). Model 1: adjusted for age and sex; Model 2: adjusted for age, sex, and body mass index.
NODM, new-onset diabetes mellitus; OR, odds ratio; CI, confidence interval; FVC, forced vital capacity; FEV1, forced expiratory volume for 1 seconds; FEF25%−75%, forced expiratory flow at 25% to 75%.
- 1. American Diabetes Association. Diagnosis and classification of diabetes mellitus. Diabetes Care 2011;34 Suppl 1(Suppl 1):S62–9.ArticlePubMedPDF
- 2. van den Borst B, Gosker HR, Zeegers MP, Schols AM. Pulmonary function in diabetes: a metaanalysis. Chest 2010;138:393–406.ArticlePubMed
- 3. Sonoda N, Morimoto A, Tatsumi Y, Asayama K, Ohkubo T, Izawa S, et al. The association between glycemic control and lung function impairment in individuals with diabetes: the Saku study. Diabetol Int 2018;10:213–8.ArticlePubMedPMC
- 4. Sonoda N, Morimoto A, Tatsumi Y, Asayama K, Ohkubo T, Izawa S, et al. A prospective study of the impact of diabetes mellitus on restrictive and obstructive lung function impairment: The Saku study. Metabolism 2018;82:58–64.ArticlePubMed
- 5. Davis WA, Knuiman M, Kendall P, Grange V, Davis TM; Fremantle Diabetes Study. Glycemic exposure is associated with reduced pulmonary function in type 2 diabetes: the Fremantle Diabetes Study. Diabetes Care 2004;27:752–7.PubMed
- 6. Sanchez E, Gutierrez-Carrasquilla L, Barbe F, Betriu A, Lopez-Cano C, Gaeta AM, et al. Lung function measurements in the prediabetes stage: data from the ILERVAS Project. Acta Diabetol 2019;56:1005–12.ArticlePubMed
- 7. Cazzola M, Rogliani P, Calzetta L, Lauro D, Page C, Matera MG. Targeting mechanisms linking COPD to type 2 diabetes mellitus. Trends Pharmacol Sci 2017;38:940–51.ArticlePubMed
- 8. Enomoto T, Usuki J, Azuma A, Nakagawa T, Kudoh S. Diabetes mellitus may increase risk for idiopathic pulmonary fibrosis. Chest 2003;123:2007–11.ArticlePubMed
- 9. Kodolova IM, Lysenko LV, Saltykov BB. Changes in the lungs in diabetes mellitus. Arkh Patol 1982;44:35–40.
- 10. Spranger J, Kroke A, Mohlig M, Hoffmann K, Bergmann MM, Ristow M, et al. Inflammatory cytokines and the risk to develop type 2 diabetes: results of the prospective population-based European Prospective Investigation into Cancer and Nutrition (EPIC)-Potsdam Study. Diabetes 2003;52:812–7.PubMed
- 11. Barnes PJ. Inflammatory mechanisms in patients with chronic obstructive pulmonary disease. J Allergy Clin Immunol 2016;138:16–27.ArticlePubMed
- 12. Fogarty AW, Lewis SA, McKeever TM, Britton J. The association of two different measures of body habitus with lung function: a population-based study. Respir Med 2011;105:1896–901.ArticlePubMed
- 13. Sheen YJ, Hsu CC, Jiang YD, Huang CN, Liu JS, Sheu WH. Trends in prevalence and incidence of diabetes mellitus from 2005 to 2014 in Taiwan. J Formos Med Assoc 2019;118 Suppl 2:S66–73.ArticlePubMed
- 14. Miller MR, Hankinson J, Brusasco V, Burgos F, Casaburi R, Coates A, et al. Standardisation of spirometry. Eur Respir J 2005;26:319–38.ArticlePubMed
- 15. Choi JK, Paek D, Lee JO. Normal predictive values of spirometry in Korean population. Tuberc Respir Dis 2005;58:230–42.Article
- 16. Ford ES, Mannino DM; National Health and Nutrition Examination Survey Epidemiologic Follow-up Study. Prospective association between lung function and the incidence of diabetes: findings from the National Health and Nutrition Examination Survey Epidemiologic Follow-up Study. Diabetes Care 2004;27:2966–70.PubMed
- 17. Lazarus R, Sparrow D, Weiss ST. Baseline ventilatory function predicts the development of higher levels of fasting insulin and fasting insulin resistance index: the Normative Aging Study. Eur Respir J 1998;12:641–5.ArticlePubMed
- 18. Wannamethee SG, Shaper AG, Rumley A, Sattar N, Whincup PH, Thomas MC, et al. Lung function and risk of type 2 diabetes and fatal and nonfatal major coronary heart disease events: possible associations with inflammation. Diabetes Care 2010;33:1990–6.ArticlePubMedPMC
- 19. Yeh HC, Punjabi NM, Wang NY, Pankow JS, Duncan BB, Brancati FL. Vital capacity as a predictor of incident type 2 diabetes: the Atherosclerosis Risk in Communities study. Diabetes Care 2005;28:1472–9.PubMed
- 20. Zaigham S, Nilsson PM, Wollmer P, Engstrom G. The temporal relationship between poor lung function and the risk of diabetes. BMC Pulm Med 2016;16:75.ArticlePubMedPMC
- 21. Alicandro G, Battezzati PM, Battezzati A, Speziali C, Claut L, Motta V, et al. Insulin secretion, nutritional status and respiratory function in cystic fibrosis patients with normal glucose tolerance. Clin Nutr 2012;31:118–23.ArticlePubMed
- 22. Nezer N, Shoseyov D, Kerem E, Zangen DH. Patients with cystic fibrosis and normoglycemia exhibit diabetic glucose tolerance during pulmonary exacerbation. J Cyst Fibros 2010;9:199–204.ArticlePubMed
- 23. Kwon CH, Rhee EJ, Song JU, Kim JT, Kwag HJ, Sung KC. Reduced lung function is independently associated with increased risk of type 2 diabetes in Korean men. Cardiovasc Diabetol 2012;11:38.ArticlePubMedPMC
- 24. Nadeau KJ, Anderson BJ, Berg EG, Chiang JL, Chou H, Copeland KC, et al. Youth-onset type 2 diabetes consensus report: current status, challenges, and priorities. Diabetes Care 2016;39:1635–42.ArticlePubMedPMC
- 25. Karampatakis N, Karampatakis T, Galli-Tsinopoulou A, Kotanidou EP, Tsergouli K, Eboriadou-Petikopoulou M, et al. Impaired glucose metabolism and bronchial hyperresponsiveness in obese prepubertal asthmatic children. Pediatr Pulmonol 2017;52:160–6.ArticlePubMed
- 26. Ali-Dinar T, Lang JE. Is impaired glucose metabolism the missing piece in the obesity-asthma puzzle? Pediatr Pulmonol 2017;52:147–50.ArticlePubMed
- 27. Kim KM, Kim SS, Lee SH, Song WJ, Chang YS, Min KU, et al. Association of insulin resistance with bronchial hyperreactivity. Asia Pac Allergy 2014;4:99–105.ArticlePubMedPMC
- 28. Cavalher-Machado SC, de Lima WT, Damazo AS, de Frias Carvalho V, Martins MA, e Silva PMR, et al. Down-regulation of mast cell activation and airway reactivity in diabetic rats: role of insulin. Eur Respir J 2004;24:552–8.ArticlePubMed
- 29. Lessmann E, Grochowy G, Weingarten L, Giesemann T, Aktories K, Leitges M, et al. Insulin and insulin-like growth factor-1 promote mast cell survival via activation of the phosphatidylinositol-3-kinase pathway. Exp Hematol 2006;34:1532–41.ArticlePubMed
- 30. Belmonte KE, Jacoby DB, Fryer AD. Increased function of inhibitory neuronal M2 muscarinic receptors in diabetic rat lungs. Br J Pharmacol 1997;121:1287–94.ArticlePubMedPMCPDF
- 31. Park YH, Oh EY, Han H, Yang M, Park HJ, Park KH, et al. Insulin resistance mediates high-fat diet-induced pulmonary fibrosis and airway hyperresponsiveness through the TGF-β1 pathway. Exp Mol Med 2019;51:1–12.Article
- 32. Celli BR, MacNee W; ATS/ERS Task Force. Standards for the diagnosis and treatment of patients with COPD: a summary of the ATS/ERS position paper. Eur Respir J 2004;23:932–46.ArticlePubMed
- 33. Pellegrino R, Viegi G, Brusasco V, Crapo RO, Burgos F, Casaburi R, et al. Interpretative strategies for lung function tests. Eur Respir J 2005;26:948–68.ArticlePubMed
- 34. Ciprandi G, Cirillo I. The pragmatic role of FEF25-75 in asymptomatic subjects, allergic rhinitis, asthma, and in military setting. Expert Rev Respir Med 2019;13:1147–51.ArticlePubMed
- 35. Kwon DS, Choi YJ, Kim TH, Byun MK, Cho JH, Kim HJ, et al. FEF25-75% values in patients with normal lung function can predict the development of chronic obstructive pulmonary disease. Int J Chron Obstruct Pulmon Dis 2020;15:2913–21.PubMedPMC
- 36. Lovic D, Piperidou A, Zografou I, Grassos H, Pittaras A, Manolis A. The growing epidemic of diabetes mellitus. Curr Vasc Pharmacol 2020;18:104–9.ArticlePubMed
- 37. Little RR, Rohlfing C, Sacks DB. The National Glycohemoglobin Standardization Program: over 20 years of improving hemoglobin A1c measurement. Clin Chem 2019;65:839–48.ArticlePubMed
- 38. Laaksonen DE, Lindstrom J, Lakka TA, Eriksson JG, Niskanen L, Wikstrom K, et al. Physical activity in the prevention of type 2 diabetes: the Finnish diabetes prevention study. Diabetes 2005;54:158–65.PubMed
- 39. Lindstrom J, Peltonen M, Tuomilehto J. Lifestyle strategies for weight control: experience from the Finnish Diabetes Prevention Study. Proc Nutr Soc 2005;64:81–8.ArticlePubMed
- 40. Baker MK, Simpson K, Lloyd B, Bauman AE, Singh MA. Behavioral strategies in diabetes prevention programs: a systematic review of randomized controlled trials. Diabetes Res Clin Pract 2011;91:1–12.ArticlePubMed
References
Figure & Data
References
Citations
- The association of spirometric small airways obstruction with respiratory symptoms, cardiometabolic diseases, and quality of life: results from the Burden of Obstructive Lung Disease (BOLD) study
Ben Knox-Brown, Jaymini Patel, James Potts, Rana Ahmed, Althea Aquart-Stewart, Cristina Barbara, A. Sonia Buist, Hamid Hacene Cherkaski, Meriam Denguezli, Mohammed Elbiaze, Gregory E. Erhabor, Frits M. E. Franssen, Mohammed Al Ghobain, Thorarinn Gislason,
Respiratory Research.2023;[Epub] CrossRef - Diabetes-related perturbations in the integrity of physiologic barriers
Arshag D. Mooradian
Journal of Diabetes and its Complications.2023; 37(8): 108552. CrossRef - Association of MMP7 T > C Gene Variant (rs10502001) and Expression in Chronic Obstructive Pulmonary Disease
Saurabh Kumar, Suchit Swaroop, Akancha Sahu, Surya Kant, Monisha Banerjee
DNA and Cell Biology.2023; 42(9): 548. CrossRef - Association between glycated haemoglobin and the risk of chronic obstructive pulmonary disease: A prospective cohort study in UK biobank
Mengyao Li, Yanan Wan, Zheng Zhu, Pengfei Luo, Hao Yu, Jian Su, Dong Hang, Yan Lu, Ran Tao, Ming Wu, Jinyi Zhou, Xikang Fan
Diabetes, Obesity and Metabolism.2023; 25(12): 3599. CrossRef - Combined multi-omics analysis reveals oil mist particulate matter-induced lung injury in rats: Pathological damage, proteomics, metabolic disturbances, and lung dysbiosis
Huipeng Nie, Huanliang Liu, Yue Shi, Wenqing Lai, Xuan Liu, Zhuge Xi, Bencheng Lin
Ecotoxicology and Environmental Safety.2022; 241: 113759. CrossRef - Retrospective cohort analysis comparing changes in blood glucose level and body composition according to changes in thyroid‐stimulating hormone level
Hyunah Kim, Da Young Jung, Seung‐Hwan Lee, Jae‐Hyoung Cho, Hyeon Woo Yim, Hun‐Sung Kim
Journal of Diabetes.2022; 14(9): 620. CrossRef - Improving Machine Learning Diabetes Prediction Models for the Utmost Clinical Effectiveness
Juyoung Shin, Joonyub Lee, Taehoon Ko, Kanghyuck Lee, Yera Choi, Hun-Sung Kim
Journal of Personalized Medicine.2022; 12(11): 1899. CrossRef
 PubReader
 ePub Link
 Cite
Cite