Articles
- Page Path
- HOME > Endocrinol Metab > Volume 36(4); 2021 > Article
-
Original ArticleThyroid The Positive Association between Subclinical Hypothyroidism and Newly-Diagnosed Hypertension Is More Explicit in Female Individuals Younger than 65
-
Xichang Wang1*
 , Haoyu Wang1*, Li Yan2*, Lihui Yang3*, Yuanming Xue4, Jing Yang5, Yongli Yao6, Xulei Tang7, Nanwei Tong8, Guixia Wang9, Jinan Zhang10, Youmin Wang11, Jianming Ba12, Bing Chen13, Jianling Du14, Lanjie He15, Xiaoyang Lai16, Yanbo Li17, Zhaoli Yan18, Eryuan Liao19, Chao Liu20, Libin Liu21, Guijun Qin22, Yingfen Qin23, Huibiao Quan24, Bingyin Shi25, Hui Sun26, Zhen Ye27, Qiao Zhang28, Lihui Zhang29, Jun Zhu30, Mei Zhu31, Yongze Li1, Weiping Teng1, Zhongyan Shan1
 -
Endocrinology and Metabolism 2021;36(4):778-789.
DOI: https://doi.org/10.3803/EnM.2021.1101
Published online: August 10, 2021
1Department of Endocrinology and Metabolism and the Institute of Endocrinology, The NHC Key Laboratory of Diagnosis and Treatment of Thyroid Diseases, The First Hospital of China Medical University, Shenyang, China
2Department of Endocrinology and Metabolism, Sun Yat-sen Memorial Hospital, Sun Yat-sen University, Guangzhou, China
3Department of Endocrinology and Metabolism, People’s Hospital of the Tibet Autonomous Region, Lhasa, Tibet, China
4Department of Endocrinology, The First People’s Hospital of Yunnan Province, Kunming, China
5Department of Endocrinology, The First Hospital of Shanxi Medical University, Taiyuan, China
6Department of Endocrinology, Qinghai Provincial People’s Hospital, Xining, China
7Department of Endocrinology, The First Hospital of Lanzhou University, Lanzhou, China
8Department of Endocrinology and Metabolism, State Key Laboratory of Biotherapy, West China Hospital, Sichuan University, Chengdu, China
9Department of Endocrinology and Metabolism, The First Hospital of Jilin University, Changchun, China
10Department of Endocrinology, Health Science Affiliated Zhoupu Hosipital, Shanghai University of Medicine, Shanghai, China
11Department of Endocrinology, The First Hospital of An Hui Medical University, Hefei, China
12Department of Endocrinology, Chinese PLA General Hospital, Beijing, China
13Department of Endocrinology, Southwest Hospital, Third Military Medical University, Chongqing, China
14Department of Endocrinology, The First Affiliated Hospital of Dalian Medical University, Dalian, China
15Department of Endocrinology, Cardiovascular and Cerebrovascular Disease Hospital of Ningxia Medical University, Yinchuan, China
16Department of Endocrinology and Metabolism, The Second Affiliated Hospital of Nanchang University, Nanchang, China
17Department of Endocrinology, The First Affiliated Hospital of Harbin Medical University, Harbin, China
18Department of Endocrinology, The Affiliated Hospital of Inner Mongolia Medical University. Hohhot, China
19Department of Endocrinology and Metabolism, The Second Xiangya Hospital, Central South University, Changsha, China
20Research Center of Endocrine and Metabolic Diseases, Affiliated Hospital of Integrated Traditional Chinese and Western Medicine, Nanjing University of Chinese Medicine, Nanjing, China
21Department of Endocrinology and Metabolism, Fujian Institute of Endocrinology, Fujian Medical University Union Hospital, Fuzhou, China
22Division of Endocrinology, Department of Internal Medicine, The First Affiliated Hospital, Zhengzhou University, Zhengzhou, China
23Department of Endocrine, First Affiliated Hospital of Guangxi Medical University, Nanning, China
24Department of Endocrinology, Hainan General Hospital, Haikou, China
25Department of Endocrinology, The First Affiliated Hospital of Xi’an Jiaotong University, Xi’an, China
26Department of Endocrinology, Union Hospital, Tongji Medical College, Huazhong University of Science and Technology, Wuhan, China
27Zhejiang Provincial Center for Disease Control and Prevention, Hangzhou, China
28Department of Endocrinology and Metabolism, Affiliated Hospital of Guiyang Medical University, Guiyang, China
29Department of Endocrinology, Second Hospital of Hebei Medical University, Shijiazhuang, China
30Department of Endocrinology, The First Affiliated Hospital of Xinjiang Medical University, Urumqi, China
31Department of Endocrinology and Metabolism, Tianjin Medical University General Hospital, Tianjin, China
- Corresponding authors: Zhongyan Shan. Department of Endocrinology and Metabolism and the Institute of Endocrinology, The NHC Key Laboratory of Diagnosis and Treatment of Thyroid Diseases, The First Hospital of China Medical University, No. 155 Nanjing North Street, Heping District, Shenyang 110001, China, Tel: +86-24-83283298, Fax: +86-024-83283298, E-mail: cmushanzhongyan@163.com.
- Weiping Teng. Department of Endocrinology and Metabolism and the Institute of Endocrinology, The NHC Key Laboratory of Diagnosis and Treatment of Thyroid Diseases, The First Hospital of China Medical University, No. 155 Nanjing North Street, Heping District, Shenyang 110001, China, Tel: +86-24-83283298, Fax: +86-024-83283298, E-mail: twp@vip.163.com
- * These authors contributed equally to this work.
Copyright © 2021 Korean Endocrine Society
This is an Open Access article distributed under the terms of the Creative Commons Attribution Non-Commercial License (https://creativecommons.org/licenses/by-nc/4.0/) which permits unrestricted non-commercial use, distribution, and reproduction in any medium, provided the original work is properly cited.
ABSTRACT
-
Background
- Subclinical hypothyroidism (SCH) is the most common thyroid dysfunction, and its relationship with blood pressure (BP) has been controversial. The aim of the study was to analyze the association between SCH and newly-diagnosed hypertension.
-
Methods
- Based on data from the Thyroid disease, Iodine nutrition and Diabetes Epidemiology (TIDE) study, 49,433 euthyroid individuals and 7,719 SCH patients aged ≥18 years were enrolled. Patients with a history of hypertension or thyroid disease were excluded. SCH was determined by manufacturer reference range. Overall hypertension and stage 1 and 2 hypertension were diagnosed according to the guidelines issued by the American College of Cardiology/American Heart Association in 2017.
-
Results
- The prevalence of overall hypertension (48.7%), including stage 1 (28.9%) and 2 (19.8%) hypertension, increased significantly in SCH patients compared with euthyroid subjects. With elevated serum thyroid stimulating hormone (TSH) level, the hypertension prevalence also increased significantly from the euthyroid to different SCH subgroups, which was more profound in females or subjects aged <65 years. The age- and sex-specific regression analysis further demonstrated the same trends in the general population and in the 1:1 propensity matched population. Similarly, several BP components (i.e., systolic, diastolic, and mean arterial BP) were positively associated with TSH elevation, and regression analysis also confirmed that all BP components were closely related with SCH in female subjects aged <65 years.
-
Conclusion
- The prevalence of hypertension increases for patients with SCH. SCH tends to be associated with hypertension and BP components in females younger than 65 years.
- Currently, approximately 1 billion people worldwide suffer from hypertension, which is the main cause of premature death, atrial fibrillation, heart failure, chronic kidney disease, peripheral artery disease, and even reduced cognitive ability [1]. Research has shown that hypertension is one of the leading causes of death [2,3], regardless of elevated systolic blood pressure (SBP) or diastolic blood pressure (DBP) or whether ambulatory or clinic blood pressure (BP) is measured [4]. According to the diagnostic criteria of the 2017 American College of Cardiology (ACC)/American Heart Association (AHA) guidelines, the prevalence of hypertension reached 23.2% in recent years, which equals over 200 million hypertension patients in mainland China [5]. However, only 40% of the patients were aware of their elevated BP, only 40% of whom were further treated [5]; therefore, screening is necessary to treat patients with unknown hypertension.
- Primary hypertension is the main cause of hypertension. Overt hyperthyroidism and hypothyroidism also induce hypertension [6]. Subclinical hypothyroidism (SCH) is defined as elevated serum thyroid stimulating hormone (TSH) levels, with serum thyroid hormone levels remaining normal; this is one of the most common public health burdens in the thyroid field in mainland China, with a prevalence from 1.0% to 12.93% worldwide [7,8]. Whether SCH can induce hypertension remains under debate.
- Furthermore, despite a few positive associations between SCH and BP parameters in several cross-sectional studies [9,10], several studies have failed to verify such an association. In an Australian cross-sectional study covering 2,033 subjects, no differences were found in hypertension prevalence or BP components between euthyroid and SCH groups [11]. In another small-scale cross-sectional survey, Luboshitzky et al. [12] found that mean DBP was significantly higher in patients with SCH, while mean SBP was not statistically different between euthyroid and SCH groups. Furthermore, Takashima et al. [13] found that BP components were not significantly higher in the SCH group, compared with the control group.
- In this large cross-sectional study, we analyzed the association between hypertension and SCH in 57,152 adult subjects without a personal history of hypertension or thyroid disease, and we sought to provide more information in different age and sex groups.
INTRODUCTION
- Sample collection
- All data analyzed in this study were derived from the Thyroid disease, Iodine nutrition and Diabetes Epidemiology (TIDE) Study [8,14]. Briefly, the TIDE survey was performed using a cluster stratified random sampling method among 80,937 subjects in 31 provinces/cities in mainland China. Samples were selected according to age, sex, and the ratio of urban/rural residents in each region based on the 2010 national census. Demographic information, personal history of thyroid disease, hypertension, and diabetes, use of iodine-containing drugs, smoking status, education level, daily salt intake and other demographic information were covered in the questionnaire. The TIDE Study was approved by the Medical Ethics Committee of China Medical University (Approval No. 2014-103-2). All participants were willing to sign informed consent forms after a detailed explanation of the study protocol.
- Inclusion and exclusion criteria
- In inclusion criteria, the entire initial data in the present study were equal to the data of the TIDE survey [8,14]. Briefly, adults aged 18 years or older, having lived in the area for over 5 years, having not administered contrast agents or iodine drugs within 3 months, and non-pregnant individuals were enrolled.
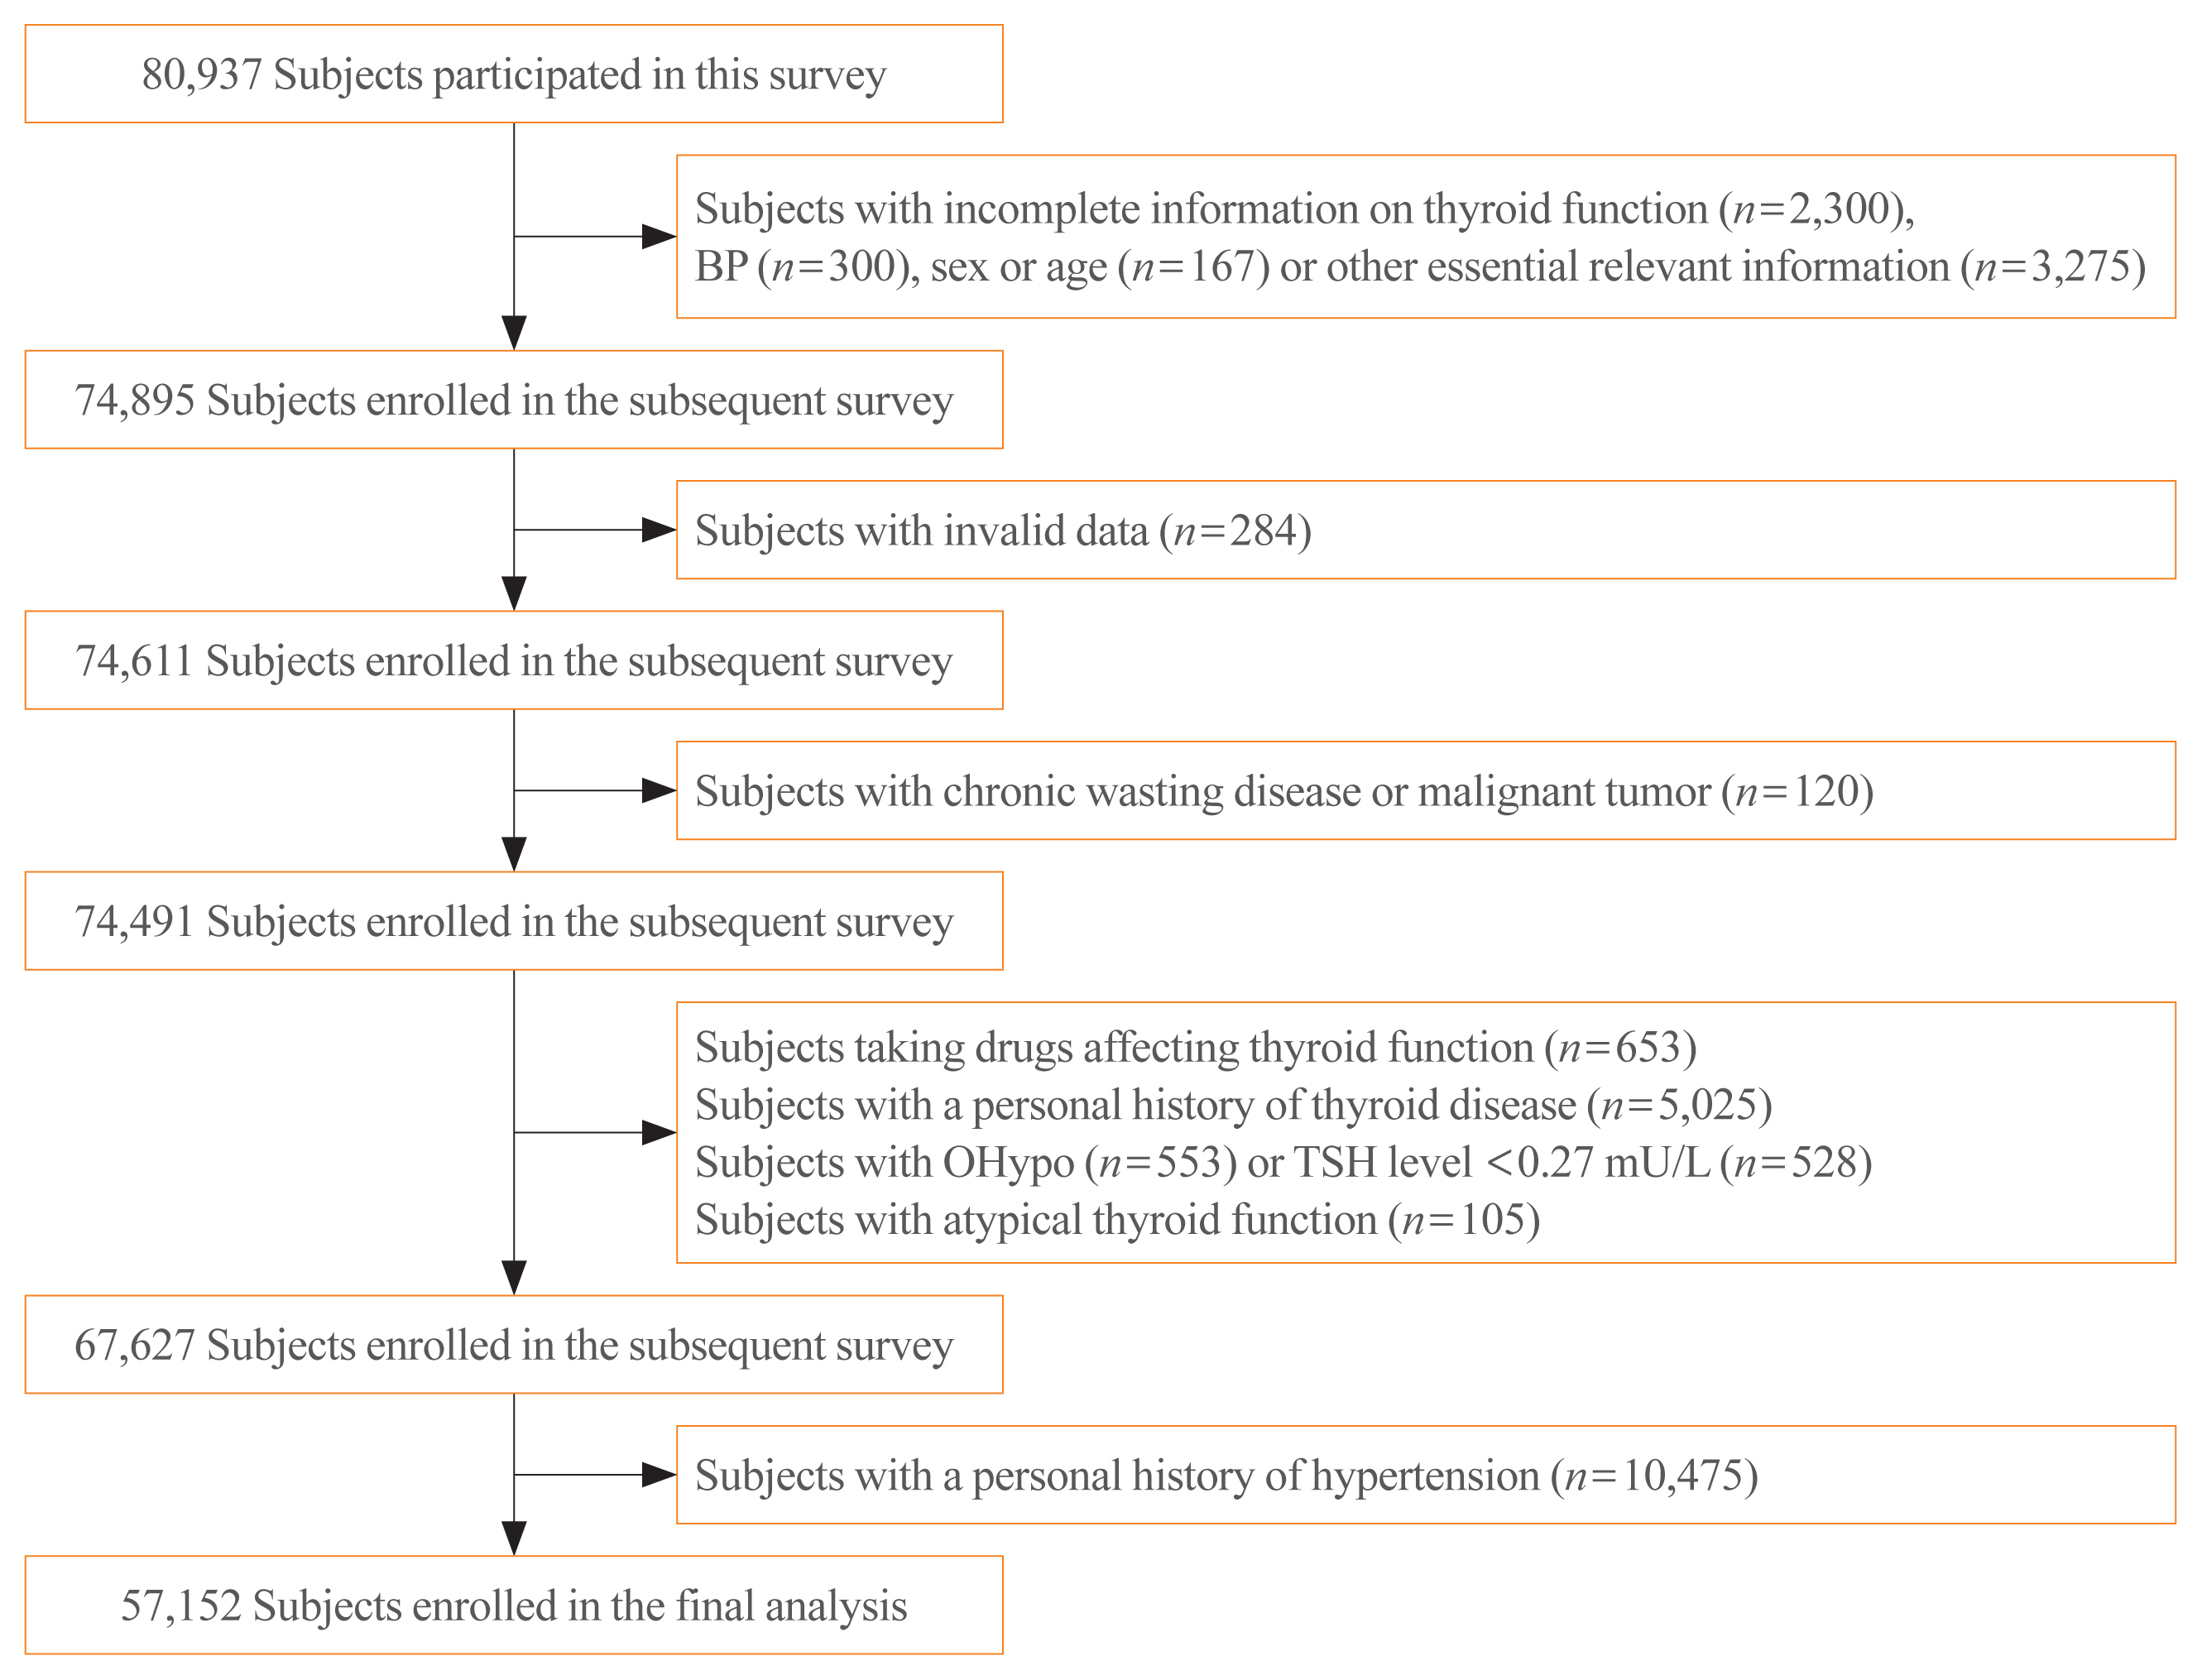
- In exclusion criteria, individuals with missing or invalid data, individuals with malignancy or chronic wasting disease, individuals with a personal history of thyroid disease or hypertension, individuals currently taking drugs that might affect thyroid function, and individuals with hyperthyroidism or overt hypothyroidism were excluded. Finally, 57,152 subjects were enrolled, and the screening procedure is presented in Fig. 1.
- Blood pressure measurement
- Blood pressure (SBP and DBP) was measured twice on the nondominant arm by electronic BP measurement (Omron HEM-7430, Omron Corporation, Kyoto, Japan) with a proper cuff size. All individuals were asked to empty their bladder and rest for at least 5 minutes before the BP measurement, and conversation was not allowed during the measurement. The mean value of two sequential measurements (separated by 10 minutes) was considered as the final BP value. The calculating formulas of pulse pressure (PP) and mean arterial pressure (MAP) are listed in Table 1.
- Thyroid function measurement
- Fasting blood samples were taken from each individual. After centrifugation, the serum was stored at −20°C and sent through a cold chain logistics system to the central laboratory in Shenyang for unified testing. Serum TSH was detected by a Cobas 601 Analyzer (Roche Diagnostics, Rotkreuz, Switzerland). Free thyroxine (FT4) was measured as TSH above the upper limit of the reference range (ULRR).
- Diagnostic criteria
- The components and categories of BP in this study refer to the guidelines jointly issued by the AHA and ACC in 2017 [15], which are presented in Table 1. According to the instructions provided by the kit, the reference ranges for TSH and FT4 were 0.27 to 4.2 mU/L and 12.0 to 22.0 pmol/L, respectively.
- Considering the authoritative recommendations in previous studies [16–19], we set the upper limit of serum TSH level at 19.99 mU/L for diagnosing SCH. Hyperthyroidism was diagnosed if TSH was below the lower limit of the reference range (LLRR). Overt hypothyroidism was diagnosed if TSH exceeded the ULRR and FT4 was lower than LLRR, or if TSH exceeded 19.99 mU/L and the FT4 level remained normal. SCH was defined as a TSH level over the ULRR and less than 20 mU/L with a normal FT4 level.
- The diagnostic criteria for diabetes were consistent with a recently published survey [14]. Diabetes was defined as the sum-up of self-reported and newly-diagnosed diabetes. The self-reported diagnosis was determined by the questionnaire survey. Among the subjects without self-reported diabetes, newly-diagnosed diabetes was determined by the biochemical assessment. If a subject met one of the following items, newly-diagnosed diabetes would be determined: fasting plasma glucose ≥126 mg/dL (7.0 mmol/L), or 2-hour plasma glucose ≥200 mg/dL (11.1 mmol/L) (by the means of 75 g-oral glucose tolerance test), or glycosylated hemoglobin ≥6.5%. Regarding the specific detection methods of the above indicators, our previously published articles can be referred to [14].
- Statistical analysis
- The above data were input into SPSS version 25 (IBM Co., Armonk, NY, USA). All P values obtained were based on two-tailed tests, with significance levels set at 0.05 or 0.01. In the descriptive analysis, continuous variables were described as the means and standard deviations, and dichotomous variables were described as the numbers and corresponding percentages. Single-sample t test and chi-square test were respectively used to compare differences in continuous and dichotomous variables, both between the two groups with different BP levels as well as between the groups with different levels of thyroid function. Multivariate logistic regression and multivariate linear regression were used to analyze the influence of different variables on the prevalence and components of BP, respectively.
- Given the heterogeneity of baseline characteristics between non-hypertensive and hypertensive individuals in the preliminary analysis, propensity score matching (PSM) was applied to minimize the impact of several risk factors for hypertension. According to the baseline comparison, residence, education level, smoking frequency, daily salt intake, diabetes, body mass index (BMI), and waist circumference were defined as the predictive variables in the 1:1 PSM. Individual patient propensity scores were calculated using logistic regression analysis. The tolerance threshold of matching was set at 0.01.
METHODS
- General characteristics of the participants
- The 57,152 participants included 28,658 males and 28,494 females, with an average age of 40.6±14.8 (age range, 18 to 97). All the participants were separated into the following two groups: individuals with SBP ≥130 mm Hg or DBP ≥80 mm Hg (hypertension group, n=26,053) and individuals with SBP <130 mm Hg and DBP <80 mm Hg (non-hypertension group, n=31,099). As shown in Table 2, there were significant differences in age, sex, residence, education level, smoking frequency, daily salt intake, waist circumference, diabetes prevalence, BMI, heart rate, and serum TSH concentration between the two groups (P<0.01). The mean TSH level of the hypertension group was higher than the non-hypertension group.
- The participants were further divided into euthyroid (n= 49,433) and SCH (n=7,719) groups according to the abovementioned diagnostic criteria. As Table 3 shows, with the exception of daily salt intake, diabetes prevalence and waist, all demographic and anthropometric indicators showed statistical significance between the two groups (P<0.01). Furthermore, SBP, DBP, PP, MAP values, overall and both stages of hypertension prevalence were all significantly higher in the SCH group than in the euthyroid group (P<0.05).
- Hypertension prevalence in subgroups of SCH
- On the basis of definitions in several clinical guidelines and expert consensus in recent years [16,20,21], we divided the SCH group into SCH1 (TSH 4.21 to 6.99 mU/L), SCH2 (TSH 7.00 to 9.99 mU/L), and SCH3 subgroups (TSH 10.00 to 19.99 mU/L). Overall hypertension and stage 1 and stage 2 hypertension prevalences were calculated in the three subgroups and euthyroid group.
- As shown in Fig. 2, the prevalence of overall and stage 2 hypertension remarkably increased with elevated serum TSH, subsequently from the euthyroid group to the SCH1, SCH2, and SCH3 subgroups (P for trend <0.001). Compared with the prevalence in the euthyroid group, overall and both stages of hypertension prevalence were significantly higher in the SCH1 subgroup; furthermore, overall and stage 2 prevalence of hypertension was also significantly higher in the SCH2 and SCH3 subgroups, respectively.
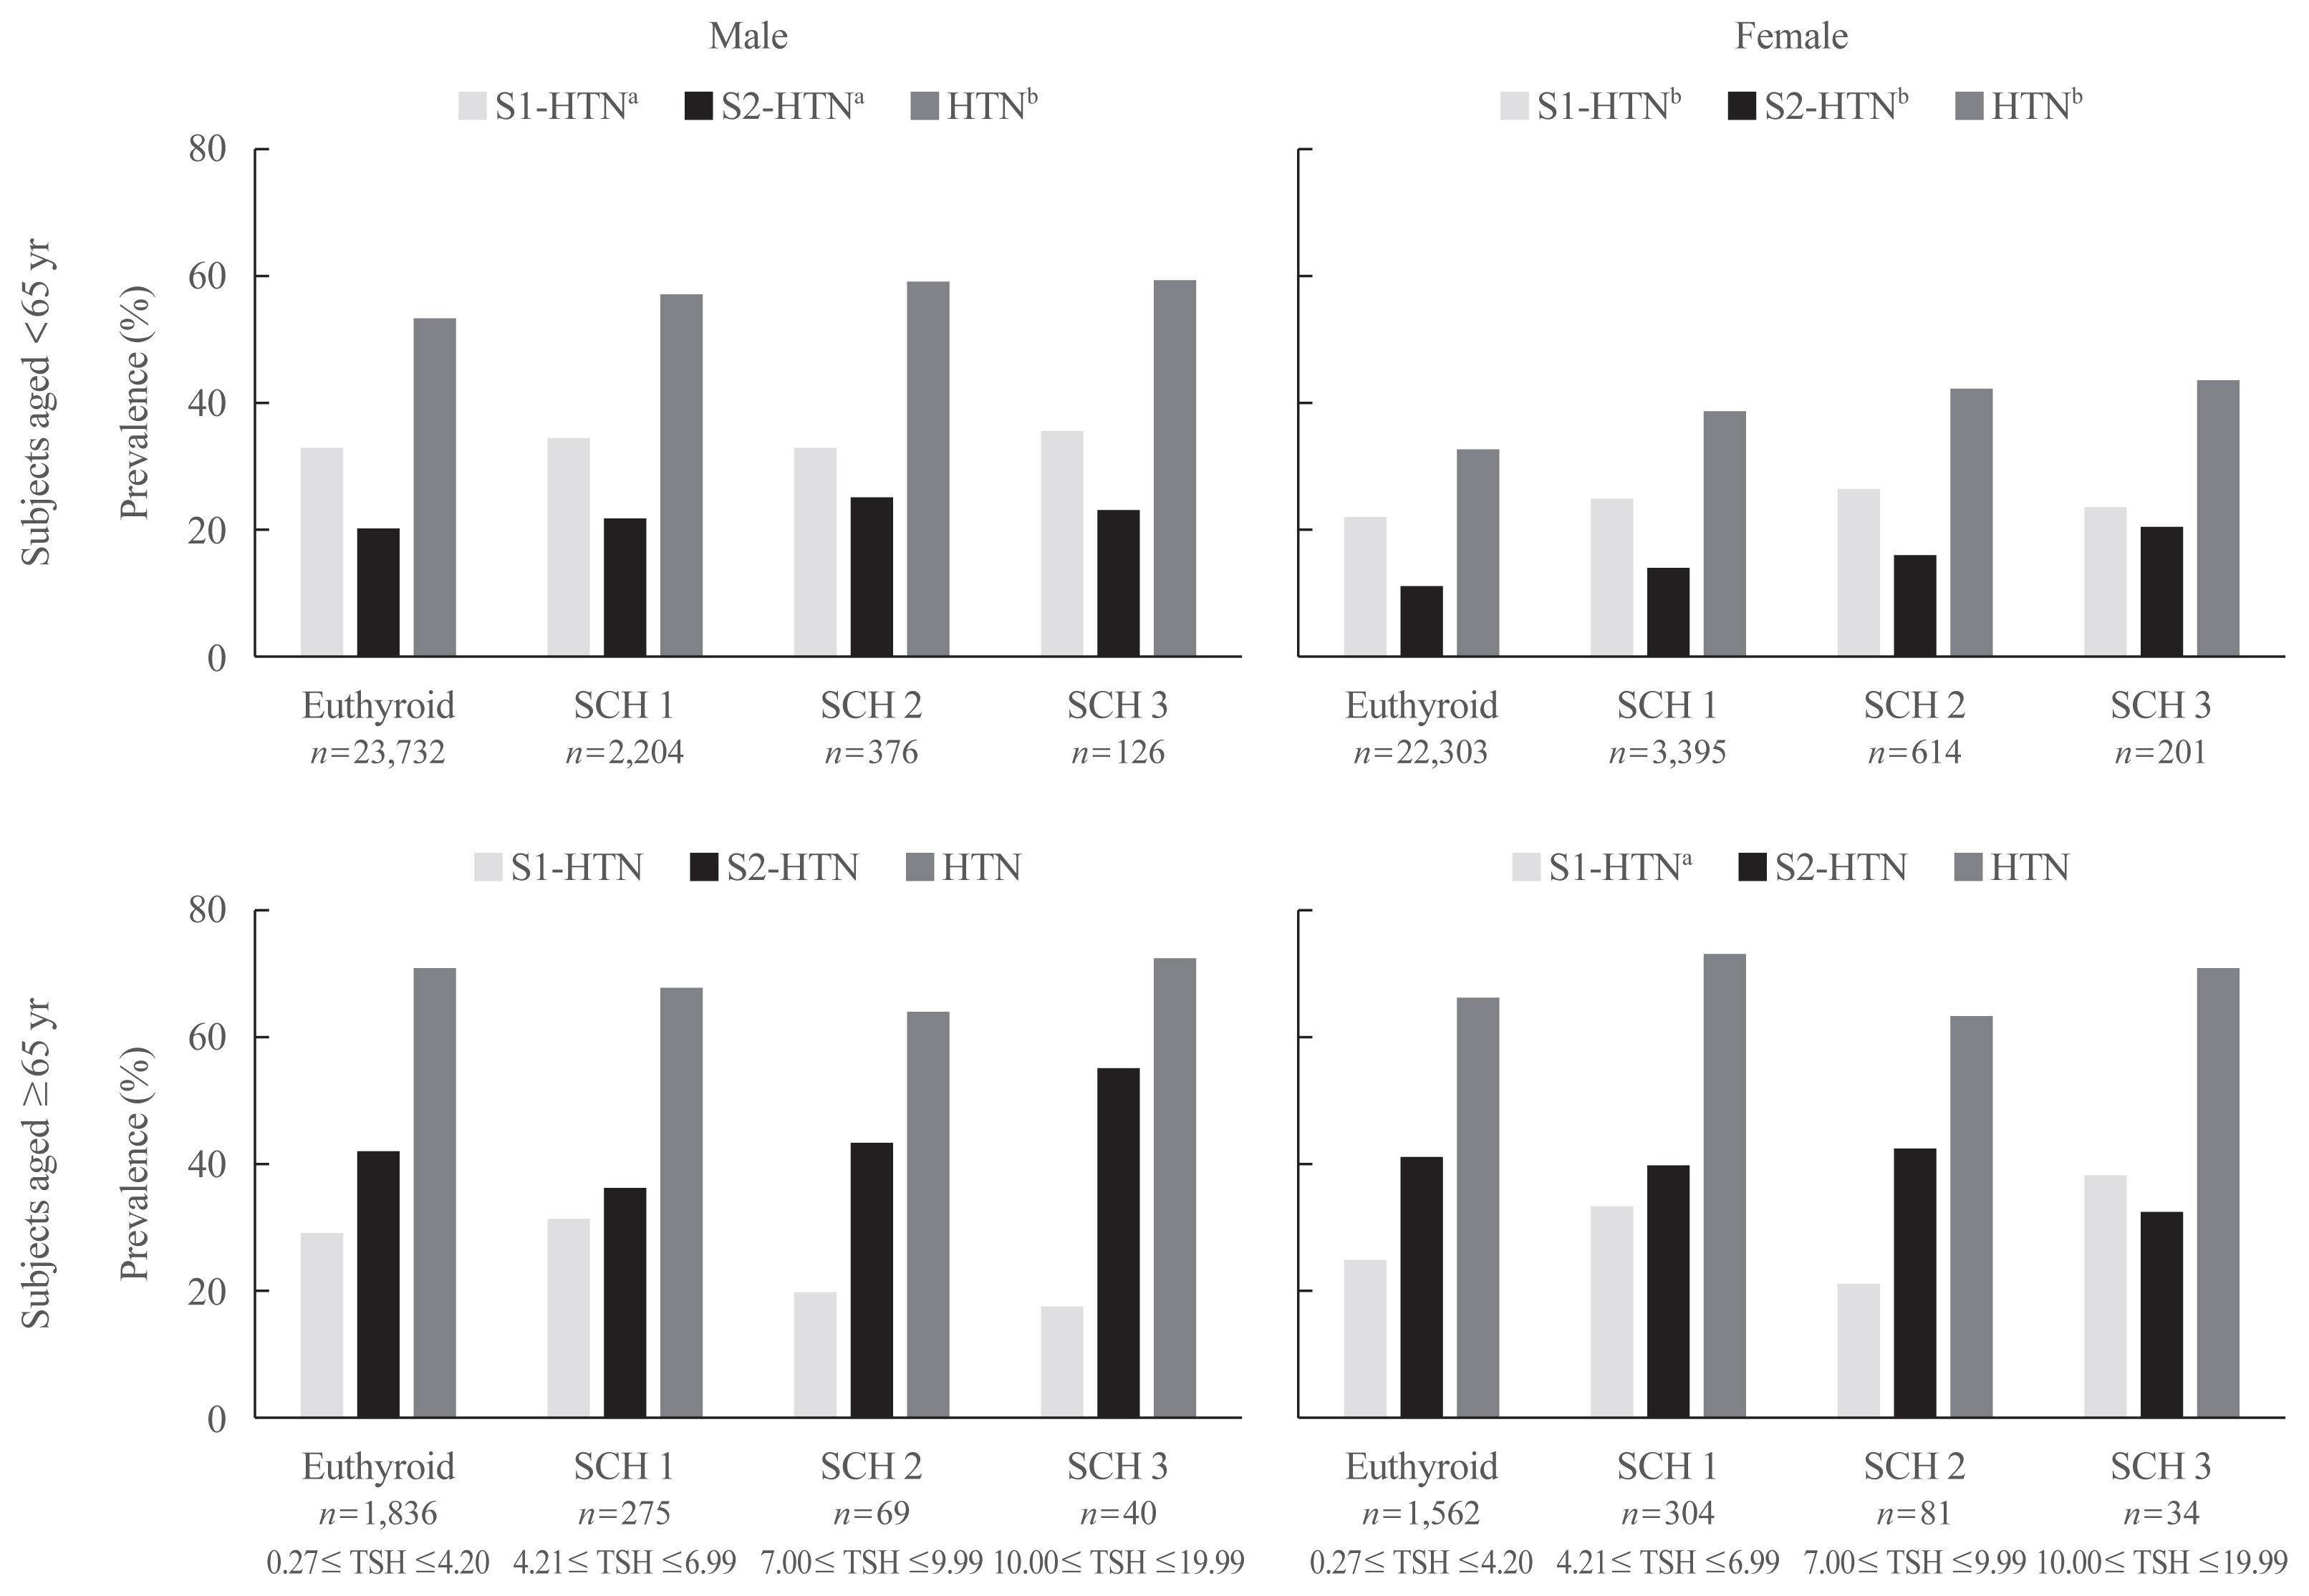
- Age and sex stratified prevalence of hypertension in different SCH subgroups
- Several previous studies have found that SCH patients over 65 are less susceptible to adverse cardiovascular events than younger patients [17,22–24], and levothyroxine treatment does not help SCH patients over 65 years old [25]. Therefore, we divided the 57,152 subjects into two groups with a cutoff age of 65.
- As shown in Fig. 3, the age- and sex-specific prevalence of overall, stage 1 and 2 hypertension was calculated in the euthyroid group and each SCH subgroup. For individuals aged less than 65 years old, overall and both stages of hypertension prevalence showed an increasing tendency with increased TSH both in males and females (P for trend <0.05). However, we did not find a similar trend in subjects aged ≥65 years from the euthyroid to SCH3 subgroups.
- Stratified regression analysis between SCH and hypertension prevalence
- As shown in Table 4, the results of the regression analysis are displayed among subjects of different ages and sexes. The results showed a much stronger relationship among subjects aged less than 65, namely, SCH was positively associated with the prevalence of overall and stage 1 hypertension. Furthermore, after adjusting for confounding factors of hypertension, SCH showed positive associations with all hypertension prevalences among female subjects aged less than 65.
- However, hypertension prevalence was not significantly related with SCH in male subjects aged ≥65. SCH was only positively associated with stage 1 hypertension in female subjects aged ≥65 (P<0.01).
- Association between elevated TSH and BP components
- In the subsequent regression analysis, two models were used: model 1 analyzed the association between TSH level and BP components without adjusting for confounding factors, and model 2 included age, sex, education level, residence, smoking frequency, daily salt intake, diabetes, and BMI as adjusted factors.
- Table 5 shows the variation of all BP components with each unit (mU/L) elevation of serum TSH within the range 0.27 to 19.99 mU/L. The levels of SBP, DBP, and MAP significantly increased with per unit increase in TSH among all subjects (P<0.01). However, PP showed no relationship with serum TSH level. The results were reasonably similar in both model 1 and model 2.
- Stratified regression analysis between SCH and BP components
- As shown in Table 4, the results of the regression analysis are displayed among subjects of different ages and sexes. SCH was positively associated with the value of DBP and MAP among male subjects aged less than 65 after adjusting for several confounding factors in model 2. However, after adjusting for confounding factors, SCH showed positive associations with all listed BP components in female subjects aged less than 65. None of the BP components was significantly related with SCH in male subjects aged ≥65. SCH was only positively associated with the DBP level among female subjects aged ≥65.
- Additional analysis in the propensity matched population
- Although the above results suggest that the association between SCH and BP is more significant in females younger than 65 years old, we need to consider the impact of baseline heterogeneity on the results. As shown in Table 2, all variables listed in the table show statistical differences. Although we adjusted the confounding factors related to hypertension in the subsequent regression analysis, 1:1 PSM was required to further minimize the influence of factors such as residence, education level, and smoking frequency, etc. As shown in Supplemental Table S1, 20,714 subjects were respectively included in the non-hypertension group and the hypertension group after 1:1 PSM. The baseline heterogeneity between the two groups was obviously reduced with PSM, and most of the risk factors for hypertension no longer showed statistical differences. However, the prevalence of diabetes, BMI, and waist circumference still showed significant statistical differences (P<0.05) (Supplemental Table S1).
- Similarly, we performed an age and sex-specific regression analysis among the matched subjects (Supplemental Table S2). Given that the diabetes prevalence and BMI still showed significance between the hypertensive and non-hypertensive subjects after matching, diabetes and BMI were hereby considered as adjusted variables. The results of the regression analysis in matching population were similar to those in the general population. The results of younger groups were generally more significant, and the associations in females were generally more significant than in males. After adjusting for multiple variables, SCH could be regarded as an independent risk factor for hypertension in both males and females younger than 65 (P<0.01), especially the association with stage 2 hypertension (P<0.01). However, among subjects aged ≥65, SCH was merely significantly associated with stage 1 hypertension in females, rather than males. The correlation of BP components had a similar trend. In females <65, SCH was an independent risk factor for all listed BP components (i.e., SBP, DBP, PP, MAP) (P<0.05). However, among elderly male subjects, there was no significant correlation between SCH and any BP indicators listed in Supplemental Table S2.
RESULTS
- In this cross-sectional study, we found that the mean TSH level of hypertensive individuals was higher than that of the non-hypertension group. When compared with euthyroid controls, hypertension prevalence and BP components (SBP, DBP, PP, MAP) were all significantly higher in the SCH group. The prevalence of hypertension and the levels of SBP, DBP, and MAP showed positive associations with TSH level among general subjects. Stratified regression analysis showed that SCH may be a risk factor of elevated hypertension prevalence or BP components, which was the most apparent in females younger than 65 years old.
- Cai et al. [26] recently analyzed the association between thyroid function and several hypertension subtypes in a cross-sectional study. They found that individuals with ambulatory hypertension tended to have higher serum TSH levels than ambulatory normotensive individuals, and the serum TSH level was also higher in the clinic hypertensive group than the clinic normotensive group [26]. Another cross-sectional study conducted in India demonstrated that hypertensive patients showed a significantly higher mean TSH compared with overall individuals [27]. The results of the above studies are similar to our current results. However, because these were all cross-sectional studies, the causal relationship between hypertension and serum TSH concentration cannot yet be explained.
- The prevalence of overall and stage 1 and 2 hypertension was significantly higher in the SCH group than in the euthyroid control group in the present study, and the result was similar to previous studies [28,29]. However, there are still some discrepancies between SCH and hypertension prevalence. In a case-control study with 240 SCH patients and 480 controls in Spain, no significant differences were found in hypertension prevalence between the two groups [30]. Liu et al. [31] conducted a similar cross-sectional study involving 6,998 adults, and the prevalence of hypertension did not reach statistical significance between the euthyroid and SCH groups after adjusting for age.
- Of note, if we stratify by age and sex, we found that the association between SCH and hypertension was related to age and sex. SCH showed a significant correlation with hypertension in another cross-sectional study involving 1,226 euthyroid subjects and 93 SCH patients, and the relationship was similarly more remarkable in females [10]. Likewise, other relevant investigations also verified a more profound relationship between SCH and hypertension risk among female subjects [32,33]. However, in another sex-specific analysis conducted by Mehran et al. [34], neither females nor males showed a significant association between SCH and hypertension. Our regression analysis of 49,433 euthyroid individuals and 7,719 SCH patients confirmed that SCH patients who were females or aged <65 were more likely to have hypertension. Furthermore, the stratified regression analysis after 1:1 PSM also confirmed the results. It is well known that aging is a predominant risk factor for hypertension and other cardiovascular events. It has been found that hypertension prevalence could jump from 48% in populations aged 55 to 64 to 62% in populations aged 65 to 74 [35]. Fig. 3 reveals that hypertension prevalence is much higher in older subjects, and there are almost no differences among subgroups with different TSH levels. We infer that the BP-increasing effect mediated by SCH gradually becomes less predominant upon aging. In addition, the reference range of TSH increases significantly with age. We found in the TIDE study that the 97.5th percentile of TSH in the reference population increased by 0.534 mU/L for every 10-year increase in age [36]. Therefore, the prevalence of SCH in older group might be overestimated merely with manufacturer reference range, which might affect the true association between SCH and hypertension or BP components in subjects aged ≥65.
- Regarding the relationship between SCH and BP components, previous studies failed to reach a completely identical conclusion, some of which drew similar conclusions to our present study. Two meta-analyses summarized the weighted mean differences of SBP and DBP between the SCH and euthyroid groups and found that both SBP and DBP were significantly higher in the former group [37,38]. However, the authors did not group the subjects by different sexes, ages or TSH levels, which remains to be further investigated. Ye et al. [39] also observed increased SBP in the SCH group by meta-analysis. The authors considered that the significant difference in age between the euthyroid and SCH groups might explain the difference of SBP between the two groups [39]. In our study, we also compared several BP components between the euthyroid and SCH groups and found similar trends. Furthermore, the association between SCH and BP components was more profound for females or subjects aged <65. Similar to our present study, the sex-specific alterations of BP components (SBP, DBP, and PP) with SCH were also analyzed by Asvold et al. [32]. They found that both grades of SCH (TSH 3.6 to 9.9 mU/L and TSH ≥10 mU/L) were independently associated with SBP, DBP, and PP in females. Unlike our conclusions, the increase of BP components with TSH elevation within the reference interval (0.5 to 3.5 mU/L) was the most profound in subjects aged 50 to 69 in both sexes. We speculate that the contradiction may be due to differences in the inclusion criteria, as not all included subjects were tested for thyroid function in the previous study.
- According to our results, the values of SBP, DBP, and MAP increased significantly with per unit elevation of TSH. Ittermann et al. [40] pooled 17,023 subjects for a cross-sectional study from several previous studies, concluding that baseline high TSH level was associated with current increase of SBP and DBP, which resembles our present results. However, pooled longitudinal studies showed no significant association between TSH and 5-year changes in the incidence of hypertension or BP components [40]. Zhang et al. [33] also analyzed the sex-specific variation of SBP and DBP with TSH levels and found that females were more likely to have higher and more significant correlations than males. Similarly, TSH elevation was significantly associated with SBP, also particularly among females in a cross-sectional study in the Netherlands, while none of the regression coefficients reached significance among males [41]. Unlike our findings and the above studies, Kus et al. [42] recently analyzed the effects of TSH variation on BP among over 750,000 participants with Mendelian randomization, and the meta-analysis showed a significant negative association between TSH and PP, while SBP and DBP were not significantly altered by genetically-driven TSH variation. In addition, our study found for the first time that TSH is an independent risk factor for increased MAP, a conclusion that requires more research to verify in the future.
- The strengths of our study are as follows. Firstly, this study is currently the largest one on SCH and BP, and we analyzed patients with newly diagnosed SCH and hypertension. Secondly, we performed a stratified analysis of age and sex, which makes a novel contribution to the field of knowledge. However, there are still some limitations in our study. It was not possible to infer temporal or causal relationships between TSH and BP due to the characteristics of the cross-sectional study. Due to the unique limitations of epidemiological investigations, we have not been able to measure BP on different dates to confirm the diagnosis of newly-diagnosed hypertension. Similarly, the diagnosis of SCH was affected by the same reasons; thus, the level of TSH could not be rechecked within 1 month.
- In conclusion, the prevalence of hypertension and the levels of SBP, DBP, and MAP are positively correlated with TSH. The relationships are more apparent in females than in males, and the statistical significance was more profound in subjects aged <65.
DISCUSSION
- Comparisons of Characteristics between Nonhypertensive and Hypertensive Subjects in the Propensity Matched Population
- Stratified Relationships between SCH and Blood Pressure Parameters in the Propensity Matched Population
Supplementary Information
Supplemental Table S1.
Supplemental Table S2.
-
CONFLICTS OF INTEREST
No potential conflict of interest relevant to this article was reported.
-
AUTHOR CONTRIBUTIONS
Conception or design: W.T., Z.S. Analysis or interpretation of data: X.W., H.W., L.Y., L.Y., Y.X., J.Y., Y.Y., X.T., N.T., G.W., J.Z., Y.W., J.B., B.C., J.D., L.H., X.L., Y.L., Z.Y., E.L., C.L., L.L., G.Q., Y.Q., H.Q., B.S., H.S., Z.Y., Q.Z., L.Z., J.Z., M.Z., Y.L., W.T., Z.S. Drafting the work or revising: X.W., Y.L., W.T., Z.S. Final approval of the manuscript: W.T., Z.S.
Article information
-
Acknowledgements
- This study was funded by the Research Fund for Public Welfare, National Health and Family Planning Commission of China (Grant No. 201402005) and the Clinical Research Fund of Chinese Medical Association (Grant No. 15010010589).


Values are expressed as number (%) or mean±standard deviation.
SCH, subclinical hypothyroidism; TSH, thyroid stimulating hormone; BMI, body mass index; SBP, systolic blood pressure; DBP, diastolic blood pressure; PP, pulse pressure; MAP, mean arterial pressure; HTN, hypertension; S1-HTN, stage 1 hypertension; S2-HTN, stage 2 hypertension.
| Number | HTN | S1-HTN | S2-HTN | SBP | DBP | PP | MAP | |
|---|---|---|---|---|---|---|---|---|
| Male subjects aged <65 yr | ||||||||
| Euthyroid | 23,732 | Reference | Reference | Reference | Reference | Reference | Reference | Reference |
| SCH Model 1 | 2,706 | 1.185 (1.093–1.284)a | 1.108 (1.019–1.204)b | 1.119 (1.017–1.231)b | 0.74±0.30b | 0.86±0.23a | −0.12±0.24 | 0.82±0.23a |
| SCH Model 2 | 2,706 | 1.138 (1.046–1.237)a | 1.090 (1.002–1.186)b | 1.063 (0.963–1.174) | 0.27±0.29 | 0.64±0.22a | −0.37±0.24 | 0.52±0.22b |
|
|
||||||||
| Female subjects aged <65 yr | ||||||||
| Euthyroid | 22,303 | Reference | Reference | Reference | Reference | Reference | Reference | Reference |
| SCH Model 1 | 4,210 | 1.307 (1.221–1.399)a | 1.159 (1.074–1.252)a | 1.381 (1.254–1.521)a | 2.33±0.26a | 1.42±0.17a | 0.91±0.20a | 1.73±0.18a |
| SCH Model 2 | 4,210 | 1.213 (1.130–1.303)a | 1.103 (1.021–1.192)b | 1.261 (1.140–1.394)a | 1.44±0.24a | 1.02±0.16a | 0.42±0.19b | 1.16±0.17a |
|
|
||||||||
| Male subjects aged ≥65 yr | ||||||||
| Euthyroid | 1,836 | Reference | Reference | Reference | Reference | Reference | Reference | Reference |
| SCH Model 1 | 384 | 0.842 (0.665–1.067) | 0.944 (0.740–1.205) | 0.903 (0.721–1.130) | −0.89±1.07 | 0.39±0.68 | −1.28±0.91 | −0.04±0.71 |
| SCH Model 2 | 384 | 0.787 (0.618–1.003) | 0.941 (0.735–1.203) | 0.859 (0.683–1.079) | −1.43±1.06 | 0.16±0.67a | −1.59±0.91 | −0.37±0.70 |
|
|
||||||||
| Female subjects aged ≥65 yr | ||||||||
| Euthyroid | 1,562 | Reference | Reference | Reference | Reference | Reference | Reference | Reference |
| SCH Model 1 | 419 | 1.254 (0.991–1.586) | 1.382 (1.092–1.750)a | 0.933 (0.749–1.163) | −0.16±1.06 | 1.55±0.66b | −1.71±0.93 | 0.98±0.69 |
| SCH Model 2 | 419 | 1.270 (0.999–1.615) | 1.394 (1.100–1.766)a | 0.931 (0.743–1.165) | −0.09±1.05 | 1.55±0.65b | −1.65±0.93 | 1.01±0.67 |
Values are expressed as odds ratio (95% confidence interval) or linear regression coefficient±standard deviation. Model 1: crude; Model 2: adjusted for education level, residence, smoking frequency, daily salt intake, body mass index, and diabetes.
SCH, subclinical hypothyroidism; HTN, hypertension; S1-HTN, stage 1 hypertension; S2-HTN, stage 2 hypertension; SBP, systolic blood pressure; DBP, diastolic blood pressure; PP, pulse pressure; MAP, mean arterial pressure.
a P<0.01;
b P<0.05.
| SBP, mm Hg | DBP, mm Hg | PP, mm Hg | MAP, mm Hg | |
|---|---|---|---|---|
| Model 1 | 0.19±0.40a | 0.17±0.03a | 0.02±0.03 | 0.18±0.03a |
| Model 2 | 0.15±0.04a | 0.20±0.03a | −0.05±0.03 | 0.18±0.03a |
Values are expressed as mean±standard deviation. Model 1: crude; Model 2: adjusted for sex, age, education level, residence, smoking frequency, daily salt intake, body mass index, and diabetes.
SBP, systolic blood pressure; DBP, diastolic blood pressure; PP, pulse pressure; MAP, mean arterial pressure.
a P<0.01.
- 1. Williams B, Mancia G, Spiering W, Agabiti Rosei E, Azizi M, Burnier M, et al. 2018 Practice guidelines for the management of arterial hypertension of the European Society of Cardiology and the European Society of Hypertension. Blood Press 2018;27:314–40.ArticlePubMed
- 2. GBD 2016 Causes of Death Collaborators. Global, regional, and national age-sex specific mortality for 264 causes of death, 1980–2016: a systematic analysis for the Global Burden of Disease Study 2016. Lancet 2017;390:1151–210.PubMedPMC
- 3. GBD 2013 Mortality and Causes of Death Collaborators. Global, regional, and national age-sex specific all-cause and cause-specific mortality for 240 causes of death, 1990–2013: a systematic analysis for the Global Burden of Disease Study 2013. Lancet 2015;385:117–71.ArticlePubMed
- 4. Banegas JR, Ruilope LM, de la Sierra A, Vinyoles E, Gorostidi M, de la Cruz JJ, et al. Relationship between clinic and ambulatory blood-pressure measurements and mortality. N Engl J Med 2018;378:1509–20.ArticlePubMed
- 5. Wang Z, Chen Z, Zhang L, Wang X, Hao G, Zhang Z, et al. Status of hypertension in China: results from the China Hypertension Survey, 2012–2015. Circulation 2018;137:2344–56.ArticlePubMed
- 6. Jabbar A, Pingitore A, Pearce SH, Zaman A, Iervasi G, Razvi S. Thyroid hormones and cardiovascular disease. Nat Rev Cardiol 2017;14:39–55.ArticlePubMed
- 7. Hennessey JV, Espaillat R. Subclinical hypothyroidism: a historical view and shifting prevalence. Int J Clin Pract 2015;69:771–82.ArticlePubMedPMC
- 8. Li Y, Teng D, Ba J, Chen B, Du J, He L, et al. Efficacy and safety of long-term universal salt iodization on thyroid disorders: epidemiological evidence from 31 provinces of mainland China. Thyroid 2020;30:568–79.ArticlePubMed
- 9. Chen H, Xi Q, Zhang H, Song B, Liu X, Mao X, et al. Investigation of thyroid function and blood pressure in school-aged subjects without overt thyroid disease. Endocrine 2012;41:122–9.ArticlePubMed
- 10. Liu D, Jiang F, Shan Z, Wang B, Wang J, Lai Y, et al. A cross-sectional survey of relationship between serum TSH level and blood pressure. J Hum Hypertens 2010;24:134–8.ArticlePubMed
- 11. Walsh JP, Bremner AP, Bulsara MK, O’Leary P, Leedman PJ, Feddema P, et al. Subclinical thyroid dysfunction and blood pressure: a community-based study. Clin Endocrinol (Oxf) 2006;65:486–91.ArticlePubMed
- 12. Luboshitzky R, Aviv A, Herer P, Lavie L. Risk factors for cardiovascular disease in women with subclinical hypothyroidism. Thyroid 2002;12:421–5.ArticlePubMed
- 13. Takashima N, Niwa Y, Mannami T, Tomoike H, Iwai N. Characterization of subclinical thyroid dysfunction from cardiovascular and metabolic viewpoints: the Suita study. Circ J 2007;71:191–5.ArticlePubMed
- 14. Li Y, Teng D, Shi X, Qin G, Qin Y, Quan H, et al. Prevalence of diabetes recorded in mainland China using 2018 diagnostic criteria from the American Diabetes Association: national cross sectional study. BMJ 2020;369:m997.ArticlePubMedPMC
- 15. Whelton PK, Carey RM, Aronow WS, Casey DE Jr, Collins KJ, Dennison Himmelfarb C, et al. 2017 ACC/AHA/AAPA/ABC/ACPM/AGS/APhA/ASH/ASPC/NMA/PCNA guideline for the prevention, detection, evaluation, and management of high blood pressure in adults: a report of the American College of Cardiology/American Heart Association Task Force on Clinical Practice Guidelines. J Am Coll Cardiol 2018;71:e127–248.PubMed
- 16. Biondi B, Cappola AR, Cooper DS. Subclinical hypothyroidism: a review. JAMA 2019;322:153–60.ArticlePubMed
- 17. Chaker L, Baumgartner C, den Elzen WP, Ikram MA, Blum MR, Collet TH, et al. Subclinical hypothyroidism and the risk of stroke events and fatal stroke: an individual participant data analysis. J Clin Endocrinol Metab 2015;100:2181–91.ArticlePubMedPMC
- 18. Gencer B, Collet TH, Virgini V, Bauer DC, Gussekloo J, Cappola AR, et al. Subclinical thyroid dysfunction and the risk of heart failure events: an individual participant data analysis from 6 prospective cohorts. Circulation 2012;126:1040–9.ArticlePubMed
- 19. Rodondi N, den Elzen WP, Bauer DC, Cappola AR, Razvi S, Walsh JP, et al. Subclinical hypothyroidism and the risk of coronary heart disease and mortality. JAMA 2010;304:1365–74.ArticlePubMedPMC
- 20. Floriani C, Gencer B, Collet TH, Rodondi N. Subclinical thyroid dysfunction and cardiovascular diseases: 2016 update. Eur Heart J 2018;39:503–7.ArticlePubMed
- 21. Pearce SH, Brabant G, Duntas LH, Monzani F, Peeters RP, Razvi S, et al. 2013 ETA guideline: management of subclinical hypothyroidism. Eur Thyroid J 2013;2:215–28.ArticlePubMedPMC
- 22. Moon S, Kim MJ, Yu JM, Yoo HJ, Park YJ. Subclinical hypothyroidism and the risk of cardiovascular disease and all-cause mortality: a meta-analysis of prospective cohort studies. Thyroid 2018;28:1101–10.ArticlePubMed
- 23. Garin MC, Arnold AM, Lee JS, Tracy RP, Cappola AR. Subclinical hypothyroidism, weight change, and body composition in the elderly: the Cardiovascular Health Study. J Clin Endocrinol Metab 2014;99:1220–6.ArticlePubMedPMC
- 24. Cappola AR, Fried LP, Arnold AM, Danese MD, Kuller LH, Burke GL, et al. Thyroid status, cardiovascular risk, and mortality in older adults. JAMA 2006;295:1033–41.ArticlePubMedPMC
- 25. Stott DJ, Rodondi N, Kearney PM, Ford I, Westendorp RG, Mooijaart SP, et al. Thyroid hormone therapy for older adults with subclinical hypothyroidism. N Engl J Med 2017;376:2534–44.PubMed
- 26. Cai P, Peng Y, Chen Y, Li L, Chu W, Wang Y, et al. Association of thyroid function with white coat hypertension and sustained hypertension. J Clin Hypertens (Greenwich) 2019;21:674–83.ArticlePubMedPMC
- 27. Talwalkar P, Deshmukh V, Bhole M. Prevalence of hypothyroidism in patients with type 2 diabetes mellitus and hypertension in India: a cross-sectional observational study. Diabetes Metab Syndr Obes 2019;12:369–76.PubMedPMC
- 28. Lee MK, Kim YM, Sohn SY, Lee JH, Won YJ, Kim SH. Evaluation of the relationship of subclinical hypothyroidism with metabolic syndrome and its components in adolescents: a population-based study. Endocrine 2019;65:608–15.ArticlePubMed
- 29. Tseng FY, Lin WY, Lin CC, Lee LT, Li TC, Sung PK, et al. Subclinical hypothyroidism is associated with increased risk for all-cause and cardiovascular mortality in adults. J Am Coll Cardiol 2012;60:730–7.ArticlePubMed
- 30. Gonzalez Gil L, de la Sierra A. Prevalence of hypertension and other cardiovascular risk factors in subjects with subclinical hypothyroidism. Med Clin (Barc) 2017;148:351–3.ArticlePubMed
- 31. Liu C, Scherbaum WA, Schott M, Schinner S. Subclinical hypothyroidism and the prevalence of the metabolic syndrome. Horm Metab Res 2011;43:417–21.ArticlePubMed
- 32. Asvold BO, Bjoro T, Nilsen TI, Vatten LJ. Association between blood pressure and serum thyroid-stimulating hormone concentration within the reference range: a population-based study. J Clin Endocrinol Metab 2007;92:841–5.ArticlePubMed
- 33. Zhang J, Huang C, Meng Z, Fan Y, Yang Q, Zhang W, et al. Gender-specific differences on the association of hypertension with subclinical thyroid dysfunction. Int J Endocrinol 2019;2019:6053068.ArticlePubMedPMC
- 34. Mehran L, Amouzegar A, Rahimabad PK, Tohidi M, Tahmasebinejad Z, Azizi F. Thyroid function and metabolic syndrome: a population-based thyroid study. Horm Metab Res 2017;49:192–200.ArticlePubMed
- 35. Wu J, Li T, Song X, Sun W, Zhang Y, Liu Y, et al. Prevalence and distribution of hypertension and related risk factors in Jilin Province, China 2015: a cross-sectional study. BMJ Open 2018;8:e020126.ArticlePubMedPMC
- 36. Zhao L, Teng D, Shi X, Li Y, Ba J, Chen B, et al. The effect of increased iodine intake on serum thyrotropin: a cross-sectional, Chinese nationwide study. Thyroid 2020;30:1810–9.ArticlePubMed
- 37. Cai Y, Ren Y, Shi J. Blood pressure levels in patients with subclinical thyroid dysfunction: a meta-analysis of cross-sectional data. Hypertens Res 2011;34:1098–105.ArticlePubMed
- 38. Gong N, Gao C, Chen X, Fang Y, Tian L. Endothelial function in patients with subclinical hypothyroidism: a meta-analysis. Horm Metab Res 2019;51:691–702.ArticlePubMed
- 39. Ye Y, Xie H, Zeng Y, Zhao X, Tian Z, Zhang S. Association between subclinical hypothyroidism and blood pressure: a meta-analysis of observational studies. Endocr Pract 2014;20:150–8.ArticlePubMed
- 40. Ittermann T, Tiller D, Meisinger C, Agger C, Nauck M, Rettig R, et al. High serum thyrotropin levels are associated with current but not with incident hypertension. Thyroid 2013;23:955–63.ArticlePubMedPMC
- 41. Wolffenbuttel BH, Wouters HJ, Slagter SN, van Waateringe RP, Muller Kobold AC, van Vliet-Ostaptchouk JV, et al. Thyroid function and metabolic syndrome in the population-based LifeLines cohort study. BMC Endocr Disord 2017;17:65.ArticlePubMedPMC
- 42. Kus A, Marouli E, Del Greco MF, Chaker L, Bednarczuk T, Peeters RP, et al. Variation in normal range thyroid function affects serum cholesterol levels, blood pressure, and type 2 diabetes risk: a mendelian randomization study. Thyroid 2021;31:721–31.ArticlePubMed
References
Figure & Data
References
Citations
- Systematic review and meta-analysis of levothyroxine effect on blood pressure in patients with subclinical hypothyroidism
Bahar Darouei, Reza Amani-Beni, Amir Parsa Abhari, Mohammad Fakhrolmobasheri, Davood Shafie, Maryam Heidarpour
Current Problems in Cardiology.2024; 49(2): 102204. CrossRef - Gender-Specific Associations Between Metabolic Disorders and Thyroid Nodules: A Cross-Sectional Population-Based Study from China
Fan Zhang, Di Teng, Nanwei Tong, Guixia Wang, Yongze Li, Xiaohui Yu, Zhongyan Shan, Weiping Teng
Thyroid.2022; 32(5): 571. CrossRef - Effect of Levothyroxine Supplementation on the Cardiac Morphology and Function in Patients With Subclinical Hypothyroidism: A Systematic Review and Meta-analysis
Xichang Wang, Haoyu Wang, Qiuxian Li, Ping Wang, Yumin Xing, Fan Zhang, Jiashu Li, Zhongyan Shan
The Journal of Clinical Endocrinology & Metabolism.2022; 107(9): 2674. CrossRef
 PubReader
 ePub Link
 Cite
Cite