Articles
- Page Path
- HOME > Endocrinol Metab > Volume 35(4); 2020 > Article
-
Original ArticleClinical Study Insulin Secretion and Insulin Resistance Trajectories over 1 Year after Kidney Transplantation: A Multicenter Prospective Cohort Study
-
Jun Bae Bang1
 , Chang-Kwon Oh1, Yu Seun Kim2, Sung Hoon Kim3, Hee Chul Yu4, Chan-Duck Kim5, Man Ki Ju6, Byung Jun So7, Sang Ho Lee8, Sang Youb Han9, Cheol Woong Jung10, Joong Kyung Kim11, Su Hyung Lee1, Ja Young Jeon12
 -
Endocrinology and Metabolism 2020;35(4):820-829.
DOI: https://doi.org/10.3803/EnM.2020.743
Published online: November 18, 2020
1Department of Surgery, Ajou University School of Medicine, Suwon, Seoul, Korea
2Department of Transplantation Surgery and Research Institute for Transplantation, Yonsei University College of Medicine, Seoul, Korea
3Department of Surgery, Wonju Severance Christian Hospital, Yonsei University Wonju College of Medicine, Wonju, Seoul, Korea
4Department of Surgery, Jeonbuk National University Medical School, Jeonju, Seoul, Korea
5Department of Internal Medicine, Kyungpook National University Hospital, School of Medicine, Kyungpook National University, Daegu, Seoul, Korea
6Department of Surgery, Yonsei University College of Medicine, Seoul, Korea
7Department of Surgery, Wonkwang University Hospital, Iksan, Seoul, Korea
8Department of Internal Medicine, Kyung Hee University School of Medicine, Seoul, Korea
9Department of Internal Medicine, Inje University Ilsan Paik Hospital, Goyang, Seoul, Korea
10Department of Surgery, Korea University College of Medicine, Seoul, Korea
11Department of Internal Medicine, Bong Seng Memorial Hospital, Busan, Korea
12Department of Endocrinology and Metabolism, Ajou University School of Medicine, Suwon, Korea
- Corresponding authors: Ja Young Jeon. Department of Endocrinology and Metabolism, Ajou University School of Medicine, 164 World cup-ro, Yeongtong-gu, Suwon 16499, Korea, Tel: +82-31-219-7459, Fax: +82-31-219-4497, E-mail: twinstwins@hanmail.net
- Su Hyung Lee. Department of Surgery, Ajou University School of Medicine, 164 World cup-ro, Yeongtong-gu, Suwon 16499, Korea, Tel: +82-31-219-5760, Fax: +82-31-219-4438, E-mail: dltngudgs@aumc.ac.kr
Copyright © 2020 Korean Endocrine Society
This is an Open Access article distributed under the terms of the Creative Commons Attribution Non-Commercial License (https://creativecommons.org/licenses/by-nc/4.0/) which permits unrestricted non-commercial use, distribution, and reproduction in any medium, provided the original work is properly cited.
ABSTRACT
-
Background
- We investigated the changing patterns of insulin secretion and resistance and risk factors contributing to the development of post-transplant diabetes mellitus (PTDM) in kidney recipients under tacrolimus-based immunosuppression regimen during 1 year after transplantation.
-
Methods
- This was a multicenter prospective cohort study. Of the 168 subjects enrolled in this study, we analyzed a total 87 kidney transplant recipients without diabetes which was assessed by oral glucose tolerance test before transplantation. We evaluated the incidence of PTDM and followed up the index of insulin secretion (insulinogenic index [IGI]) and resistance (homeostatic model assessment for insulin resistance [HOMA-IR]) at 3, 6, 9 months, and 1 year after transplantation by oral glucose tolerance test and diabetes treatment. We also assessed the risk factors for incident PTDM.
-
Results
- PTDM developed in 23 of 87 subjects (26.4%) during 1 year after transplantation. More than half of total PTDM (56.5%) occurred in the first 3 months after transplantation. During 1 year after transplantation, insulin resistance (HOMA-IR) was increased in both PTDM and no PTDM group. In no PTDM group, the increase in insulin secretory function to overcome insulin resistance was also observed. However, PTDM group showed no increase in insulin secretion function (IGI). Old age, status of prediabetes and episode of acute rejection were significantly associated with the development of PTDM.
-
Conclusion
- In tacrolimus-based immunosuppressive drugs regimen, impaired insulin secretory function for reduced insulin sensitivity contributed to the development of PTDM than insulin resistance during 1 year after transplantation.
- Post-transplant diabetes mellitus (PTDM), a common metabolic complication that occurs during the post-transplantation period, is associated with opportunistic infections, cardiovascular disease, and graft failure and poor survival in kidney transplant recipients [1–5]. The incidence of PTDM after kidney transplantation ranges from 10% to 40%; recent cohort studies have shown that the 1-year incidence of PTDM is 10% to 15% in Asian populations [6,7]. High doses of immunosuppressive agents are administered to recipients in the early post-transplantation period, resulting in a high incidence of PTDM within the first 6 months after transplantation. After 6 months, the dose and level of immunosuppressive agents are stabilized and the incidence of PTDM decreases to levels similar to those of non-transplant patients [8].
- The oral glucose tolerance test (OGTT) is the gold standard test for diabetes; it is more accurate than fasting plasma glucose for the diagnosis of PTDM and types 1 and 2 diabetes [9,10]. However, the OGTT is not routinely performed in transplant recipients because the test is not readily accessible in most transplantation settings. Shabir et al. [11] suggested that the hemoglobin A1c test could replace the OGTT as a diagnostic test for PTDM in the early post-transplantation period; however, their study sample size was relatively small. Despite difficulties in test administration, the OGTT remains an important tool for the detection of PTDM. The recommended timing for the diagnosis of PTDM is at least 45 days after transplantation when the patients are receiving stable maintenance immunosuppression. A recent review recommended that the OGTT be performed at least 2 months after transplantation for the diagnosis of PTDM [10,12].
- Given the numerous complications of PTDM, early detection and intervention is crucial. Modifiable risk factors (e.g., type and dose of immunosuppressive agent, graft ischemic time, and rejection episodes) can be managed by timely diagnosis and appropriate intervention. Furthermore, analysis of insulin secretion and insulin resistance is necessary to determine how immunosuppressive agents interact with and affect PTDM [13]. Tacrolimus and corticosteroids, the immunosuppressive agents most commonly used after kidney transplantation, affect insulin secretion and insulin resistance, respectively, in dose-dependent manners [14]. Therefore, investigation of changes in the patterns, or trajectories, of insulin secretion and resistance is important to determine their relative contributions to the development of PTDM. Although several studies have used OGTTs to assess insulin secretion and resistance in kidney transplant recipients, no studies have investigated the 1-year trajectories of insulin secretion and insulin resistance in kidney transplant recipients receiving a tacrolimus-based regimen.
- Here, we report the findings of a 1-year follow-up of 87 kidney transplant recipients without pre-transplant diabetes and the 1-year trajectories of insulin secretion and insulin resistance on a tacrolimus-based immunosuppression regimen. Furthermore, we used OGTT results to assess the incidences of and risk factors for PTDM.
INTRODUCTION
- Study population
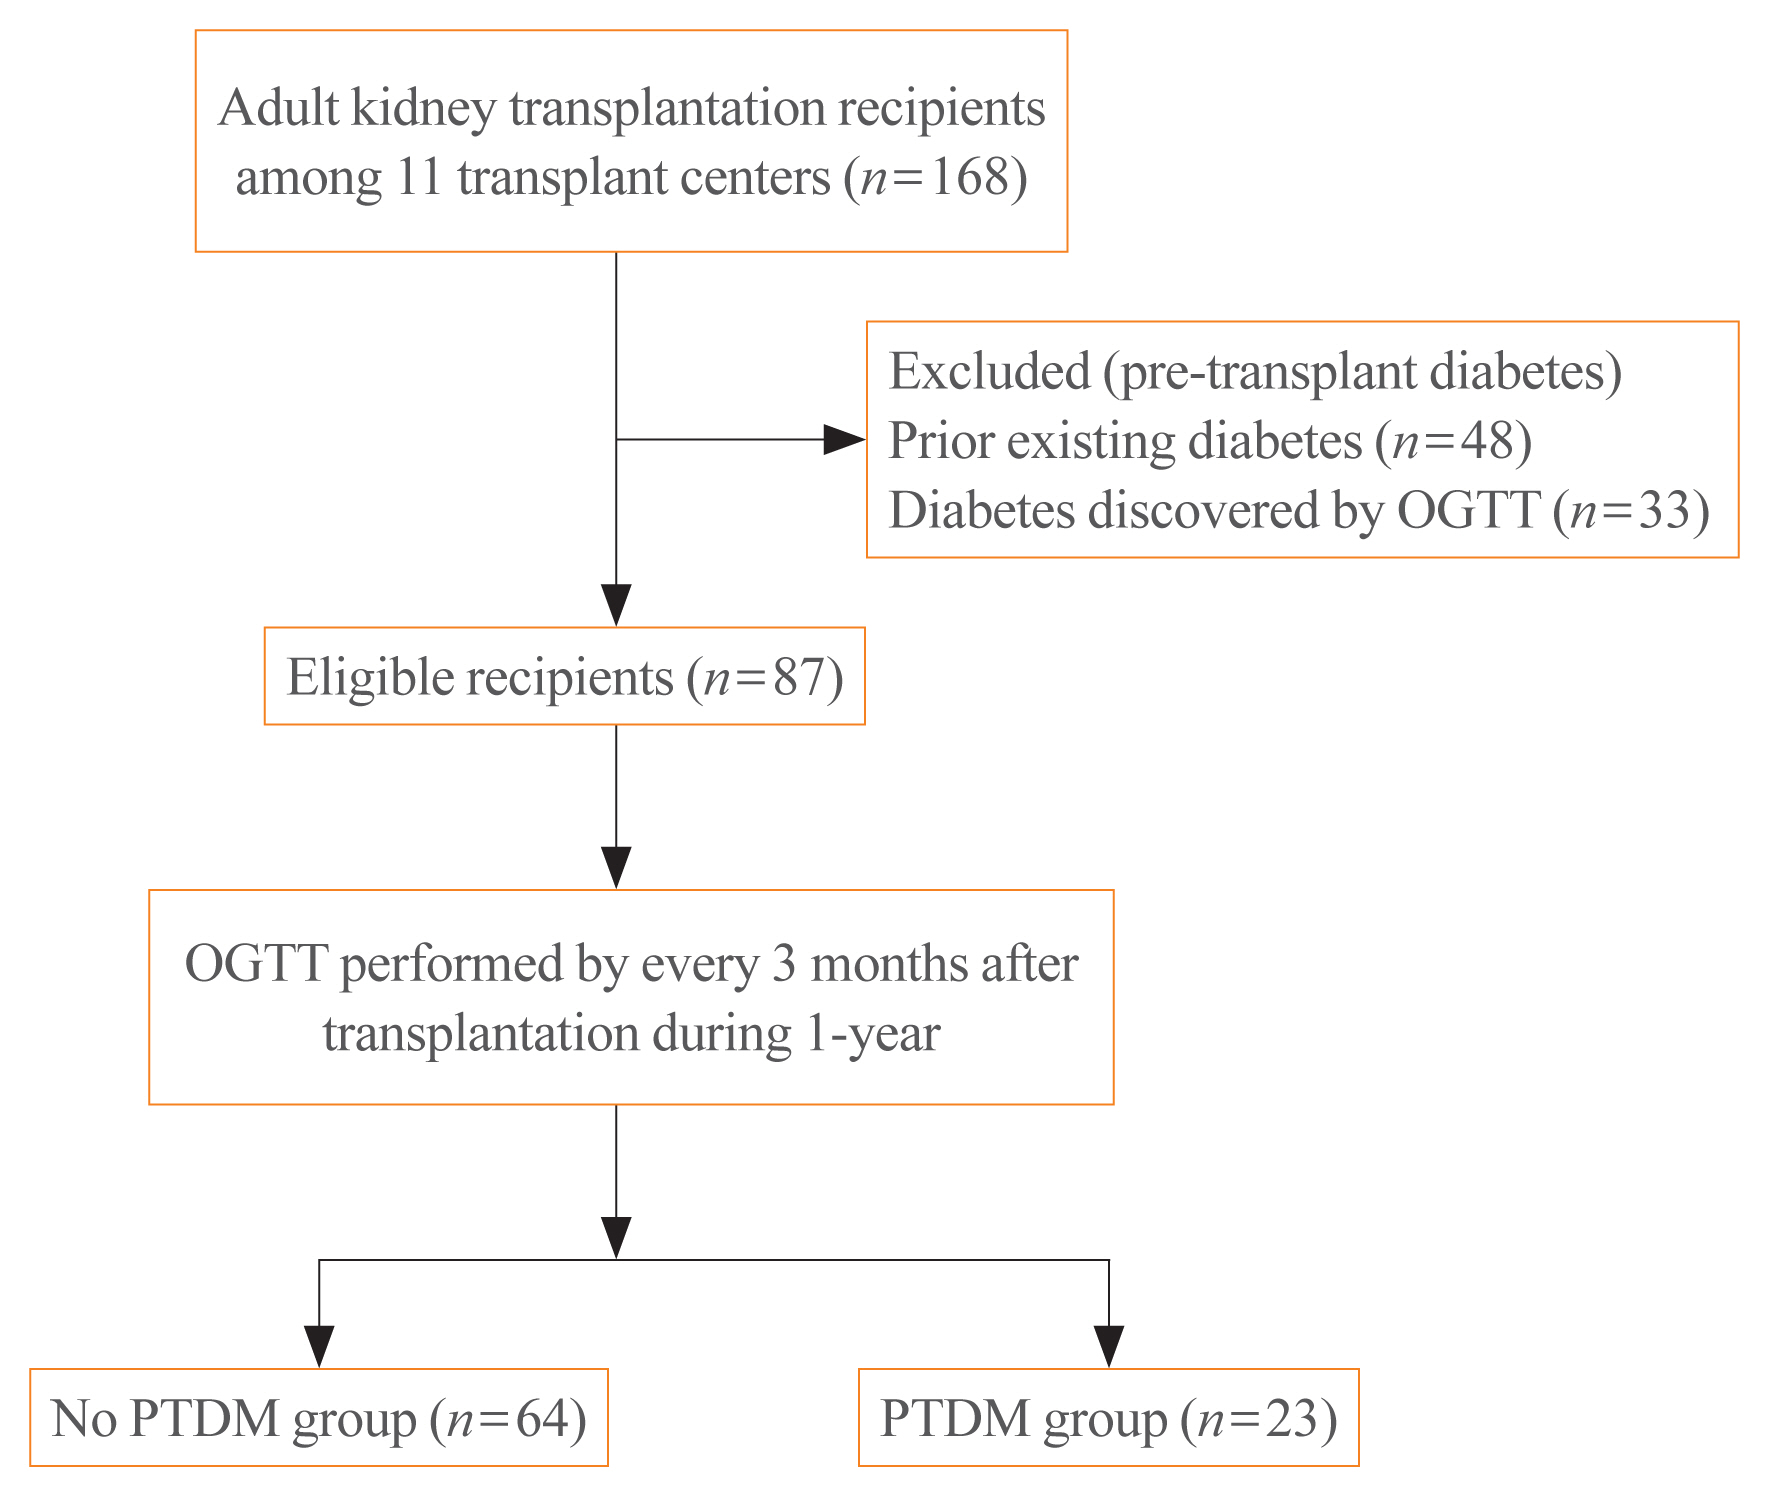
- This multicenter prospective cohort study (SERITAM [safety and efficacy of the step-wise reduction of immunosuppression with tacrolimus, mycophenolate mofetil, and basiliximab after kidney transplantation, and its effect on the glucose metabolism]) included adult patients (aged 20 to 65 years) who received kidney allografts from living or deceased donors between April 1, 2016 and September 31, 2018. The exclusion criteria included multiple organ transplants, a double kidney transplant, or organs donated after cardiac death; previous organ transplantation; ABO incompatibility; cross-match positivity; and a history of malignancy in the previous 5 years. In total, 168 kidney transplant recipients met the inclusion criteria among 11 centers. Among 168 recipients, 48 recipients were excluded due to pre-existing diabetes before transplantation, as determined by medical records. Furthermore, 33 recipients who had undiagnosed pre-transplant diabetes determined by the pre-transplant OGTT were excluded. After 81 recipients were excluded, the remaining 87 patients with normal pre-transplant glucose tolerance or prediabetes were included in the study and 1-year follow-up analyses (Fig. 1). All patients enrolled in the study provided an informed consent, and the study protocol was approved by the independent Institutional Review Board of each center (AJIRB-MED-CT4-15-422).
- Immunosuppressive regimen
- The immunosuppressive regimen consisted of basiliximab (Simulect®, Novartis, Basel, Switzerland) as induction therapy, tacrolimus (TacroBell®, Chong Kun Dang, Seoul, Korea), mycophenolate mofetil (MY-REPT®, Chong Kun Dang Pharmaceutical Co., Seoul, Korea), and corticosteroids. Basiliximab was administered immediately prior to transplantation and 4 days after transplantation. Tacrolimus was initiated 2 days before kidney transplantation at an initial dose of 0.05 to 0.1 mg/kg. The target tacrolimus trough level was between 5 and 12 ng/mL until 3 months post-transplantation; the target level was then adjusted downward to between 3 and 8 ng/mL until the end of the follow-up period. Corticosteroids were administrated intravenously at 500 mg on the day of transplantation, 250 mg on the day after transplantation; they were then gradually tapered to a maintenance dose of more than 5 mg a day of oral prednisone until 6 months post-transplantation. After 6 months, steroids were progressively reduced and stopped in a subset of recipients who were at low immunological risk. In patients who required steroid treatment due to immunological risk, steroids were administered throughout the follow-up period. Mycophenolate mofetil was started within 72 hours of transplantation at a dose of 1.0 to 2.0 g/day. In patients who experienced leukopenia or gastrointestinal toxicity, mycophenolate mofetil dose reductions were managed in accordance with a defined protocol; they were guided by the clinical severity and course of the adverse event.
- Assessment of glucose metabolism, insulin secretion, and insulin resistance
- OGTT was performed at baseline and every 3 months after transplantation until the end of the 1-year follow-up period in all patients. The patients were instructed to fast for at least 8 hours, and to not take oral hypoglycemic agents or inject insulin for 12 hours. The patients were then given a drink containing 75 g glucose mixed in water; plasma glucose and insulin were measured at 0, 30, and 120 minutes after glucose ingestion. In accordance with American Diabetes Association guidelines, PTDM was diagnosed when one of the following criteria was met: fasting plasma glucose, ≥126 mg/dL; 2-hour plasma glucose, ≥200 mg/dL during OGTT; or requirement of oral hypoglycemic agent or insulin injection [15]. Prediabetes was defined as impaired fasting glucose (fasting plasma glucose, 100 to 125 mg/dL) and impaired glucose tolerance (OGTT 2-hour plasma glucose, 140 to 199 mg/dL). OGTT results were used to assess the incidences of PTDM and prediabetes in all patients.
- The homeostatic model assessment for insulin resistance (HOMA-IR) was used to estimate insulin resistance by means of insulin levels derived from OGTTs, in accordance with an equation reported previously [16]. The insulinogenic index (IGI30), which was calculated from the insulin and glucose results of OGTTs performed at 0 and 30 minutes, was used to estimate insulin secretory function [17]. Additionally, Matsuda index and insulin secretion 1st phase (Secr1PH) were used to evaluate insulin resistance and insulin secretion [18–20].
- Statistical analysis
- The cumulative incidence of PTDM was based on the results of OGTTs performed at the 1-year follow-up. The incidences of PTDM were assessed at the 3, 6, 9, and 12-month time-points. Categorical variables are expressed as a percentage of derived groups and were assessed using Pearson’s chi-square test and Fisher’s exact test. Continuous variables are expressed as mean± standard deviation or median with interquartile ranges, and were assessed using Student’s t test and the Mann-Whitney U test. Friedman rank sum test and Wilcoxon signed rank test were used to assess the HOMA-IR and IGI trajectories. Logistic regression analysis was used to confirm independent risk factors for the development of PTDM. P values <0.05 were considered to indicate statistical significance. All statistical tests were performed using SPSS Statistics version 20.0 (IBM Corp., Armonk, NY, USA).
METHODS
- PTDM incidence and baseline characteristics of recipients
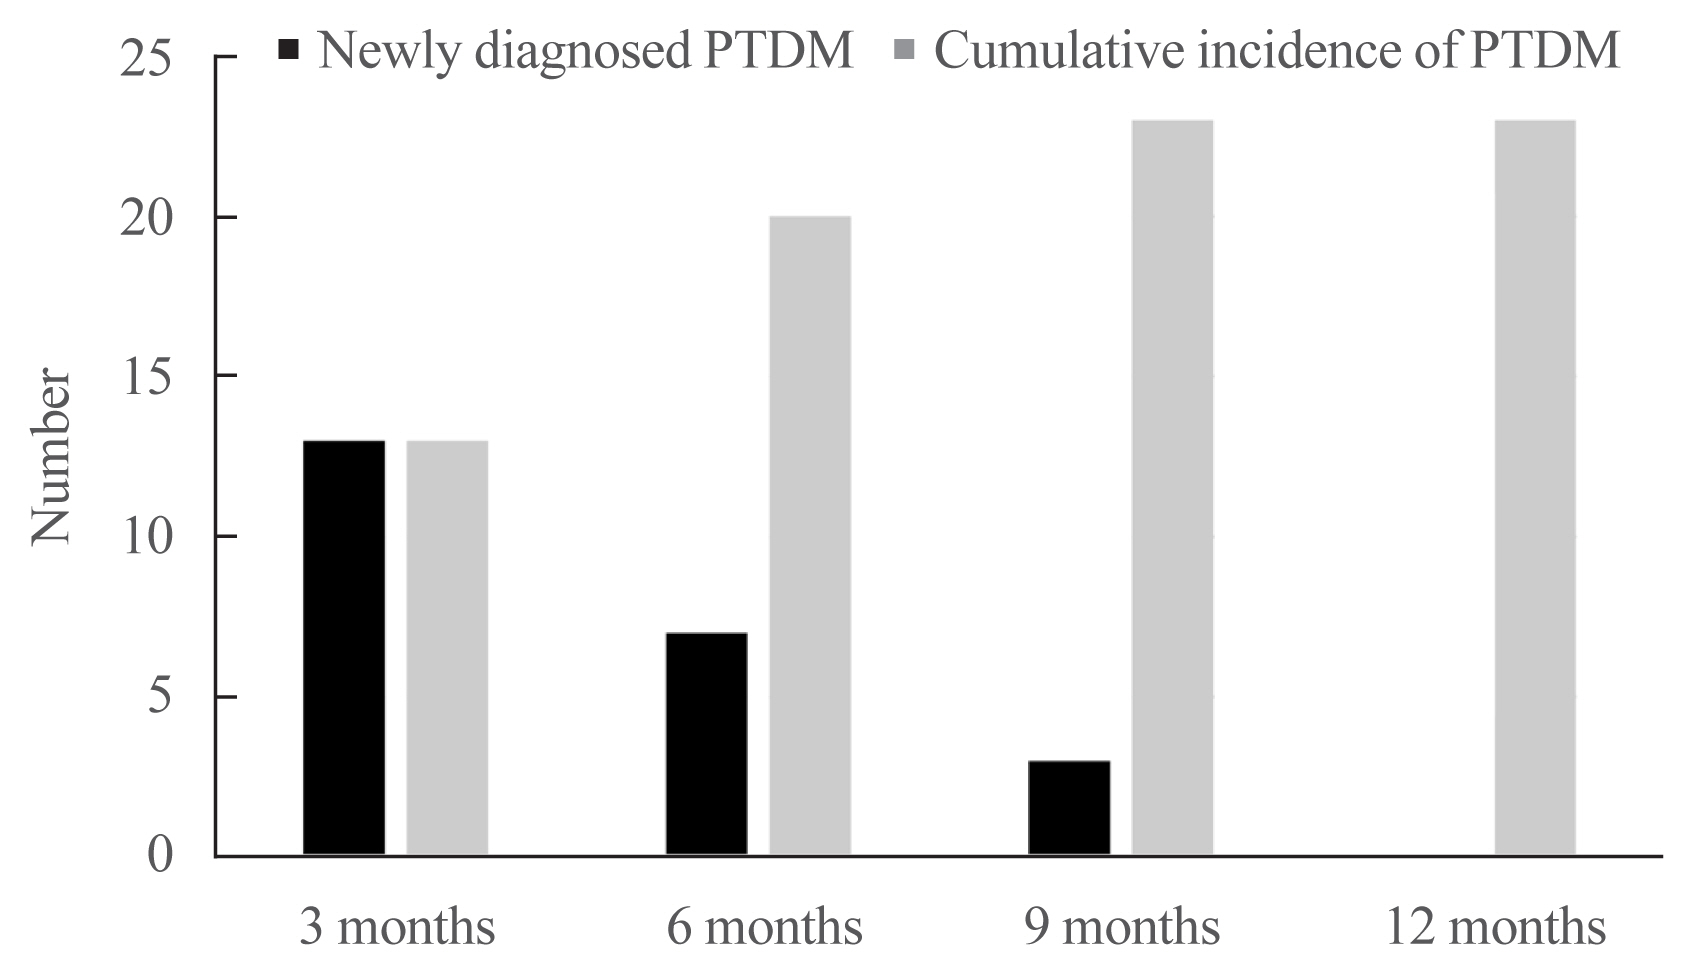
- Of the 87 recipients enrolled in the study, 48 (55.2%) were diagnosed with prediabetes, according to baseline OGTT results. During the follow-up period, the cumulative incidence of PTDM was 26.4% (n=23); 64 (73.6%) recipients exhibited normal pre-transplant glucose tolerance or prediabetes status. Three of the 23 recipients with PTDM received treatment for hyperglycemia. PTDM occurred within the first 3 months of transplantation in 13 patients (56.5%), at 6 months in seven patients (30.4%), and at 9 months in three patients (13.0%). No new-onset PTDM was detected at the 12-month OGTT (Fig. 2). Of the 64 recipients who did not develop PTDM during the study period, 35 exhibited normal pre-transplant glucose tolerance and 29 recipients exhibited prediabetes status at 1 year after kidney transplantation. According to the OGTT results at 12 months, the prevalence of PTDM was 9.2% (n=8); 15 recipients diagnosed with PTDM before 12 months exhibited normal pre-transplant glucose tolerance or prediabetes status.
- The study participants were divided into two groups according to PTDM status (Table 1). No significant between-group differences were found in terms of sex, hemoglobin A1c, and dialysis duration. Also, there is no difference in body mass index (BMI) at baseline and 12 months in both groups. In comparison to baseline BMI, BMI at 12 months decreased in both no PTDM and PTDM group. Compared with the no PTDM group, recipients with PTDM were significantly older (P= 0.002) and exhibited a significantly higher prevalence of prediabetes at baseline OGTT (P=0.05). Acute rejection occurred in two no PTDM recipients and in five recipients with PTDM (P= 0.013). Rejection episodes occurred within 3 months of transplantation in three recipients, all of whom were diagnosed with PTDM at 3 months. At baseline, fasting plasma glucose, 2-hour plasma glucose, fasting plasma insulin level, HOMA-IR, and IGI30 did not significantly differ between groups. Donor characteristics including age, sex, and donation type did not significantly differ between groups. During the study period, the tacrolimus trough level was maintained within the target range in both groups (Supplemental Fig. S1). No graft failures or patient deaths occurred during the study and graft function was well maintained in both groups at 1 year after transplantation (data not shown).
- Trajectories of insulin resistance and secretion
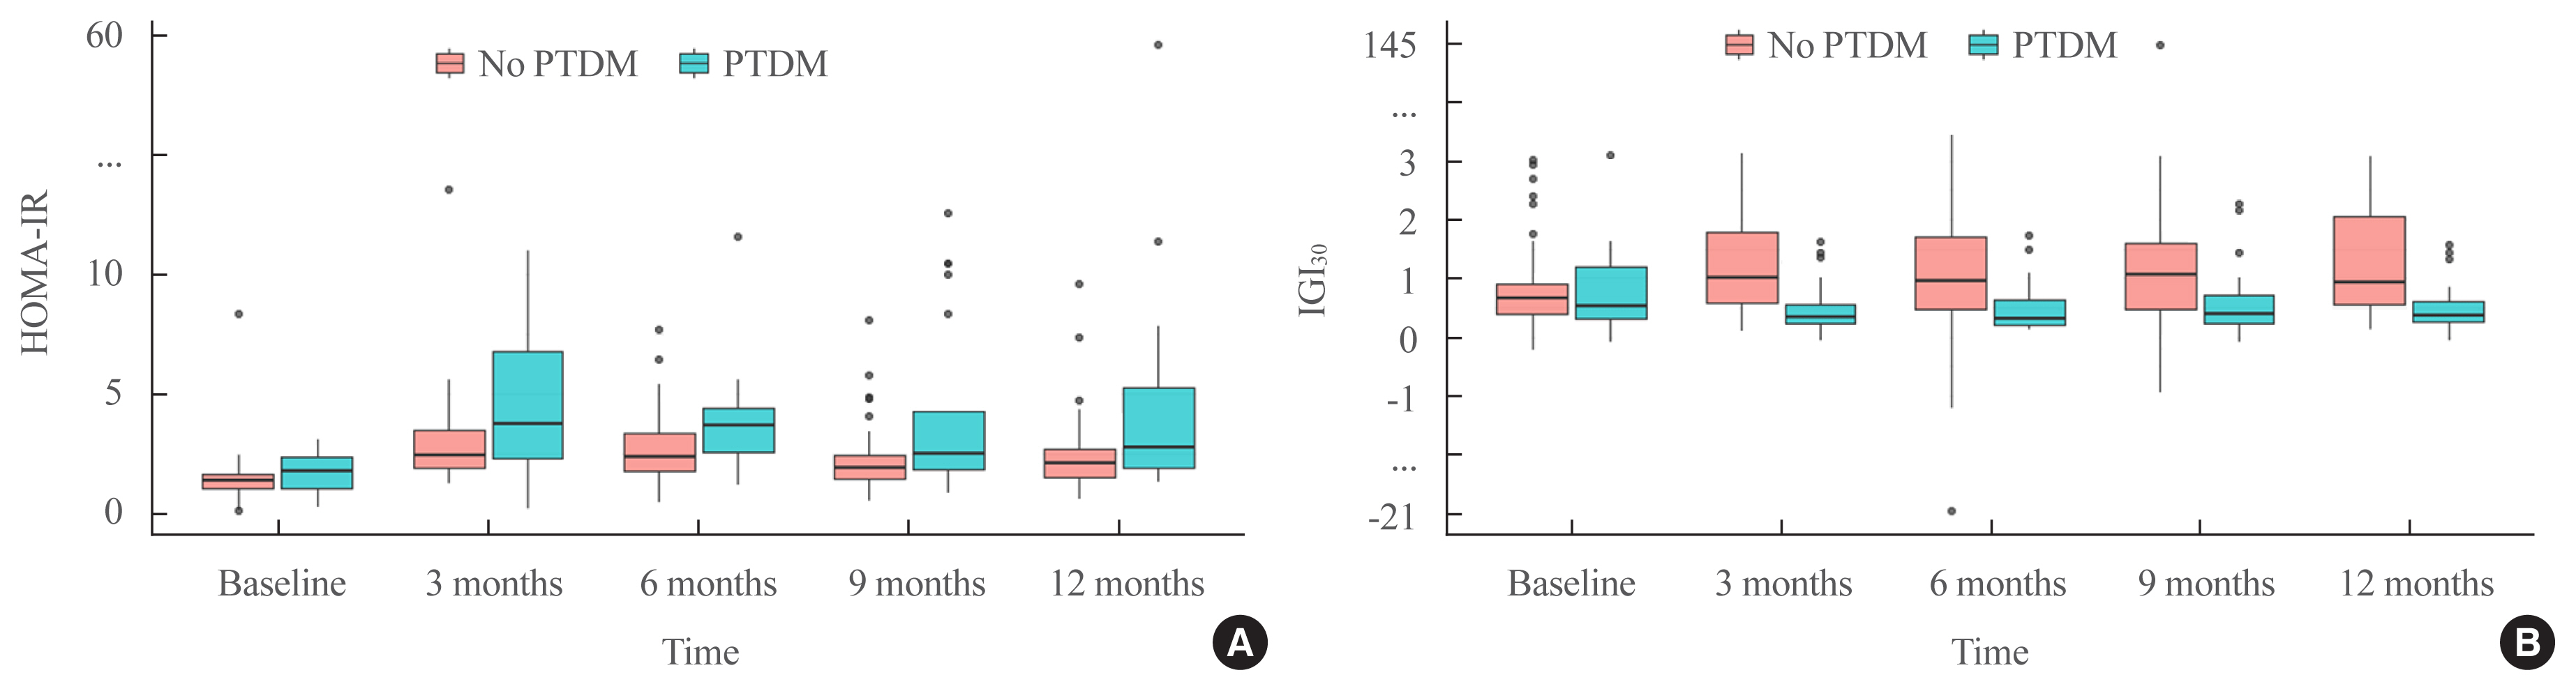
- Changes in IGI30 and HOMA-IR were measured at 3-month intervals to determine the trajectories of insulin resistance and secretion associated with PTDM (Table 2). The pre-transplantation levels of insulin resistance (HOMA-IR) and insulin secretion (IGI30) did not significantly differ between the no PTDM and PTDM groups (1.33 [1.03 to 1.63] vs. 1.76 [1.05 to 2.32], P=0.348 in HOMA-IR; 0.67 [0.4 to 0.91] vs. 0.52 [0.31 to 1.19], P>0.999 in IGI30). Compared with baseline result, HOMA-IR of every 3-month interval results significantly increased in both groups based on post-hoc analysis (P<0.05 in all post hoc analysis results). In addition, significant changes throughout the study period were seen in both groups (P<0.001 in both groups). There were significant differences of HOMA-IR between no PTDM and PTDM groups at 6 and 9 months OGTTs, whereas no significant differences were seen at 3 and 12 months OGTTs (2.41 [1.91 to 3.48] vs. 3.74 [2.27 to 6.73], P=0.078 in 3 months; 2.34 [1.74 to 3.36] vs. 3.69 [2.57 to 4.40], P=0.012 in 6 months; 1.89 [1.41 to 2.38] vs. 2.48 [1.84 to 4.24], P=0.033 in 9 months; 2.06 [1.52 to 2.65] vs. 2.72 [1.88 to 5.21], P=0.078 in 12 months) (Fig. 3A).
- In IGI30, every 3-month interval results significantly increased comparing to baseline result in no PTDM group (all P values were <0.05). However, in PTDM group, every 3-month interval results showed that IGI30 decreased comparing to baseline result without significant changes (all P values were >0.05). These changes were significant in both groups (P<0.001 in no PTDM group, P=0.008 in PTDM group). In addition, there were significant differences of every IGI30 result between two groups (1.02 [0.57 to 1.78] vs. 0.33 [0.22 to 0.56], P<0.001 in 3 months; 0.96 [0.48 to 1.70] vs. 0.30 [0.21 to 0.63], P<0.001 in 6 months; 1.05 [0.48 to 1.59] vs. 0.38 [0.24 to 0.70], P=0.010 in 9 months; 0.93 [0.54 to 2.05] vs. 0.37 [0.06 to 0.60], P<0.001 in 12 months) (Fig. 3B). As a result, HOMA-IR increased in both groups, whereas IGI30 decreased in PTDM group and increased in no PTDM group.
- In additional analysis, Matsuda index of every 3-month interval results decreased compared to baseline result in both groups. Matsuda index results of PTDM group were significantly lower than no PTDM group at 3, 6, and 9 months OGTTs. This result was in keeping with HOMA-IR results. In Secr1PH, every 3-month interval results increased in no PTDM group compared to baseline result. However, Secr1PH decreased in PTDM group compared to baseline result. In addition, Secr1PH results at 3, 6, and 9 months showed significantly differences between no PTDM and PTDM groups (Supplemental Table S1). These results of additional analysis were supporting main results that impairment of insulin secretion did not compensate increased insulin resistance.
- PTDM risk factors
- At baseline, age, prediabetes status, and acute rejection episodes significantly differed between groups. Table 3 shows the odds ratios for risk factors assessed by multivariate logistic regression analysis. Both univariate and multivariate analyses revealed that age, prediabetes status, and acute rejection episodes were associated with an increased risk of PTDM. Baseline HOMA-IR and IGI30 values were not significantly associated with the development of PTDM.
RESULTS
- Our multicenter cohort study of kidney transplant recipients receiving a tacrolimus-based immunosuppressive regimen found that the 1-year cumulative incidence of PTDM was 26.4%, while the prevalence of PTDM was 9.2% at 12 months. Furthermore, insulin resistance increased immediately after transplantation and peaked 3 months after transplantation in all recipients. Notably, no PTDM recipients showed a compensatory increase in insulin secretion, while the levels of secreted insulin were slightly reduced in the PTDM group. The risk factors significantly associated with the development of PTDM in kidney transplant recipients were older age, prediabetes, and acute rejection episodes. The trajectory analysis revealed that insulin resistance increased after transplantation in both groups; however, insulin secretion did not increase to compensate for the increase in insulin resistance in recipients with PTDM, suggesting that failure of beta cells to compensate in early post-transplantation period plays a critical role in the development of PTDM in Asian kidney transplant recipients.
- The reported 1-year incidence of PTDM in kidney transplant recipients varies between 9% and 39% [21]. This disparity is related to several factors, including immunosuppressive regimens, diagnostic criteria and timing, and the ethnicity and heterogeneity of recipients. In our study, the 1-year cumulative incidence of PTDM was estimated from pre-transplant baseline and post-transplantation (at 3-month intervals) OGTTs. At 3 months after transplantation, the incidence of PTDM was 14.9%, which constituted more than half of the 1-year cumulative incidence (56.5%). At 6 months after transplantation, the cumulative incidence of PTDM was 22.9%, which constituted 86.9% of the 1-year cumulative incidence of PTDM. These findings are consistent with the results of a previous study, which showed that the incidence of PTDM was high in the first months after transplantation, and then increased slowly [8]. Furthermore, glucose metabolism improved within 1 year after transplantation in 15 of the 23 recipients who developed PTDM. This finding is consistent with the results of a previous study, which demonstrated that the absolute incidences of PTDM were 20% at 2 months post-transplantation and 10% at 1 year after transplantation in recipients receiving a tacrolimus-based regimen [22]. Based on the serial OGTT results, no cases of new-onset PTDM occurred between 9 and 12 months after surgery, highlighting the importance of monitoring for PTDM in kidney transplant recipients during the first 6 months after transplantation.
- In the present study, we performed a baseline pre-transplantation OGTT to identify pre-existing impairments in glucose metabolism. The baseline OGTT revealed that 33 patients (18.4%) had undiagnosed diabetes; these patients were excluded from the final analysis. Caillard et al. [23] reported that 3.2% of the recipients were excluded from their study due to diabetes revealed by pre-transplantation OGTT. Taken together, these findings suggest that without a baseline OGTT, the incidence of PTDM may be high due to pre-existing diabetes before transplantation. Therefore, the 1-year incidence of PTDM reported in our study may be more accurate than the incidences reported in previous similar studies [7,19,22].
- We traced trajectories of insulin secretion and resistance and compared those at each time point between two groups. Insulin resistance increased in both groups but, more significantly increased in PTDM group at only 6 and 9 months after kidney transplantation compared with no PTDM group. Meanwhile insulin secretory function did not increase to overcome the increased insulin resistance and were consistently lower in PTDM group at 3, 6, and 9 months when new PTDM cases were diagnosed. At 3 months after kidney transplantation, when more than half of the PTDM developed, PTDM group had significantly lower insulin secretion but, similar insulin resistance compared with the no PTDM group. These suggest that the defect in insulin secretory compensation for the increase in insulin resistance is underlying mechanism in the development of PTDM during the first year after kidney transplantation. A previous large-scale cohort study concluded that insufficient compensation for reduced insulin sensitivity, due to impaired insulin secretory function, was a crucial factor in the deterioration of glucose tolerance in a general Asian population [24]. Moreover, several previous studies have found that impaired insulin secretory function was a major contributing factor in the development of PTDM in kidney transplant recipients. To the best of our knowledge, our study is the first to show the trajectories of insulin secretion and insulin resistance during the first year after kidney transplantation. There were several previous studies that evaluate insulin secretion and resistance in focused on long-term manner. However, it is important to evaluate insulin secretion and resistance trajectories during the first year after kidney transplantation because the majority of PTDM occurred during the early period of post-transplantation [19,25,26]. A major strength of our study is that we estimated insulin secretion and insulin resistance using several measurements derived from the OGTT. HOMA-IR and IGI30 are more accurate reflections of glucose and insulin metabolism, compared to measurements of basal values alone.
- We found that HOMA-IR increased and peaked 3 months after transplantation in recipients with PTDM and no PTDM recipients, then remained at similar levels after 3 months. This pattern might be associated with the dose of steroid, which was administrated intensely in early period of transplantation and tapered during 1-year after transplantation. IGI30 tended to decrease in recipients with PTDM, whereas the values increased from baseline to 3 months in recipients with no PTDM. These findings suggest that, unlike the progressive deterioration of insulin secretion and sensitivity typical of type 2 diabetes mellitus, PTDM results from dynamic changes in glucose metabolism in the early post-transplantation period, as well as changes in immunosuppressive drug doses and acute rejection episodes that typically occur within 6 months after transplantation [27]. As a result, post-transplantation changes in insulin secretion and resistance occur in the early post-transplantation period; recipients with reduced insulin secretory function are predisposed to PTDM.
- In terms of immunosuppression, changes in insulin secretion were primarily associated with calcineurin inhibitors (e.g., tacrolimus and cyclosporine), whereas insulin resistance was related to corticosteroid use [28,29]. Given that insulin secretion plays a primary role in the development of PTDM, the effect of calcineurin inhibitors may be more important than the effect of corticosteroids in the early post-transplantation period. However, we found no significant relationship between the tacrolimus trough level and development of PTDM. The results of a previous long-term follow-up study suggested that insulin resistance associated with corticosteroid use was the deciding factor between the development of PTDM and improved glucose metabolism [27]. Further studies of the relationship between immunosuppressive agents and development of PTDM are needed to clarify the pathogenesis of PTDM in transplant recipients.
- Our findings of risk factors for PTDM (i.e., older age, prediabetes at the time of transplantation, and at least one acute rejection episode) are consistent with those of previous reports [30], and we did not identify any novel risk factors. The baseline levels of HOMA-IR and IGI30 did not differ between the PTDM and no PTDM groups. The mean variations in HOMA-IR and IGI30 from baseline to 12 months were significantly associated with the development of PTDM. We propose that the 1-year trajectories of insulin secretion and insulin resistance may correspond more closely with the development of PTDM in the late post-transplantation period.
- Our study had some limitations. First, we lacked data regarding family history of diabetes and smoking status, which are potential risk factors for PTDM. Second, our study population was relatively small, compared with similar studies using OGTTs in kidney transplant recipients [31,32]. However, our study population was ethnically homogeneous, all patients were receiving the same immunosuppression regimen, and the results involved modern kidney transplantation, which may offset the limitations of our relatively small sample.
- In conclusion, our study of transplant recipients receiving a tacrolimus-based immunosuppressive regime revealed that insulin secretion was significantly impaired in transplant recipients who developed PTDM, compared with no PTDM recipients. These findings suggest that impaired insulin secretory function played a more important role in the development of PTDM in the first year after transplantation, compared with insulin resistance. Moreover, the cumulative incidence of PTDM was 26.4% at 1 year after kidney transplantation, whereas most patients developed PTDM during the first 6 months after transplantation. We propose that it is feasible to identify recipients at risk of PTDM by performing regular OGTTs during the first year after kidney transplantation.
DISCUSSION
Supplementary Data
Supplemental Fig. S1
Supplemental Table S1
-
CONFLICTS OF INTEREST
This study was supported by a research grant provided by Chong Kun Dang (Seoul, Korea).
-
AUTHOR CONTRIBUTIONS
Conception or design: C.K.O., S.H.L. Acquisition, analysis, or interpretation of data: J.B.B., C.K.O., Y.S.K., S.H.K., H.C.Y., C.D.K., M.K.J., B.J.S., S.H.L., S.Y.H., C.W.J., J.K.K., S.H.L. Drafting the work or revising: J.B.B., J.Y.J. Final approval of the manuscript: J.B.B., S.H.L., J.Y.J.
Article information
-
Acknowledgements
- This study was supported by a research grant provided by a National Research Foundation of Korea (NRF) grant funded by the Korea government (MSIT) (NRF-2020M3A9E8024904).


| Variable | No PTDM (n=64) | PTDM (n=23) | P valuea |
|---|---|---|---|
| HOMA-IR | |||
| Baseline | 1.33 (1.03–1.63) | 1.76 (1.05–2.32) | 0.348 |
| 3 months | 2.41 (1.91–3.48) | 3.74 (2.27–6.73) | 0.078 |
| 6 months | 2.34 (1.74–3.36) | 3.69 (2.57–4.40) | 0.012 |
| 9 months | 1.89 (1.41–2.38) | 2.48 (1.84–4.24) | 0.033 |
| 12 months | 2.06 (1.52–2.65) | 2.72 (1.88–5.21) | 0.078 |
| P valueb | <0.001 | <0.001 | |
| Post hoc analysisc | |||
| Baseline vs. 3 months | <0.001 | <0.001 | |
| Baseline vs. 6 months | <0.001 | <0.001 | |
| Baseline vs. 9 months | <0.001 | 0.007 | |
| Baseline vs. 12 months | <0.001 | 0.005 | |
|
|
|||
| IGI30 | |||
| Baseline | 0.67 (0.4–0.91) | 0.52 (0.31–1.19) | >0.999 |
| 3 months | 1.02 (0.57–1.78) | 0.33 (0.22–0.56) | <0.001 |
| 6 months | 0.96 (0.48–1.70) | 0.30 (0.21–0.63) | <0.001 |
| 9 months | 1.05 (0.48–1.59) | 0.38 (0.24–0.70) | 0.010 |
| 12 months | 0.93 (0.54–2.05) | 0.37 (0.26–0.60) | <0.001 |
| P valueb | <0.001 | 0.008 | |
| Post hoc analysisc | |||
| Baseline vs. 3 months | <0.001 | 0.085 | |
| Baseline vs. 6 months | 0.002 | 0.177 | |
| Baseline vs. 9 months | 0.020 | >0.999 | |
| Baseline vs. 12 months | <0.001 | 0.660 | |
Values are expressed as median (interquartile range).
HOMA-IR, homeostatic model assessment for insulin resistance; IGI30, insulinogenic index; PTDM, post-transplant diabetes mellitus.
a P values are obtained by using Mann-Whitney U test and corrected using the Bonferroni adjustment, which are significant when <0.05;
b P values are obtained by using the Friedman rank sum test;
c Data are P values, which are obtained by using Wilcoxon signed-rank test and corrected using the Bonferroni adjustment, which are significant when <0.05.
- 1. Hjelmesaeth J, Hartmann A, Leivestad T, Holdaas H, Sagedal S, Olstad M, et al. The impact of early-diagnosed new-onset post-transplantation diabetes mellitus on survival and major cardiac events. Kidney Int 2006;69:588–95.ArticlePubMed
- 2. Cosio FG, Pesavento TE, Kim S, Osei K, Henry M, Ferguson RM. Patient survival after renal transplantation: IV. Impact of post-transplant diabetes. Kidney Int 2002;62:1440–6.ArticlePubMed
- 3. Cole EH, Johnston O, Rose CL, Gill JS. Impact of acute rejection and new-onset diabetes on long-term transplant graft and patient survival. Clin J Am Soc Nephrol 2008;3:814–21.ArticlePubMedPMC
- 4. Valderhaug TG, Hjelmesaeth J, Jenssen T, Roislien J, Leivestad T, Hartmann A. Early posttransplantation hyperglycemia in kidney transplant recipients is associated with overall long-term graft losses. Transplantation 2012;94:714–20.ArticlePubMed
- 5. Siraj ES, Abacan C, Chinnappa P, Wojtowicz J, Braun W. Risk factors and outcomes associated with posttransplant diabetes mellitus in kidney transplant recipients. Transplant Proc 2010;42:1685–9.ArticlePubMed
- 6. Jenssen T, Hartmann A. Emerging treatments for post-transplantation diabetes mellitus. Nat Rev Nephrol 2015;11:465–77.ArticlePubMed
- 7. Paek JH, Kang SS, Park WY, Jin K, Park SB, Han S, et al. Incidence of post-transplantation diabetes mellitus within 1 year after kidney transplantation and related factors in Korean cohort study. Transplant Proc 2019;51:2714–7.ArticlePubMed
- 8. Woodward RS, Schnitzler MA, Baty J, Lowell JA, Lopez-Rocafort L, Haider S, et al. Incidence and cost of new onset diabetes mellitus among U.S. wait-listed and transplanted renal allograft recipients. Am J Transplant 2003;3:590–8.ArticlePubMed
- 9. Armstrong KA, Prins JB, Beller EM, Campbell SB, Hawley CM, Johnson DW, et al. Should an oral glucose tolerance test be performed routinely in all renal transplant recipients? Clin J Am Soc Nephrol 2006;1:100–8.ArticlePubMed
- 10. Sharif A, Hecking M, de Vries AP, Porrini E, Hornum M, Rasoul-Rockenschaub S, et al. Proceedings from an international consensus meeting on posttransplantation diabetes mellitus: recommendations and future directions. Am J Transplant 2014;14:1992–2000.ArticlePubMedPMC
- 11. Shabir S, Jham S, Harper L, Ball S, Borrows R, Sharif A. Validity of glycated haemoglobin to diagnose new onset diabetes after transplantation. Transpl Int 2013;26:315–21.ArticlePubMed
- 12. Jenssen T, Hartmann A. Post-transplant diabetes mellitus in patients with solid organ transplants. Nat Rev Endocrinol 2019;15:172–88.ArticlePubMed
- 13. Boots JM, van Duijnhoven EM, Christiaans MH, Wolffenbuttel BH, van Hooff JP. Glucose metabolism in renal transplant recipients on tacrolimus: the effect of steroid withdrawal and tacrolimus trough level reduction. J Am Soc Nephrol 2002;13:221–7.ArticlePubMed
- 14. van Hooff JP, Christiaans MH, van Duijnhoven EM. Tacrolimus and posttransplant diabetes mellitus in renal transplantation. Transplantation 2005;79:1465–9.ArticlePubMed
- 15. American Diabetes Association. 2. Classification and diagnosis of diabetes. Standards of medical care in diabetes-2018. Diabetes Care 2018;41(Suppl 1):S13–27.ArticlePubMedPDF
- 16. Matthews DR, Hosker JP, Rudenski AS, Naylor BA, Treacher DF, Turner RC. Homeostasis model assessment: insulin resistance and beta-cell function from fasting plasma glucose and insulin concentrations in man. Diabetologia 1985;28:412–9.ArticlePubMed
- 17. Tura A, Kautzky-Willer A, Pacini G. Insulinogenic indices from insulin and C-peptide: comparison of beta-cell function from OGTT and IVGTT. Diabetes Res Clin Pract 2006;72:298–301.ArticlePubMed
- 18. Matsuda M, DeFronzo RA. Insulin sensitivity indices obtained from oral glucose tolerance testing: comparison with the euglycemic insulin clamp. Diabetes Care 1999;22:1462–70.ArticlePubMed
- 19. Hur KY, Kim MS, Kim YS, Kang ES, Nam JH, Kim SH, et al. Risk factors associated with the onset and progression of posttransplantation diabetes in renal allograft recipients. Diabetes Care 2007;30:609–15.ArticlePubMed
- 20. Stumvoll M, Mitrakou A, Pimenta W, Jenssen T, Yki-Jarvinen H, Van Haeften T, et al. Use of the oral glucose tolerance test to assess insulin release and insulin sensitivity. Diabetes Care 2000;23:295–301.ArticlePubMed
- 21. Yates CJ, Fourlanos S, Hjelmesaeth J, Colman PG, Cohney SJ. New-onset diabetes after kidney transplantation-changes and challenges. Am J Transplant 2012;12:820–8.ArticlePubMed
- 22. David-Neto E, Lemos FC, Fadel LM, Agena F, Sato MY, Coccuza C, et al. The dynamics of glucose metabolism under calcineurin inhibitors in the first year after renal transplantation in nonobese patients. Transplantation 2007;84:50–5.ArticlePubMed
- 23. Caillard S, Eprinchard L, Perrin P, Braun L, Heibel F, Moreau F, et al. Incidence and risk factors of glucose metabolism disorders in kidney transplant recipients: role of systematic screening by oral glucose tolerance test. Transplantation 2011;91:757–64.ArticlePubMed
- 24. Ohn JH, Kwak SH, Cho YM, Lim S, Jang HC, Park KS, et al. 10-Year trajectory of β-cell function and insulin sensitivity in the development of type 2 diabetes: a community-based prospective cohort study. Lancet Diabetes Endocrinol 2016;4:27–34.ArticlePubMed
- 25. Hagen M, Hjelmesaeth J, Jenssen T, Morkrid L, Hartmann A. A 6-year prospective study on new onset diabetes mellitus, insulin release and insulin sensitivity in renal transplant recipients. Nephrol Dial Transplant 2003;18:2154–9.ArticlePubMed
- 26. Nam JH, Mun JI, Kim SI, Kang SW, Choi KH, Park K, et al. Beta-cell dysfunction rather than insulin resistance is the main contributing factor for the development of postrenal transplantation diabetes mellitus. Transplantation 2001;71:1417–23.ArticlePubMed
- 27. Sharif A, Cohney S. Post-transplantation diabetes-state of the art. Lancet Diabetes Endocrinol 2016;4:337–49.ArticlePubMed
- 28. Duijnhoven EM, Boots JM, Christiaans MH, Wolffenbuttel BH, Van Hooff JP. Influence of tacrolimus on glucose metabolism before and after renal transplantation: a prospective study. J Am Soc Nephrol 2001;12:583–8.ArticlePubMed
- 29. Qi D, Rodrigues B. Glucocorticoids produce whole body insulin resistance with changes in cardiac metabolism. Am J Physiol Endocrinol Metab 2007;292:E654–67.ArticlePubMed
- 30. Sharif A, Baboolal K. Risk factors for new-onset diabetes after kidney transplantation. Nat Rev Nephrol 2010;6:415–23.ArticlePubMed
- 31. Porrini E, Moreno JM, Osuna A, Benitez R, Lampreabe I, Diaz JM, et al. Prediabetes in patients receiving tacrolimus in the first year after kidney transplantation: a prospective and multicenter study. Transplantation 2008;85:1133–8.ArticlePubMed
- 32. Valderhaug TG, Jenssen T, Hartmann A, Midtvedt K, Holdaas H, Reisaeter AV, et al. Fasting plasma glucose and glycosylated hemoglobin in the screening for diabetes mellitus after renal transplantation. Transplantation 2009;88:429–34.ArticlePubMed
References
Figure & Data
References
Citations
- Prevalence of new-onset diabetes mellitus after kidney transplantation: a systematic review and meta-analysis
Qiufeng Du, Tao Li, Xiaodong Yi, Shuang Song, Jing Kang, Yunlan Jiang
Acta Diabetologica.2024;[Epub] CrossRef - Distúrbio do eixo hipotálamo-hipófise-gonadal e sua associação com resistência à insulina em receptores de transplante renal
Lourdes Balcázar-Hernández, Victoria Mendoza-Zubieta, Baldomero González-Virla, Brenda González-García, Mariana Osorio-Olvera, Jesús Ubaldo Peñaloza-Juarez, Irene Irisson-Mora, Martha Cruz-López, Raúl Rodríguez-Gómez, Ramón Espinoza-Pérez, Guadalupe Varga
Brazilian Journal of Nephrology.2023; 45(1): 77. CrossRef - Hypothalamic-pituitary-gonadal axis disturbance and its association with insulin resistance in kidney transplant recipients
Lourdes Balcázar-Hernández, Victoria Mendoza-Zubieta, Baldomero González-Virla, Brenda González-García, Mariana Osorio-Olvera, Jesús Ubaldo Peñaloza-Juarez, Irene Irisson-Mora, Martha Cruz-López, Raúl Rodríguez-Gómez, Ramón Espinoza-Pérez, Guadalupe Varga
Brazilian Journal of Nephrology.2023; 45(1): 77. CrossRef - Postoperative fasting plasma glucose and family history diabetes mellitus can predict post-transplantation diabetes mellitus in kidney transplant recipients
Le Wang, Jin Huang, Yajuan Li, Kewei Shi, Sai Gao, Wangcheng Zhao, Shanshan Zhang, Chenguang Ding, Wei Gao
Endocrine.2023; 81(1): 58. CrossRef - Changes in glucose metabolism among recipients with diabetes 1 year after kidney transplant: a multicenter 1-year prospective study
Jun Bae Bang, Chang-Kwon Oh, Yu Seun Kim, Sung Hoon Kim, Hee Chul Yu, Chan-Duck Kim, Man Ki Ju, Byung Jun So, Sang Ho Lee, Sang Youb Han, Cheol Woong Jung, Joong Kyung Kim, Hyung Joon Ahn, Su Hyung Lee, Ja Young Jeon
Frontiers in Endocrinology.2023;[Epub] CrossRef - Pretransplant evaluation and the risk of glucose metabolic alterations after renal transplantation: a prospective study
Arminda Fariña-Hernández, Domingo Marrero-Miranda, Estefania Perez-Carreño, Antonia De Vera-Gonzalez, Alejandra González, Cristian Acosta-Sorensen, Ana Elena Rodríguez-Rodríguez, Tatiana Collantes, Marta del Pino García, Ana Isabel Rodríguez-Muñoz, Carla
Nephrology Dialysis Transplantation.2022;[Epub] CrossRef
 PubReader
 ePub Link
 Cite
Cite