
Articles
- Page Path
- HOME > Endocrinol Metab > Volume 30(4); 2015 > Article
-
Original ArticleEndocrine Research Melanocortin 4 Receptor and Dopamine D2 Receptor Expression in Brain Areas Involved in Food Intake
- Ye Ran Yoon, Ja-Hyun Baik
-
Endocrinology and Metabolism 2015;30(4):576-583.
DOI: https://doi.org/10.3803/EnM.2015.30.4.576
Published online: December 31, 2015
Molecular Neurobiology Laboratory, Department of Life Sciences, Korea University College of Life Sciences and Biotechnology, Seoul, Korea.
- Corresponding author: Ja-Hyun Baik. Molecular Neurobiology Laboratory, Department of Life Sciences, Korea University College of Life Sciences and Biotechnology, 145 Anam-ro, Seongbuk-gu, Seoul 02841, Korea. Tel: +82-2-3290-3455, Fax: +82-2-927-9028, jahyunb@korea.ac.kr
• Received: January 30, 2015 • Revised: August 19, 2015 • Accepted: October 15, 2015
Copyright © 2015 Korean Endocrine Society
This is an Open Access article distributed under the terms of the Creative Commons Attribution Non-Commercial License (http://creativecommons.org/licenses/by-nc/3.0/) which permits unrestricted non-commercial use, distribution, and reproduction in any medium, provided the original work is properly cited.
ABSTRACT
-
Background
- The melanocortin 4 receptor (MC4R) is involved in the regulation of homeostatic energy balance by the hypothalamus. Recent reports showed that MC4R can also control the motivation for food in association with a brain reward system, such as dopamine. We investigated the expression levels of MC4R and the dopamine D2 receptor (D2R), which is known to be related to food rewards, in both the hypothalamus and brain regions involved in food rewards.
-
Methods
- We examined the expression levels of D2R and MC4R by dual immunofluorescence histochemistry in hypothalamic regions and in the bed nucleus of the stria terminalis (BNST), the central amygdala, and the ventral tegmental area of transgenic mice expressing enhanced green fluorescent protein under the control of the D2R gene.
-
Results
- In the hypothalamic area, significant coexpression of MC4R and D2R was observed in the arcuate nucleus. We observed a significant coexpression of D2R and MC4R in the BNST, which has been suggested to be an important site for food reward.
-
Conclusion
- We suggest that MC4R and D2R function in the hypothalamus for control of energy homeostasis and that within the brain regions related with rewards, such as the BNST, the melanocortin system works synergistically with dopamine for the integration of food motivation in the control of feeding behaviors.
- The regulation of body weight occurs through a homeostatic regulation center for feeding behaviors in the brain, particularly, the hypothalamus, which serves to integrate different hormonal and neuronal signals that control appetite and energy homeostasis [12]. Such homeostatic regulation monitors the level of body adiposity by employing different regulators, such as leptin, melanocortin, insulin, and ghrelin [123]. In addition, feeding behaviors can also be critically modulated by the motivation for food, which is closely associated with the brain reward system that responds to the hedonic properties of food. These hedonic qualities can override the homeostatic system [45] and result in eating disorders, leading to obesity. Therefore, delineating how the food reward circuit in the brain controls appetite and eating behaviors, in connection with the brain's homeostatic system of energy balance, is important to provide better insight into treatments for obesity.
- Among the main players in the homeostatic regulation of energy balance, the central melanocortin system is known to be critical for central energy homeostasis to control body energy balance, energy expenditure, and food intake [1678]. The melanocortin system consists of five distinct receptors that belong to the family of seven transmembrane G protein-coupled receptors; in the brain, the melanocortin 3 receptor (MC3R) and the melanocortin 4 receptor (MC4R) are expressed [8]. The endogenous ligand for both receptors is α-melanocyte-stimulating hormone (α-MSH), which is derived from the precursor proopiomelanocortin. An endogenous antagonist exists: agouti-related protein (AgRP). AgRP and α-MSH are both synthesized in a distinct population of neurons within the arcuate nucleus (ARC) of the hypothalamus and project throughout the brain [18910].
- Targeted disruption of the mouse MC4R gene leads to an obese phenotype; many types of MC4R mutations lead to severe obesity and hyperphagia in humans [11], suggesting that MC4R signaling in the brain is critical for the regulation of central energy homeostasis to control body energy balance, energy expenditure, and food intake. In humans, mutations in the MC4R gene are found in up to 5% of individuals with morbid obesity [12].
- MC4Rs are also expressed in reward-related brain areas, such as dopamine (DA) mesolimbic systems [13]; recent studies revealed that melanocortin signaling can exert functional effects on reward-related behaviors [141516]. For example, it has been reported that locomotor responses to repeated cocaine exposure are completely blocked in MC4R-null mutant mice and reduced in Agouti mice that overexpress an endogenous inhibitor of melanocortins in the brain [16]. These results also demonstrate that cocaine administration increases the expression of MC4R in the striatum [16]. Additionally, intracerebroventricular injection of AgRP has been reported to affect the responses to sweet and high-fat foods via an unknown mechanism [1718].
- The role of DA in reward-related behaviors has received much attention, because of the severe consequences of dysfunction within the mesolimbic and mesocortical circuits, including drug and food addiction [519].
- Regulation of the DA system for reward-related behaviors is mediated by the mesolimbic and mesocortical pathways, which include the neuronal projections from the ventral tegmental area (VTA) in the midbrain to the nucleus accumbens (NAc), prefrontal cortex, and other limbic areas. Drugs of abuse trigger large increases in synaptic DA concentrations in the mesolimbic system [20]; likewise, it has been reported that food rewards stimulate dopaminergic transmission in the NAc [2122]. Both DA release and variations in DA receptors appear to play roles in overeating and obesity, especially in association with the expression and function of the DA D2 receptor (D2R) [52324].
- It has been observed by imaging analysis that palatable food or a high-fat diet alters D2R expression in the NAc, striatum, or hypothalamus in both human brain and rodent brains, suggesting that D2R expression and DA release is associated with food intake [23242526]. Although recent studies demonstrated that the D2R is not required for the acquisition of drug addiction, it plays a key role in regulating synaptic modifications triggered by experiences such as stress or abstinence from drugs [2728], suggesting that D2R can trigger experience-induced relapse behaviors for drug or food seeking, indicating its specific role in reward-related behaviors.
- In an attempt to better understand the regulation of MC4R signaling in association with reward-related behaviors, we examined the expression of MC4R and D2R in both hypothalamic areas and brain regions associated with reward.
INTRODUCTION
- Animals
- Experiments were performed with D2R-enhanced green fluorescent protein [STOCK Tg(Drd2-EGFP)S118Gsat/Mmnc] mice at 8 to 12 weeks of age. Mice were housed with a 12-hour light/12-hour dark cycle under constant conditions of temperature and humidity, and had free access to tap water and a regular diet (Purina Certified Rodent Diet, Wilkes-Barre, PA, USA). Mouse procedures were carried out in accordance with the standards approved by the Institutional Animal Care and Use Committee of Korea University.
- Tissue preparation
- For immunofluorescence, mice with normal diet without specific treatment were anesthetized with 1.6 µL/g ketamine and 0.05 µL/g xylazine (Rompun, Bayer, Leverkusen, Germany) intraperitoneally, and transcardially perfused with 0.1 M phosphate buffered saline (PBS, pH 7.4) and 4% paraformaldehyde. Perfusion of mice were performed between 10:00 AM and 11:00 AM on the day of experiment. The brains were postfixed with 4% paraformaldehyde for 4 hours at 4℃ and kept in 30% sucrose for 24 to 48 hours at 4℃. Free-floating cryostat sections of 40-µm thickness were serially prepared.
- Immunofluorescence and microscopy
- Immunofluorescence was performed on 40-µm-thick coronal sections of D2R-EGFP mice. Sections were washed in 0.1 M PBS (pH 7.4) three times for 10 minutes and then incubated in blocking solution (0.3% TritonX-100 and 3% bovine serum albumin in 0.1 M PBS) for 30 minutes. Sections were then incubated with primary rabbit polyclonal anti-MC4R antibody (1:100, catalog no. AMR-024, Alomone Labs, Jerusalem, Israel) in blocking solution overnight at 4℃ with slow shaking. Subsequently, the sections were washed in 0.1 M PBS (pH 7.4) and incubated with secondary Alexa Fluor 568 anti-rabbit immunoglobulin G (1:1,000, catalog no. A10042, Life Technologies, Eugene, OR, USA) in blocking solution for 1 hour at room temperature with slow shaking. After washing with 0.1 M PBS (pH 7.4), the sections were stained with Hoechst 33342 fluorochrome (1:2,500, catalog no. H1399, Invitrogen, Eugene, OR, USA) for visualization of nuclei. Sections were then mounted with Vectashield mounting medium (catalog no. H-1400, Vector, Burlingame, CA, USA) and coverslips were placed on the slides. Sections were examined on a BX51 microscope (Olympus, Tokyo, Japan) with a DP72 camera (Olympus) or a LSM 700 confocal laser scanning system (Carl Zeiss, Berlin, Germany). The observed images are presented at low and high magnifications. Cells were counted in the magnified images. D2R- and MC4R-positive cells were counted separately and then D2R-MC4R-coexpressing cells were counted. Quantifications were performed with hemisphere of coronal slices of each brain region, on six slices per mouse (1,730 to 2,094 cells) for ARC, on six slices per mouse (2,743 to 3,664 cells) for lateral hypothalamus (LH) area, on four slices per mouse (2,776 to 3,468 cells) for bed nucleus of the stria terminalis (BNST), six slices per mouse (2,229 to 2,844 cells) for central amygdala (CeA), and five slices per mouse (1,085 to 1,803 cells) for VTA area. The data for each animal are expressed as the average from three mice.
METHODS
- Expression of D2R and MC4R in the hypothalamus
- We used transgenic mice expressing EGFP under the control of the D2R gene to analyze the coexpression of D2R with MC4R. We performed dual immunofluorescence on hypothalamic regions and in the striatum and midbrain. Expression of MC4R was observed throughout the hypothalamus and was particularly strong in the paraventricular nucleus (PVN) (Fig. 1A) and ARC; MC4R expression was also observed in the LH, dorsomedial, and ventromedial (VMH) hypothalamic areas (Fig. 1B, C). D2R expression was observed in several hypothalamic regions, including the ARC, VMH, and LH but negligibly in the PVN. We observed D2R and MC4R coexpression in the ARC; an approximate cell count in the ARC revealed that immunoreactivity for MC4R was found in 39% (SEM, ±4.45) of neurons, and coexpression of MC4R-D2R was found in around 44% (SEM, ±5.30) of D2R-positive cells (Fig. 1B, D). In other regions of the hypothalamus, such as the LH, MC4R expression was lower than in the ARC and coexpression of D2R-MC4R was found around 27% (SEM, ±3.15) of D2R-positive cells (Fig. 1C, D).
- Expression of D2R and MC4R in the striatum and midbrain
- In the striatal area, MC4R expression was detected in the boundary region of the NAc, but barley detected in the NAc and strong expression was observed in the BNST, whereas D2R expression was strong in the NAc and caudate putamen, but rather modest in the BNST (Fig. 2A). D2R-MC4R coexpression was observed in 32% (SEM, ±2.82) of D2R-positive cells of the BNST region (Fig. 2A, D), showing a substantial overlap.
- We also observed D2R expression in 25% (SEM, ±0.64) of cells of the CeA with 11.12% (SEM, ±2.05) of D2R-positive cells coexpressing MC4R in the CeA (Fig. 2B, D).
- In the midbrain, D2R was expressed in the VTA and substantia nigra compacta, but weak MC4R expression was observed in the VTA. In the VTA, D2R was expressed in approximately 21% (SEM, ±1.33) of total cells and low levels of MC4R expression were found (around 3% of total cells) in this region. We observed very weak D2R-MC4R coexpression in the VTA as 3.7% (SEM, ±1.07) of D2R-positive cells in this area (Fig. 2C, D).
RESULTS
- Although the role of melanocortins in food reward behaviors is well accepted, the mechanism underlying this regulation has not been clearly established. In the present study, we examined MC4R and D2R expression in hypothalamic and other brain areas known to be involved in reward-related behaviors. In our study, we have used D2R-EGFP mice, which have eased the identification of the D2R-expressing neurons with strong green fluorescent protein (GFP) signals which are observed rather in the soma of neurons with also some signals in neuropils, while MC4R signals revealed by immunofluorescence staining, were shown as puncta structures along with the cell membrane. It is possible that our data may not account for all double-labeled coexpressed cells, because of variability of either GFP signals or MC4R immunoreactivities. In situ hybridization combined with immunohistochemistry for these receptors may help to provide a better estimation for their coexpression in neurons.
- In the hypothalamus, we found that MC4R expression is strong in the PVN, but rather weak in the ARC as previously known (Fig. 1A); the role of MC4R in the ARC is not yet clearly defined, but it appears that MC4R in this area can control the effects of both α-MSH and neuropeptide Y on neuronal activities [2930]. We observed significant coexpression of D2Rs and MC4Rs in the ARC, suggesting their potential interactive roles in the regulation of energy homeostasis. Expression of D2R in the ARC has been previously reported and was also demonstrated to be colocalized with leptin receptor-expressing cells; thus, controlling leptin signaling in this area [26].
- Interactions between MC4R and the dopaminergic system have been suggested [1531]. Lindblom et al. [32] reported that the infusion of α-MSH into the VTA induces a significant increase in DA levels in the NAc, and this increase was completely blocked by pretreatment with the MC4R selective antagonist HS131, indicating that the effects of α-MSH on DA transmission may be mediated by MC4R. Hsu et al. [16] reported that the infusion of a melanocortin peptide antagonist into the NAc blocks the reinforcing, motivational, and locomotor-sensitizing effects of cocaine, and the locomotor responses to repeated cocaine exposure are completely blocked in MC4R-null mutant mice. It has also been suggested that MC4R within dopaminergic neurons in the NAc is associated with stress-induced anhedonia with synaptic changes [15]. These studies show a possible close interaction between the melanocortin and DA systems. However, we could not detect MC4R expression in the NAc, but only on the border of the NAc and BNST. A similar study reported that no MC4R-positive neurons were detected in the NAc (both core and shell divisions), as revealed by immunocytochemistry [33]. In fact, some discrepancies between the distribution of MC4R mRNA and MC4R-positive neurons have been observed [1333], mostly in the NAc, probably due to technical differences of staining for in situ hybridization versus immunocytochemistry. In the VTA, MC4R expression is very weak, but MC3R expression seems to be more significantly expressed [34]. Therefore, it will be interesting to see how these receptors integrate melanocortin signaling in the VTA dopaminergic circuit.
- Recent rodent and primate studies suggest that BNST, a component of the extended amygdale, is a key mediator of stress and reward interactions [3536]. Studies of lesions or pharmacological manipulations of the BNST suggest its role in the physiology of fear, food intake, and goal-directed behaviors [3637]. It has been reported that self-administration of food or palatable food activate BNST area in mice or rat [3738]. Our present study showing a significant coexpression of D2R and MC4R in this area, suggests a potential implication of dopaminergic and melanocortin system in BNST-related circuit for regulation of food intake behaviors. It appears that the BNST projects to and exerts a strong excitatory influence on the firing of DA neurons within the VTA [39], and this projection has been implicated in physiological and pathological reward-directed behaviors, such as food and cocaine addiction [39].
- Another brain regions associated with reward we examined is the CeA, which is known to be involved in behavioral responses to stress and ingestive behaviors [40], where increasing evidences are suggesting an important role of D2R in this region for food reward. In the CeA, we found the substantial expression of D2R as 25% of total cells, while the expression of MC4R was lower showing the coexpression of MC4R and D2R around the 11% of D2R-positive cells. Further studies will be required to understand the role and their possible interaction of these receptors in food reward through CeA.
- In summary, we examined MC4R and D2R expression in the hypothalamus, BNST, CeA, and VTA, which can affect the influence of food rewards on feeding behaviors. How melanocortin signaling within the amygdala, or other areas can interact with other systems, such as the DA system with the hypothalamus, to control feeding behaviors remain to be further evaluated. These lines of investigation will provide a foundation for the neural circuitry of food intake, elucidating the underlying pathophysiology of food addiction.
DISCUSSION
-
Acknowledgements
- This work was supported by a grant from the Korea Health Technology R&D Project through the Korea Health Industry Development Institute (KHIDI), and funded by the Ministry of Health and Welfare, Republic of Korea (grant number: HI11C1729) and by the Bio & Medical Technology Development Program of the National Research Foundation (NRF) funded by the Ministry of Science, ICT & Future Planning (2013M3A9D5072550), and by a Korea University Grant.
ACKNOWLEDGMENTS
-
CONFLICTS OF INTEREST: No potential conflict of interest relevant to this article was reported.
Article information
- 1. Schwartz MW, Woods SC, Porte D Jr, Seeley RJ, Baskin DG. Central nervous system control of food intake. Nature 2000;404:661–671. ArticlePubMedPDF
- 2. Morton GJ, Cummings DE, Baskin DG, Barsh GS, Schwartz MW. Central nervous system control of food intake and body weight. Nature 2006;443:289–295. ArticlePubMedPDF
- 3. Saper CB, Chou TC, Elmquist JK. The need to feed: homeostatic and hedonic control of eating. Neuron 2002;36:199–211. ArticlePubMed
- 4. Palmiter RD. Is dopamine a physiologically relevant mediator of feeding behavior? Trends Neurosci 2007;30:375–381. ArticlePubMed
- 5. Baik JH. Dopamine signaling in food addiction: role of dopamine D2 receptors. BMB Rep 2013;46:519–526. ArticlePubMedPMCPDF
- 6. Elmquist JK, Elias CF, Saper CB. From lesions to leptin: hypothalamic control of food intake and body weight. Neuron 1999;22:221–232. ArticlePubMed
- 7. Bjorbaek C, Hollenberg AN. Leptin and melanocortin signaling in the hypothalamus. Vitam Horm 2002;65:281–311. ArticlePubMed
- 8. Cone RD. Studies on the physiological functions of the melanocortin system. Endocr Rev 2006;27:736–749. ArticlePubMedPDF
- 9. Bagnol D, Lu XY, Kaelin CB, Day HE, Ollmann M, Gantz I, et al. Anatomy of an endogenous antagonist: relationship between Agouti-related protein and proopiomelanocortin in brain. J Neurosci 1999;19:RC26ArticlePubMedPMC
- 10. Cui H, Sohn JW, Gautron L, Funahashi H, Williams KW, Elmquist JK, et al. Neuroanatomy of melanocortin-4 receptor pathway in the lateral hypothalamic area. J Comp Neurol 2012;520:4168–4183. ArticlePubMedPMC
- 11. Huszar D, Lynch CA, Fairchild-Huntress V, Dunmore JH, Fang Q, Berkemeier LR, et al. Targeted disruption of the melanocortin-4 receptor results in obesity in mice. Cell 1997;88:131–141. ArticlePubMed
- 12. Santini F, Maffei M, Pelosini C, Salvetti G, Scartabelli G, Pinchera A. Melanocortin-4 receptor mutations in obesity. Adv Clin Chem 2009;48:95–109. ArticlePubMed
- 13. Kishi T, Aschkenasi CJ, Lee CE, Mountjoy KG, Saper CB, Elmquist JK. Expression of melanocortin 4 receptor mRNA in the central nervous system of the rat. J Comp Neurol 2003;457:213–235. ArticlePubMed
- 14. Alvaro JD, Taylor JR, Duman RS. Molecular and behavioral interactions between central melanocortins and cocaine. J Pharmacol Exp Ther 2003;304:391–399. ArticlePubMed
- 15. Lim BK, Huang KW, Grueter BA, Rothwell PE, Malenka RC. Anhedonia requires MC4R-mediated synaptic adaptations in nucleus accumbens. Nature 2012;487:183–189. ArticlePubMedPMCPDF
- 16. Hsu R, Taylor JR, Newton SS, Alvaro JD, Haile C, Han G, et al. Blockade of melanocortin transmission inhibits cocaine reward. Eur J Neurosci 2005;21:2233–2242. ArticlePubMedPMC
- 17. Davis JF, Choi DL, Shurdak JD, Krause EG, Fitzgerald MF, Lipton JW, et al. Central melanocortins modulate mesocorticolimbic activity and food seeking behavior in the rat. Physiol Behav 2011;102:491–495. ArticlePubMed
- 18. Tracy AL, Clegg DJ, Johnson JD, Davidson TL, Benoit SC. The melanocortin antagonist AgRP (83-132) increases appetitive responding for a fat, but not a carbohydrate, reinforcer. Pharmacol Biochem Behav 2008;89:263–271. ArticlePubMed
- 19. Baik JH. Dopamine signaling in reward-related behaviors. Front Neural Circuits 2013;7:152ArticlePubMedPMC
- 20. Di Chiara G, Imperato A. Drugs abused by humans preferentially increase synaptic dopamine concentrations in the mesolimbic system of freely moving rats. Proc Natl Acad Sci U S A 1988;85:5274–5278. ArticlePubMedPMC
- 21. Bassareo V, Di Chiara G. Differential influence of associative and nonassociative learning mechanisms on the responsiveness of prefrontal and accumbal dopamine transmission to food stimuli in rats fed ad libitum. J Neurosci 1997;17:851–861. ArticlePubMedPMC
- 22. Roitman MF, Stuber GD, Phillips PE, Wightman RM, Carelli RM. Dopamine operates as a subsecond modulator of food seeking. J Neurosci 2004;24:1265–1271. ArticlePubMedPMC
- 23. Wang GJ, Volkow ND, Logan J, Pappas NR, Wong CT, Zhu W, et al. Brain dopamine and obesity. Lancet 2001;357:354–357. ArticlePubMed
- 24. Stice E, Spoor S, Bohon C, Small DM. Relation between obesity and blunted striatal response to food is moderated by TaqIA A1 allele. Science 2008;322:449–452. ArticlePubMedPMC
- 25. Johnson PM, Kenny PJ. Dopamine D2 receptors in addiction-like reward dysfunction and compulsive eating in obese rats. Nat Neurosci 2010;13:635–641. ArticlePubMedPMCPDF
- 26. Kim KS, Yoon YR, Lee HJ, Yoon S, Kim SY, Shin SW, et al. Enhanced hypothalamic leptin signaling in mice lacking dopamine D2 receptors. J Biol Chem 2010;285:8905–8917. ArticlePubMedPMC
- 27. Sim HR, Choi TY, Lee HJ, Kang EY, Yoon S, Han PL, et al. Role of dopamine D2 receptors in plasticity of stress-induced addictive behaviours. Nat Commun 2013;4:1579ArticlePubMedPDF
- 28. Song SS, Kang BJ, Wen L, Lee HJ, Sim HR, Kim TH, et al. Optogenetics reveals a role for accumbal medium spiny neurons expressing dopamine D2 receptors in cocaine-induced behavioral sensitization. Front Behav Neurosci 2014;8:336ArticlePubMedPMC
- 29. Mounien L, Bizet P, Boutelet I, Vaudry H, Jegou S. Expression of melanocortin MC3 and MC4 receptor mRNAs by neuropeptide Y neurons in the rat arcuate nucleus. Neuroendocrinology 2005;82:164–170. ArticlePubMed
- 30. Siljee JE, Unmehopa UA, Kalsbeek A, Swaab DF, Fliers E, Alkemade A. Melanocortin 4 receptor distribution in the human hypothalamus. Eur J Endocrinol 2013;168:361–369. ArticlePubMed
- 31. Pandit R, de Jong JW, Vanderschuren LJ, Adan RA. Neurobiology of overeating and obesity: the role of melanocortins and beyond. Eur J Pharmacol 2011;660:28–42. ArticlePubMed
- 32. Lindblom J, Opmane B, Mutulis F, Mutule I, Petrovska R, Klusa V, et al. The MC4 receptor mediates alpha-MSH induced release of nucleus accumbens dopamine. Neuroreport 2001;12:2155–2158. ArticlePubMed
- 33. Gelez H, Poirier S, Facchinetti P, Allers KA, Wayman C, Bernabe J, et al. Neuroanatomical distribution of the melanocortin-4 receptors in male and female rodent brain. J Chem Neuroanat 2010;40:310–324. ArticlePubMed
- 34. Lippert RN, Ellacott KL, Cone RD. Gender-specific roles for the melanocortin-3 receptor in the regulation of the mesolimbic dopamine system in mice. Endocrinology 2014;155:1718–1727. ArticlePubMedPMCPDF
- 35. Dumont EC. What is the bed nucleus of the stria terminalis? Prog Neuropsychopharmacol Biol Psychiatry 2009;33:1289–1290. ArticlePubMedPMC
- 36. Jalabert M, Aston-Jones G, Herzog E, Manzoni O, Georges F. Role of the bed nucleus of the stria terminalis in the control of ventral tegmental area dopamine neurons. Prog Neuropsychopharmacol Biol Psychiatry 2009;33:1336–1346. ArticlePubMedPMC
- 37. Dumont EC, Mark GP, Mader S, Williams JT. Self-administration enhances excitatory synaptic transmission in the bed nucleus of the stria terminalis. Nat Neurosci 2005;8:413–414. ArticlePubMedPMCPDF
- 38. Figlewicz DP, Bennett-Jay JL, Kittleson S, Sipols AJ, Zavosh A. Sucrose self-administration and CNS activation in the rat. Am J Physiol Regul Integr Comp Physiol 2011;300:R876–R884. ArticlePubMedPMC
- 39. Georges F, Aston-Jones G. Activation of ventral tegmental area cells by the bed nucleus of the stria terminalis: a novel excitatory amino acid input to midbrain dopamine neurons. J Neurosci 2002;22:5173–5187. ArticlePubMedPMC
- 40. Areias MF, Prada PO. Mechanisms of insulin resistance in the amygdala: influences on food intake. Behav Brain Res 2015;282:209–217. ArticlePubMed
References
Fig. 1
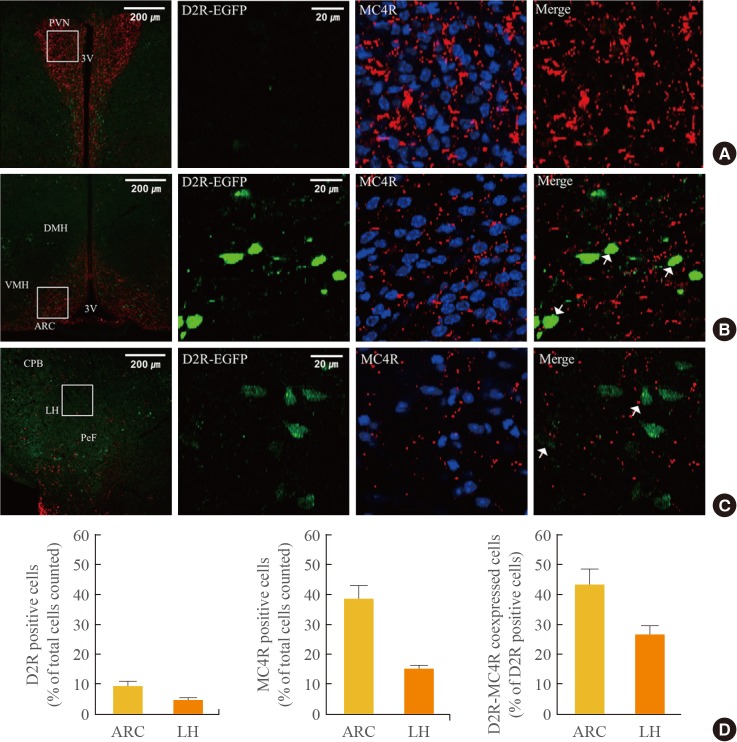
Expression of dopamine D2 receptor (D2R) and melanocortin 4 receptor (MC4R) in the hypothalamus. D2R-enhanced green fluorescent protein (EGFP) mice were sacrificed, and brain samples were prepared as 40-µm-thick coronal cryosections. Brain sections were then subjected to immunofluorescence staining with anti-MC4R antibody. Immunofluorescence revealed D2R and MC4R coexpression in hypothalamic regions, including (A) the paraventricular nucleus (PVN), (B) arcuate nucleus (ARC), and (C) lateral hypothalamus (LH). The left panel shows a low magnification image (scale bar, 200 µm) and the inset shows a high magnification image (scale bar, 20 µm) for D2R (green) and MC4R (red) stained cells, and D2R-MC4R-coexpressing cells (merge). Arrows indicate D2R-MC4R-coexpressing cells. (D) Relative quantification of D2R- and MC4R-positive cells and D2R-MC4R coexpressed cells in each brain region. Relative percentages of D2R- and MC4R-positive cells were normalized with number of total cells counted. D2R-MC4R coexpression was shown as a percentage normalized with number of D2R-positive cells. Quantifications were performed with hemisphere of coronal slices of each brain region, on six slices per mouse (1,730 to 2,094 cells) for ARC and on six slices per mouse (2,743 to 3,664 cells) for LH area. The data for each animal are expressed as the average from three mice. DMH, dorsomedial hypothalamus; VMH, ventromedial hypothalamus; 3V, third ventricle; CPB, cerebral peduncle basal part; PeF, perifornical nucleus.
Fig. 2
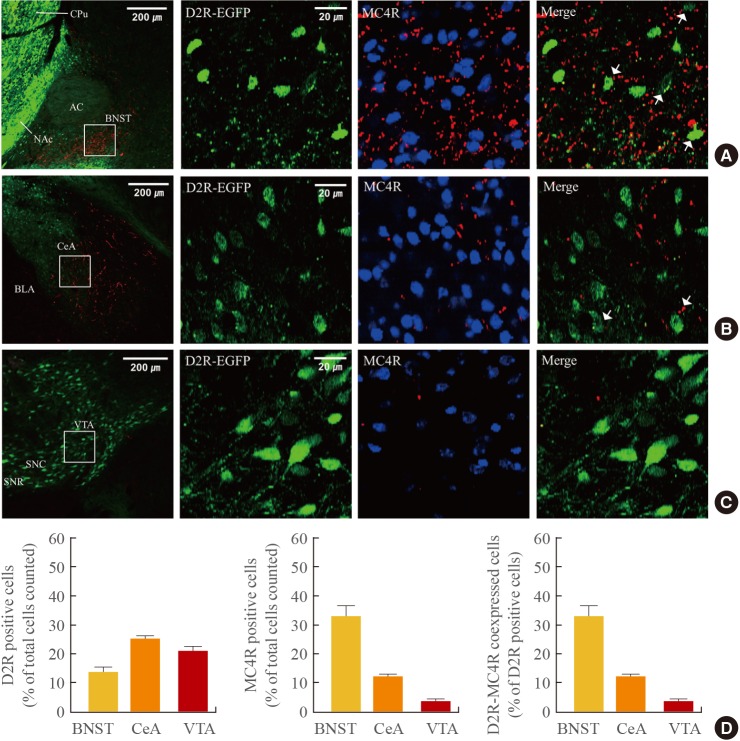
Expression of dopamine D2 receptor (D2R) and melanocortin 4 receptor (MC4R) in the striatal area, amygdale, and ventral tegmental area (VTA). Fixed brain slices (40-µm thickness) of D2R-enhanced green fluorescent protein (EGFP) mice were prepared, and immunofluorescence staining for MC4R was performed. Representative immunofluorescence images show D2R-MC4R coexpression in (A) the bed nucleus of the stria terminalis (BNST), (B) central amygdala (CeA), and (C) VTA. The left panel shows a low magnification image (scale bar, 200 µm) and the inset shows a high magnification image (scale bar, 20 µm) for D2R (green) and MC4R (red) stained cells, and D2R-MC4R-coexpressing cells (merge). Arrows indicate D2R-MC4R-coexpressing cells. (D) The graphs show the quantification of D2R- and MC4R-positive cells and D2R-MC4R coexpressed cells in each brain region. Relative percentages of D2R- and MC4R-positive cells were normalized with number of total cells counted. Relative ratio of D2R-MC4R coexpressed cells was shown as a percentage normalized with number of D2R-positive cells. Quantifications were performed in hemisphere of serial sections of each region, on four slices per mouse (2,776 to 3,468 cells) for BNST, six slices per mouse (2,229 to 2,844 cells) for CeA, and five slices per mouse (1,085 to 1,803 cells) for VTA area. The data for each animal are expressed as the average from three mice. CPu, caudate putamen; AC, anterior commissure; NAc, nucleus accumbens; BLA, basolateral amygdala; SNC, substantianigra compact part; SNR, substantianigra reticular part.
Figure & Data
References
Citations
Citations to this article as recorded by 
- Experimental biology can inform our understanding of food insecurity
Linda Wilbrecht, Wan Chen Lin, Kathryn Callahan, Melissa Bateson, Kevin Myers, Rachel Ross
Journal of Experimental Biology.2024;[Epub] CrossRef - Dopamine D2-Subtype Receptors Outside the Blood-Brain Barrier Mediate Enhancement of Mesolimbic Dopamine Release and Conditioned Place Preference by Intravenous Dopamine
J. Daniel Obray, Christina A. Small, Emily K. Baldwin, Eun Young Jang, Jin Gyeom Lee, Chae Ha Yang, Jordan T. Yorgason, Scott C. Steffensen
Frontiers in Cellular Neuroscience.2022;[Epub] CrossRef - Reduced MC4R signaling alters nociceptive thresholds associated with red hair
Kathleen C. Robinson, Lajos V. Kemény, Gillian L. Fell, Andrea L. Hermann, Jennifer Allouche, Weihua Ding, Ajay Yekkirala, Jennifer J. Hsiao, Mack Y. Su, Nicholas Theodosakis, Gabor Kozak, Yuichi Takeuchi, Shiqian Shen, Antal Berenyi, Jianren Mao, Cliffor
Science Advances.2021;[Epub] CrossRef - Is aripiprazole a key to unlock anorexia nervosa?: A case series
Akın Tahıllıoğlu, Tuğçe Özcan, Gamze Yüksel, Noorjahan Majroh, Sezen Köse, Burcu Özbaran
Clinical Case Reports.2020; 8(12): 2826. CrossRef - The Melanocortin System behind the Dysfunctional Eating Behaviors
Emanuela Micioni Di Bonaventura, Luca Botticelli, Daniele Tomassoni, Seyed Khosrow Tayebati, Maria Vittoria Micioni Di Bonaventura, Carlo Cifani
Nutrients.2020; 12(11): 3502. CrossRef - Visceral adiposity and insular networks: associations with food craving
Oren Contreras-Rodríguez, Marta Cano, Raquel Vilar-López, Jacqueline Schmidt Rio-Valle, Juan Verdejo-Román, Juan F. Navas, Cristina Martín-Pérez, Fernando Fernández-Aranda, José Manuel Menchón, Carles Soriano-Mas, Antonio Verdejo-García
International Journal of Obesity.2019; 43(3): 503. CrossRef - Motivation to eat and not to eat – The psycho-biological conflict in anorexia nervosa
Guido K.W. Frank, Marisa C. DeGuzman, Megan E. Shott
Physiology & Behavior.2019; 206: 185. CrossRef - Glucagon-Like Peptide-1 (GLP-1) and 5-Hydroxytryptamine 2c (5-HT2c) Receptor Agonists in the Ventral Tegmental Area (VTA) Inhibit Ghrelin-Stimulated Appetitive Reward
Erin Howell, Hannah Baumgartner, Lia Zallar, Joaquín Selva, Liv Engel, Paul Currie
International Journal of Molecular Sciences.2019; 20(4): 889. CrossRef - Oxytocin neurons: integrators of hypothalamic and brainstem circuits in the regulation of macronutrient-specific satiety
Catherine Hume, Gareth Leng
Current Opinion in Physiology.2019; 12: 65. CrossRef - Functional Interaction between the Dopamine and Melanocortin Systems of the Brain
K. V. Derkach, I. V. Romanova, A. O. Shpakov
Neuroscience and Behavioral Physiology.2018; 48(2): 213. CrossRef - The Leptin, Dopamine and Serotonin Receptors in Hypothalamic POMC-Neurons of Normal and Obese Rodents
Irina V. Romanova, Kira V. Derkach, Anastasiya L. Mikhrina, Ivan B. Sukhov, Elena V. Mikhailova, Alexander O. Shpakov
Neurochemical Research.2018; 43(4): 821. CrossRef - The intersection of stress and reward: BNST modulation of aversive and appetitive states
Sarah Ch'ng, Jingjing Fu, Robyn M. Brown, Stuart J. McDougall, Andrew J. Lawrence
Progress in Neuro-Psychopharmacology and Biological Psychiatry.2018; 87: 108. CrossRef - Localization of the dopamine receptors of types 1 and 2 on the bodies of POMC-expressing neurons of the arcuate nucleus of the hypothalamus in mice and rats
I. V. Romanova, A. L. Mikhrina, A. O. Shpakov
Doklady Biological Sciences.2017; 472(1): 11. CrossRef - The partial dopamine D2 receptor agonist aripiprazole is associated with weight gain in adolescent anorexia nervosa
Guido K. W. Frank, Megan E. Shott, Jennifer O. Hagman, Marissa A. Schiel, Marisa C. DeGuzman, Brogan Rossi
International Journal of Eating Disorders.2017; 50(4): 447. CrossRef - Rs12970134 near MC4R is associated with appetite and beverage intake in overweight and obese children: A family-based association study in Chinese population
Shuo Wang, Jieyun Song, Yide Yang, Nitesh V. Chawla, Jun Ma, Haijun Wang, Yiqing Song
PLOS ONE.2017; 12(5): e0177983. CrossRef
 PubReader
 Cite
Cite


