
Articles
- Page Path
- HOME > Endocrinol Metab > Volume 30(4); 2015 > Article
-
Original ArticleClinical Study Electrolyte Imbalance in Patients with Sheehan's Syndrome
- Chur Hoan Lim, Ji Hyun Han, Joon Jin, Ji Eun Yu, Jin Ook Chung, Dong Hyeok Cho, Dong Jin Chung, Min Young Chung
-
Endocrinology and Metabolism 2015;30(4):502-508.
DOI: https://doi.org/10.3803/EnM.2015.30.4.502
Published online: December 31, 2015
Department of Internal Medicine, Chonnam National University Medical School, Gwangju, Korea.
- Corresponding author: Jin Ook Chung. Division of Endocrinology and Metabolism, Department of Internal Medicine, Chonnam National University Medical School, 42 Jebong-ro, Dong-gu, Gwangju 61469, Korea. Tel: +82-62-220-6296, Fax: +82-62-225-8578, imagine-jjo@hanmail.net
• Received: March 3, 2015 • Revised: July 29, 2015 • Accepted: August 24, 2015
Copyright © 2015 Korean Endocrine Society
This is an Open Access article distributed under the terms of the Creative Commons Attribution Non-Commercial License (http://creativecommons.org/licenses/by-nc/3.0/) which permits unrestricted non-commercial use, distribution, and reproduction in any medium, provided the original work is properly cited.
ABSTRACT
-
Background
- We investigated the prevalence of electrolyte imbalance and the relationship between serum electrolyte and anterior pituitary hormone levels in patients with Sheehan's syndrome.
-
Methods
- In a retrospective study, we investigated 78 patients with Sheehan's syndrome. We also included 95 normal control subjects who underwent a combined anterior pituitary hormone stimulation test and showed normal hormonal responses.
-
Results
- In patients with Sheehan's syndrome, the serum levels of sodium, potassium, ionized calcium, magnesium, and inorganic phosphate were significantly lower than those in control subjects. The prevalence of hyponatremia, hypokalemia, hypocalcemia, hypomagnesemia, and hypophosphatemia in patients with Sheehan's syndrome was 59.0% (n=46), 26.9% (n=21), 35.9% (n=28), 47.4% (n=37), and 23.1% (n=18), respectively. Levels of sodium and ionized calcium in serum were positively correlated with levels of all anterior pituitary hormones (all P<0.05). Levels of potassium in serum were positively correlated with adrenocorticotrophic hormone (ACTH) and growth hormone (GH) levels (all P<0.05). Levels of inorganic phosphate in serum were positively correlated with levels of thyroid-stimulating hormone, prolactin, and GH (all P<0.05), and levels of magnesium in serum were positively correlated with delta ACTH (P<0.01).
-
Conclusion
- Electrolyte imbalance was common in patients with Sheehan's syndrome. Furthermore, the degree of anterior pituitary hormone deficiency relates to the degree of electrolyte disturbance in patients with this disease.
- First reported in 1948 by British pathologist Harold Leeming Sheehan, the eponymous Sheehan's syndrome is defined as hypopituitarism that occurs during or directly after childbirth due to blood loss, resulting in pituitary gland necrosis from decreased arterial perfusion of the pituitary gland [1]. In the 1960s, the prevalence of Sheehan's syndrome was 100 to 200 per one million people [2]. In 2001, Tomlinson et al. [3] reported that less than 1% of 1,014 hypopituitarism patients were diagnosed with Sheehan's syndrome. Furthermore, Regal et al. [4] reported that hypopituitarism affected 455 people in a sample size of approximately one million, and about 6% of the affected people were diagnosed with Sheehan's syndrome.
- The clinical symptoms of Sheehan's syndrome may develop in various ways according to the type and degree of hormone deficiency [56]. Early diagnosis and treatment of Sheehan's syndrome is critical, as it can lead to from severe fatigue and decreased energy to coma or even death [5]. However, many patients often receive prolonged inadequate treatment due to the differences in disease duration and symptoms, and several symptoms observed in patients with Sheehan's syndrome are associated with electrolyte imbalance, such as hyponatremia [78]. Although anterior pituitary hormones are known to affect serum electrolyte levels, insufficient information is available about serum electrolyte levels in patients with Sheehan's syndrome. Therefore, this study investigated the association between serum electrolyte levels and the incidence of anterior pituitary hormones and electrolyte imbalance in patients with Sheehan's syndrome.
INTRODUCTION
- Study subjects
- The study enrolled 78 patients newly diagnosed with Sheehan's syndrome and 95 patients in a control group from 1995 to 2014 at Chonnam National University Hospital.
- Sheehan's syndrome was diagnosed based on: (1) heavy bleeding during the most recent childbirth along with postpartum lactation failure or premature menopause based on the medical history; (2) a lack of one or more anterior pituitary hormones; and/or (3) an empty sella on pituitary magnetic resonance imaging [6]. Patients who received radiotherapy to the skull or had head trauma or surgery that might affect the pituitary gland were excluded, as were patients with liver disease, kidney disease, heart failure, and/or who were taking medications known to affect electrolyte levels, including diuretics, calcium agents, vitamin D, and osteoporosis medication.
- Patients who did not have a proven pituitary hormone deficiency based on combined pituitary stimulation testing at the time of admittance for pituitary tumor diagnosis were included in this study as the control group.
- Methods
- Patient age and associated diseases at the time of diagnosis of Sheehan's syndrome were analyzed. Patient height and weight were used to calculate body mass index (BMI, kg/m2).
- Hemoglobin, creatinine, sodium (reference value, 136 to 146 mEq/L), potassium (reference value, 3.5 to 5.1 mEq/L), calcium (reference value, 8.4 to 10.2 mg/dL), ionized calcium (reference value, 2.2 to 2.6 mEq/L), magnesium (reference value, 1.9 to 2.5 mg/dL), and phosphate (reference value, 2.5 to 5.5 mg/dL) levels were measured using blood samples taken immediately after admission. Total cholesterol, low density lipoprotein cholesterol, high density lipoprotein cholesterol, triglyceride, and glycated hemoglobin levels were measured using blood samples obtained after fasting at least 8 hours. The hormone response was measured with a combined pituitary stimulation test after fasting at least 8 hours while lying down for at least 15 minutes to measure the baseline levels of growth hormone, corticotropin, luteinizing hormone, follicle-stimulating hormone, thyroid-stimulating hormone, prolactin, free thyroxine, and cortisol, along with a blood sugar test. Blood sugar, prolactin, luteinizing hormone, follicle-stimulating hormone, thyroid-stimulating hormone, and corticotropin levels were measured by collecting blood samples 15, 30, 60, 90, and 120 minutes after intravenous injections of 0.1 U/kg of rapid-acting insulin, 500 µg of thyrotropin-releasing hormone, and 100 µg of luteinizing-hormone-releasing hormone mixed in 5 mL of a saline solution [9]. Normal reactions to the combined pituitary stimulation tests were defined as follows: a prolactin level of 2 µg/L or more with an increase exceeding 200% above the baseline value; a thyroid-stimulating hormone level increase exceeding 5 mU/L above the baseline value; a luteinizing hormone level increase exceeding 10 IU/L above the baseline value; a follicle-stimulating hormone level increase exceeding 2 IU/L above the baseline value; a growth hormone level of at least 3 µg/dL when the glucose level was 40 mg/dL or less; and a cortisol level increase of at least 7 µg/dL or a cortisol level of 20 µg/dL or more when the glucose level was 40 mg/dL or less [9]. Delta values were determined by subtracting the basal hormone levels from the highest values of anterior pituitary hormone responses to stimuli.
- Statistical analysis
- Data are expressed as median values (interquartile range) or percentages. The Mann-Whitney test was used to compare continuous variables between the two groups, and the chi-square test or Fisher exact test was used to compare categorical variables. Spearman's rank correlation analysis was used to analyze the relationships between electrolyte concentrations and the respective hormones. SPSS version 19.0 (IBM Co., Armonk, NY, USA) was used for statistical analyses, and the level of statistical significance was defined as P<0.05.
METHODS
- At the time of Sheehan's syndrome diagnosis, the median patient age was 54.0 years and the median BMI was 22.0 kg/m2 (Table 1). At the time of admittance, 14 patients (17.9%) had clouding of consciousness, three patients (3.8%) were comatose, three (3.8%) had hypoglycemia with glucose less than 55 mg/dL, and 10 patients (12.8%) had an accompanying infection. The median age at menopause was 33.0 years; lactation failure was observed in 73 patients (93.6%); and no patient had diabetes insipidus. Additionally, completely and partially empty sellae were observed in 47 patients (60.3%) and 31 (39.7%), respectively.
- Compared to the controls, Sheehan's syndrome patients had significantly lower BMI, hemoglobin, serum sodium, potassium, ionized calcium, magnesium, phosphate, and osmolality, and significantly higher serum creatinine and low density lipoprotein cholesterol higher (Table 2).
- In the combined pituitary stimulation tests, no patient reacted to growth hormones, while no reactions were observed for follicle-stimulating and luteinizing hormones in 74 patients (94.9%), prolactin in 74 patients (94.9%), corticotropin in 71 patients (91.0%), and thyroid-stimulating hormones in 69 patients (88.5%) (Fig. 1).
- The following electrolyte imbalances were observed in patients with Sheehan's syndrome: hyponatremia, 46 patients (59.0%); hypokalemia, 21 patients (26.9%); hypocalcemia, 28 patients (35.9%); hypomagnesemia, 37 patients (47.4%); and hypophosphatemia, 18 patients (23.1%) (Fig. 2). The median electrolyte levels (interquartile range) in patients with Sheehan's syndrome accompanying electrolyte imbalance were 119.0 mEq/L (113.3 to 130.0) for sodium, 3.2 mEq/L (3.1 to 3.4) for potassium, 7.7 mg/dL (7.5 to 8.0) for calcium, 2.0 mEq/L (1.9 to 2.1) for ionized calcium, 1.7 mg/dL (1.5 to 1.8) for magnesium, and 1.8 mg/dL (1.2 to 2.0) for phosphate.
- Positive correlations of the serum sodium and ionized calcium levels were observed with thyroid-stimulating hormone, free thyroxine, corticotropin, cortisol, growth hormone, prolactin, and gonadotropin (Table 3). Serum potassium levels were positively correlated with corticotropin, cortisol, and growth hormone. Inorganic phosphate levels were positively correlated with thyroid-stimulating hormone, growth hormone, and prolactin and serum magnesium levels were positively correlated with delta corticotropin and delta cortisol.
RESULTS
- In this study, serum sodium, potassium, ionized calcium, magnesium, and phosphate levels were significantly lower in Sheehan's syndrome patients compared to the controls. In terms of electrolyte imbalance, hyponatremia was most commonly observed in Sheehan's syndrome patients at the time of diagnosis, with hypomagnesemia, hypocalcemia, hypokalemia, and hypophosphatemia observed in descending frequency.
- Although the pathophysiology of Sheehan's syndrome remains unclear, a pituitary gland enlarged due to estrogen during pregnancy leads to excessive bleeding during childbirth, rendering the pituitary gland sensitive to ischemic change and subsequent ischemic necrosis leading to the development of Sheehan's syndrome [1]. Furthermore, autoimmune processes involving anti-pituitary or anti-hypothalamus antibodies reportedly affect the pituitary gland or hypothalamus cells [10].
- Postpartum lactation failure and premature menopause are frequently observed in cases of Sheehan's syndrome [5]; most patients in this study had postpartum lactation failure, and the median age at menopause was 33 years. Other studies have examined the incidence of anterior pituitary hormone deficiency in Sheehan's syndrome. In a sample of 20 patients, Dokmetas et al. [8] observed growth hormone, prolactin, and follicle-stimulating and luteinizing hormone deficiencies in all patients, and thyroid-stimulating hormone and corticotropin deficiencies in 18 patients (90%) and 11 (55%), respectively. In a sample of 18 Sheehan's syndrome patients, Lee et al. [11] observed blunted responses to combined pituitary stimulation tests in 15 patients (83.3%) to growth hormone, 16 patients (88.9%) to corticotropin, 15 patients (83.3%) to thyroid-stimulating hormone, and 14 patients to (77.8%) prolactin, and reported that most patients did not respond to follicle-stimulating or luteinizing hormones. In our study, no patient reacted to growth hormone, while reactions were deficient for follicle-stimulating and luteinizing hormones in 94.9%, prolactin in 94.9%, corticotropin in 91.0%, and thyroid-stimulating hormone in 88.5% of the patients. This is probably because growth hormone cells are in the anatomical location in the pituitary gland most vulnerable to ischemic necrosis [12]. The differences in the incidence of anterior pituitary deficiency in various studies is probably due to the different times to the diagnosis of Sheehan's syndrome in each study, because pituitary gland necrosis occurs over a long period.
- In this study, hyponatremia was the most common electrolyte abnormality in Sheehan's syndrome. Hyponatremia may cause weakness, nausea, and vomiting, and it can even result in altered consciousness or death [13]. Dokmetas et al. [8] observed hyponatremia in 35% of patients with Sheehan's syndrome, while Sert et al. [14] reported hyponatremia in 32% of patients with the condition. Hyponatremia can be caused by inappropriate antidiuretic hormone secretions in a normal blood volume [13]; in our study, serum sodium levels were significantly positively correlated with thyroid and thyroid-stimulating hormones and corticotropin and cortisol. This finding suggests that thyroid hormone and cortisol reductions are related to serum sodium reductions in patients with Sheehan's syndrome. Moreover, serum sodium levels were significantly positively correlated with growth hormone, prolactin, follicle-stimulating, and luteinizing hormone levels in our study. Growth hormone directly increases sodium reabsorption in the renal tubules and is involved in sodium uptake via the renin-angiotensin-aldosterone system [1516]. Greenlee et al. [17] discovered that prolactin promotes sodium transport in renal epithelial cells, suggesting that prolactin also affects sodium and fluid balances. Estrogen has been reported to affect arginine vasopressin secretion and promote sodium retention [18]. Although we cannot demonstrate a causal relationship between anterior pituitary hormones and serum sodium levels in this study, there are signs that, in addition to thyroid and thyroid-stimulating hormones and corticotropin and cortisol, anterior pituitary hormones and their target hormones may be associated with serum sodium levels directly or indirectly. Prolactin receptors play an important role in calcium homeostasis and bone formation [19], and thyroid hormones act directly on bone cells to increase the liquidity of bone minerals and are associated with urinary excretions of calcium [20]. Additionally, growth hormone reduces urinary potassium excretions [16]. Furthermore, Beshyah et al. [21] reported increases in serum calcium in hypopituitarism patients after 6 months of growth hormone treatments. Although various electrolyte imbalances have been predicted in Sheehan's syndrome patients with anterior pituitary hormone deficiencies, little is known about the electrolyte imbalances other than the relevance of serum sodium levels. In our study, in addition to low serum sodium levels, patients with Sheehan's syndrome had significantly lower serum potassium, ionized calcium, magnesium, and phosphate levels compared to the controls, and these electrolyte deficiencies were each observed in more than 20% of the patients. Nunoda et al. [22] reported that hypomagnesemia improved after cortisone treatments where it accompanied Sheehan's syndrome, and observed significant correlations between serum magnesium levels and delta adrenocorticotropic hormone and cortisol levels. Significant positive correlations were also observed between the serum ionized calcium levels and all anterior pituitary hormones; between serum potassium levels and adrenocorticotropic hormone, cortisol, and growth hormone levels; and between serum phosphate levels and thyroid-stimulating hormone, growth hormone, and prolactin levels. Together, these findings and those of previous studies suggest that the electrolyte imbalances observed in Sheehan's syndrome patients are related to anterior pituitary hormone deficiencies. Additional research is needed to elucidate a direct relationship or mechanism between anterior pituitary hormones and electrolyte levels in patients with Sheehan's syndrome.
- In conclusion, various electrolyte imbalances can be observed in Sheehan's syndrome. Considering the slow onset of the condition, which is still diagnosed clinically, Sheehan's syndrome must be considered a possible cause of electrolyte imbalance.
DISCUSSION
-
Acknowledgements
- This study was supported by research fund of Honam Branch of Korean Endocrine Society.
ACKNOWLEDGMENTS
-
CONFLICTS OF INTEREST: No potential conflict of interest relevant to this article was reported.
Article information
- 1. Sheehan HL. Post-partum necrosis of the anterior pituitary. Ir J Med Sci 1948;241–255. ArticlePubMedPDF
- 2. Sheehan HL. The frequency of post-partum hypopituitarism. J Obstet Gynaecol Br Commonw 1965;72:103–111. ArticlePubMed
- 3. Tomlinson JW, Holden N, Hills RK, Wheatley K, Clayton RN, Bates AS, et al. Association between premature mortality and hypopituitarism. West Midlands Prospective Hypopituitary Study Group. Lancet 2001;357:425–431. ArticlePubMed
- 4. Regal M, Paramo C, Sierra SM, Garcia-Mayor RV. Prevalence and incidence of hypopituitarism in an adult Caucasian population in northwestern Spain. Clin Endocrinol (Oxf) 2001;55:735–740. ArticlePubMed
- 5. Kovacs K. Sheehan syndrome. Lancet 2003;361:520–522. ArticlePubMed
- 6. Kelestimur F. Sheehan's syndrome. Pituitary 2003;6:181–188. ArticlePubMed
- 7. Boulanger E, Pagniez D, Roueff S, Binaut R, Valat AS, Provost N, et al. Sheehan syndrome presenting as early post-partum hyponatraemia. Nephrol Dial Transplant 1999;14:2714–2715. ArticlePubMedPDF
- 8. Dokmetas HS, Kilicli F, Korkmaz S, Yonem O. Characteristic features of 20 patients with Sheehan's syndrome. Gynecol Endocrinol 2006;22:279–283. ArticlePubMed
- 9. Melmed S, Jameson JL. Chapter 339, Disorders of the anterior pituitary and hypothalamus. Harrison's principles of internal medicine; 18th ed. New York: McGraw-Hill; 2012. p. 2876–2902.
- 10. De Bellis A, Kelestimur F, Sinisi AA, Ruocco G, Tirelli G, Battaglia M, et al. Anti-hypothalamus and anti-pituitary antibodies may contribute to perpetuate the hypopituitarism in patients with Sheehan's syndrome. Eur J Endocrinol 2008;158:147–152. ArticlePubMed
- 11. Lee BK, Shin DB, Kim SW, Yang IM, Kim JW, Kim YS, et al. The combined pituitary stimulation test in Sheehan's syndrome. Korean J Med 1987;33:36–43.
- 12. Kilicli F, Dokmetas HS, Acibucu F. Sheehan's syndrome. Gynecol Endocrinol 2013;29:292–295. ArticlePubMed
- 13. Smith DM, McKenna K, Thompson CJ. Hyponatraemia. Clin Endocrinol (Oxf) 2000;52:667–678. ArticlePubMed
- 14. Sert M, Tetiker T, Kirim S, Kocak M. Clinical report of 28 patients with Sheehan's syndrome. Endocr J 2003;50:297–301. ArticlePubMed
- 15. Hansen TK, Moller J, Thomsen K, Frandsen E, Dall R, Jorgensen JO, et al. Effects of growth hormone on renal tubular handling of sodium in healthy humans. Am J Physiol Endocrinol Metab 2001;281:E1326–E1332. ArticlePubMed
- 16. Dimke H, Flyvbjerg A, Frische S. Acute and chronic effects of growth hormone on renal regulation of electrolyte and water homeostasis. Growth Horm IGF Res 2007;17:353–368. ArticlePubMed
- 17. Greenlee MM, Mitzelfelt JD, Duke BJ, Al-Khalili O, Bao HF, Eaton DC. Prolactin stimulates sodium and chloride ion channels in A6 renal epithelial cells. Am J Physiol Renal Physiol 2015;308:F697–F705. ArticlePubMedPMC
- 18. Stachenfeld NS, Keefe DL. Estrogen effects on osmotic regulation of AVP and fluid balance. Am J Physiol Endocrinol Metab 2002;283:E711–E721. ArticlePubMed
- 19. Klibanski A, Greenspan SL. Increase in bone mass after treatment of hyperprolactinemic amenorrhea. N Engl J Med 1986;315:542–546. ArticlePubMed
- 20. Pantazi H, Papapetrou PD. Changes in parameters of bone and mineral metabolism during therapy for hyperthyroidism. J Clin Endocrinol Metab 2000;85:1099–1106. ArticlePubMedPDF
- 21. Beshyah SA, Thomas E, Kyd P, Sharp P, Fairney A, Johnston DG. The effect of growth hormone replacement therapy in hypopituitary adults on calcium and bone metabolism. Clin Endocrinol (Oxf) 1994;40:383–391. ArticlePubMed
- 22. Nunoda S, Ueda K, Kameda S, Nakabayashi H. Sheehan's syndrome with hypomagnesemia and polymorphous ventricular tachycardia. Jpn Heart J 1989;30:251–256. ArticlePubMed
References
Fig. 1

Prevalence of hormone deficiencies in patients with Sheehan's syndrome. GH, growth hormone; PRL, prolactin; FSH, follicle-stimulating hormone; LH, luteinizing hormone; TSH, thyroid-stimulating hormone; ACTH, adrenocorticotrophic hormone.
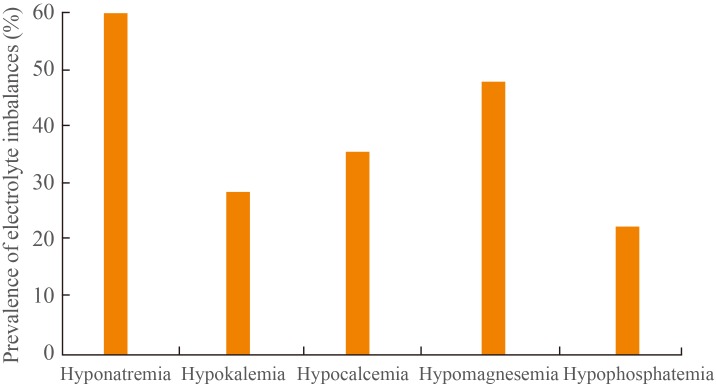
Table 1
![enm-30-502-i001.jpg]()
Clinical Features of Patients with Sheehan's Syndrome
Table 2
![enm-30-502-i002.jpg]()
Characteristics of Patients with Sheehan's Syndrome and Control Subjects
Table 3
![enm-30-502-i003.jpg]()
Correlation between Hormone Levels and Electrolytes in the Study Subjects
Figure & Data
References
Citations
Citations to this article as recorded by 
- Myopathic syndrome revealing a rare condition: Sheehan syndrome, a case-based review
Elena Gradinaru, Catalin Furculescu, Andreea Trandafir, Daniela Opris-Belinski, Ioana Cristina Saulescu
Clinical Rheumatology.2023; 42(6): 1705. CrossRef - Partial Sheehan’s syndrome with abdominal tuberculosis presented with pancytopenia and fluctuating thyroid profile: a case report
Prashant Yadav, Md Anwarul Bari, Akash Saha, Sushmita Yadav, Amzad H. Khan
Annals of Medicine & Surgery.2023; 85(3): 548. CrossRef - Acute pituitary crisis after lumbar surgery: A case report
Hui Wang, Xingrui Gong
Medicine.2023; 102(48): e36294. CrossRef - Long-term hepatic and cardiac health in patients diagnosed with Sheehan’s syndrome
Liza Das, Jayaprakash Sahoo, Neelam Dahiya, Sunil Taneja, Sanjay Kumar Bhadada, Mohammad Hayat Bhat, Paramjeet Singh, Vanita Suri, Bashir Ahmad Laway, Pinaki Dutta
Pituitary.2022; 25(6): 971. CrossRef - Clinical, endocrine, metabolic profile, and bone health in Sheehan's syndrome
Soumita Mandal, Pradip Mukhopadhyay, Mainak Banerjee, Sujoy Ghosh
Indian Journal of Endocrinology and Metabolism.2020; 24(4): 338. CrossRef - A rare endocrine cause of electrical storm - a case report
Sunny D Shinde, Girish R Sabnis, Charan P Lanjewar, Prafulla G Kerkar
European Heart Journal - Case Reports.2017;[Epub] CrossRef - Sheehan syndrome
Züleyha Karaca, Bashir A. Laway, Hatice S. Dokmetas, Hulusi Atmaca, Fahrettin Kelestimur
Nature Reviews Disease Primers.2016;[Epub] CrossRef
 PubReader
 Cite
Cite


