Articles
- Page Path
- HOME > Endocrinol Metab > Volume 30(3); 2015 > Article
-
Case ReportAcromegaly with Normal Insulin-Like Growth Factor-1 Levels and Congestive Heart Failure as the First Clinical Manifestation
- Hyae Min Lee1, Sun Hee Lee1, In-Ho Yang1, In Kyoung Hwang1, You Cheol Hwang1, Kyu Jeung Ahn1, Ho Yeon Chung1, Hui-Jeong Hwang2, In-Kyung Jeong1
-
Endocrinology and Metabolism 2014;30(3):395-401.
DOI: https://doi.org/10.3803/EnM.2015.30.3.395
Published online: December 9, 2014
1Department of Endocrinology and Metabolism, Kyung Hee University Hospital at Gangdong, Kyung Hee University School of Medicine, Seoul, Korea.
2Department of Cardiology, Kyung Hee University Hospital at Gangdong, Kyung Hee University School of Medicine, Seoul, Korea.
- Corresponding author: In-Kyung Jeong. Department of Endocrinology and Metabolism, Kyung Hee University Hospital at Gangdong, Kyung Hee University School of Medicine, 892 Dongnam-ro, Gangdong-gu, Seoul 05278, Korea. Tel: +82-2-440-6118, Fax: +82-2-440-6295, jik1016@dreamwiz.com
• Received: August 11, 2014 • Revised: September 13, 2014 • Accepted: September 29, 2014
Copyright © 2015 Korean Endocrine Society
This is an Open Access article distributed under the terms of the Creative Commons Attribution Non-Commercial License (http://creativecommons.org/licenses/by-nc/3.0/) which permits unrestricted non-commercial use, distribution, and reproduction in any medium, provided the original work is properly cited.
ABSTRACT
- The leading cause of morbidity and mortality in patients with acromegaly is cardiovascular complications. Myocardial exposure to excessive growth hormone can cause ventricular hypertrophy, hypertension, arrhythmia, and diastolic dysfunction. However, congestive heart failure as a result of systolic dysfunction is observed only rarely in patients with acromegaly. Most cases of acromegaly exhibit high levels of serum insulin-like growth factor-1 (IGF-1). Acromegaly with normal IGF-1 levels is rare and difficult to diagnose. Here, we report a rare case of an acromegalic patient whose first clinical manifestation was severe congestive heart failure, despite normal IGF-1 levels. We diagnosed acromegaly using a glucose-loading growth hormone suppression test. Cardiac function and myocardial hypertrophy improved 6 months after transsphenoidal resection of a pituitary adenoma.
- Acromegaly is caused by excessive growth hormone (GH) secretion and secondary elevation of insulin-like growth factor-1 (IGF-1). The annual incidence of acromegaly is three cases per million individuals. Cardiovascular manifestations such as hypertension, arrhythmia, coronary artery disease, atherosclerosis, and congestive heart failure (CHF) cause 60% of the deaths in affected patients [1]. However, cardiovascular disease is rarely the first clinical manifestation of acromegalic patients. In addition, left ventricular (LV) systolic dysfunction is extremely rare, and occurs in less than 3% of cases [2]. The current case manifested with CHF as a result of severe systolic dysfunction in acromegaly.
- Because GH secretion is pulsatile, elevated serum IGF-1 levels are a useful screening tool for acromegaly. However, IGF-1 levels vary according to age, gender, and estrogen therapy and are suppressed in some conditions, such as hepatic disease, malnutrition, and poorly controlled diabetes mellitus [34]. When serum IGF-1 levels are normal, it is easy to misdiagnose acromegaly without a GH suppression test. We recently encountered an unusual case of an acromegalic patient who had normal IGF-1 levels and severe CHF as the first clinical manifestation. Therefore, we report this case with a literature review.
INTRODUCTION
- A 47-year-old female visited our cardiology clinic due to dyspnea that had been progressive over the previous few months. The patient complained of resting dyspnea and peripheral pitting edema. She had no prior medical history or family history of cardiovascular disease. On physical examination, her height was 160 cm and body weight was 70 kg. Her blood pressure was 230/145 mm Hg, and her heart rate was 100 beats per minute. Auscultation of the chest revealed a coarse breathing sound with crackling and regular heart beats with no murmur. The liver and spleen were not palpable, and her bowel sounds were normal.
- A blood examination revealed a 7,200/mm3 leukocyte count, 16.5 g/dL hemoglobin, a 274,000/mm3 platelet count, 296 mg/dL random glucose, 8.3% hemoglobin A1c (HbA1c), 28 mg/dL blood urea nitrogen, 1.5 mg/dL creatinine, 7.0 g/dL protein, 3.6 g/dL albumin, 33 IU/L aspartate aminotransferase, 24 IU/L alanine aminotransferase, 292 IU/L alkaline phosphatase, 2.58 mg/L high-sensitivity C-reactive protein, 248 mg/dL total cholesterol, 111 mg/dL triglycerides, 41 mg/dL high density lipoprotein, 181 mg/dL low density lipoprotein, 136 mmol/L sodium, and 4.2 mmol/L potassium. The results of a routine urinalysis were as follows: proteinuria, 2+; glycosuria, 2+; red blood cell, 0 to 1/high power field (HPF) and white blood cell, 5 to 9/HPF; and spot urine protein to creatinine ratio, 428 mg/g. A thyroid function test (TFT) revealed 88 ng/dL T3 (normal range, 78 to 182), 1.44 ng/dL free T4 (normal range, 0.8 to 1.78), and 9.86 mIU/L thyroid stimulating hormone (normal range, 0.17 to 4.05). The TFT results showed subclinical hypothyroidism, but thyroid autoantibodies were negative.
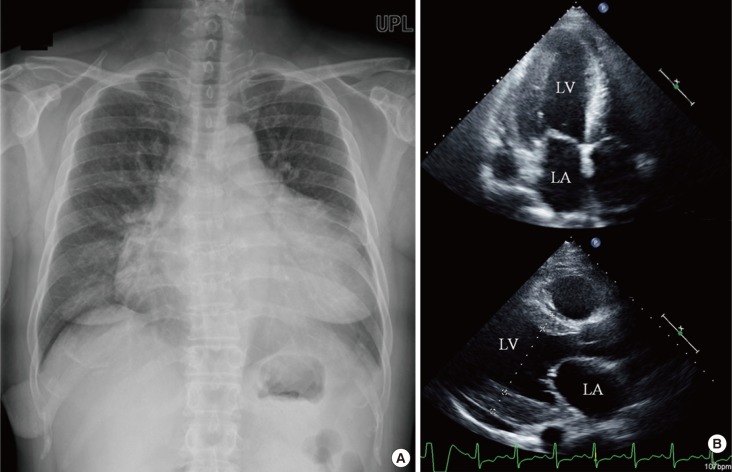
- Cardiomegaly was detected on a chest radiograph, and the cardiothoracic ratio was 66% (Fig. 1A). The electrocardiogram showed inverted T waves in the lateral and inferior leads, with no significant ST changes. A transthoracic echocardiogram revealed LV hypertrophy and severe systolic dysfunction (Fig. 1B). The interventricular septal diameter was 1.3 cm, the LV posterior wall diameter was 1.8 cm, the LV internal diameter in diastole was 5.8 cm (normal range, 3.9 to 5.3), the LV internal diameter in systole was 5.1 cm (normal range, 2.1 to 4.0), and the left ventricular ejection fraction (LVEF) was 25% (Table 1). Coronary angiography was performed, and the results were normal.
- The patient was treated with multiple antihypertensive drugs, including calcium channel blockers, diuretics, angiotensin converting enzyme inhibitors, and β-blockers to control a hypertensive crisis, but her blood pressure remained >160/100 mm Hg. Abdominal computed tomography was performed to evaluate secondary hypertension, which revealed no abnormalities in either the renal arteries or adrenal glands.
- To manage diabetes mellitus, she was referred to Department of Endocrinology and Metabolism at Kyung Hee University Hospital at Gangdong. Because the patient had uncontrolled hypertension, newly diagnosed diabetes mellitus, and soft tissue and bone overgrowth, a diagnosis of acromegaly was suspected. Rough and thick skin was observed, and skin tags were noted around the neck. An enlarged jaw and protruded frontal bones were observed, and soft tissue overgrowth of the heel was noted on a lateral view of a foot X-ray (Fig. 2). The basal IGF-1 level was measured as 183.8 ng/mL, which was within the normal range (90 to 360). Acromegaly was diagnosed after performing a 75-g glucose-loading GH suppression test (Table 2). In a thyrotropin-releasing hormone stimulation test, GH levels were found to be increased (Table 2). MRI of the sella revealed a 5-mm microadenoma on the left side of the pituitary gland (Fig. 3). A combined pituitary stimulation test performed before surgery revealed that both basal and stimulated hormone levels were normal.
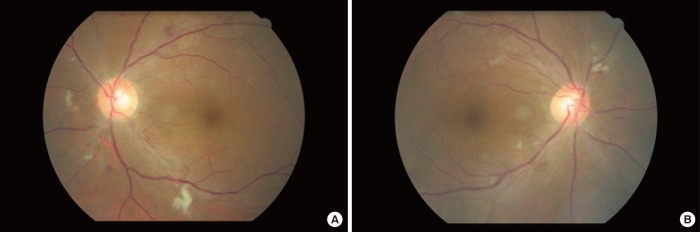
- Hyperglycemia was treated with 500 mg metformin twice a day and 12 U insulin glargine once a day via subcutaneous injection. We performed a diabetic complication test, and fundoscopy showed severe nonproliferative diabetic retinopathy (Fig. 4).
- Three weeks after admission, combination antihypertensive therapy caused a reduction in blood pressure to <140/80 mm Hg. A follow-up echocardiogram showed no significant difference in LV hypertrophy, but LVEF was improved to 66% (Table 1).
- After transsphenoidal resection of the pituitary tumor, the tumor was identified as a GH-secreting adenoma (Fig. 5A) that showed strong staining with anti-GH antibodies in immunohistochemical analysis (Fig. 5B).
- We performed a follow-up 75-g glucose-loading GH suppression test 2 weeks after surgery, and GH levels were suppressed to 0.15 ng/mL, which means cure state (Table 2). The levels of GH and IGF-1 were 0.57, 243.7 ng/mL on postoperative day (POD) 3, 0.38, 295.4 ng/mL on POD 50, and 0.4, 249.5 ng/mL 6 months after surgery (Table 3). A follow-up transthoracic echocardiography 6 months after surgery revealed improved LV hypertrophy and LVEF compared with preoperative values.
- The patient was prescribed calcium channel blockers and angiotensin-receptor blockers. Her blood pressure was maintained at 120/70 mm Hg 1 year after surgery. Her blood glucose levels were well controlled, with an HbA1c of 5.4%, using only 500 mg/day metformin without insulin. The degree of diabetic retinopathy was improved somewhat, and the patient was followed-up at the outpatient clinic.
CASE REPORT
- We presented a case with severe CHF and poorly controlled hypertension suggestive of secondary hypertension. The patient was diagnosed with acromegaly according to newly diagnosed diabetes, clinical manifestations, and a glucose-loading GH suppression test, despite normal IGF-1 levels. She showed improved heart failure, hypertension, and diabetes after resection of the pituitary adenoma. Acromegaly is a disease associated with GH over-secretion and exhibits a high mortality rate due to complications such as cardiovascular disease (60%), respiratory disease (25%), or malignant neoplasms (15%). Arrhythmia (48%), hypertension (35%), and valvular heart disease (22%) are the major cardiovascular manifestations, but heart failure is a relatively rare complication (<1% to 3%) [5].
- In the current case, one unusual fact was that the acromegalic patient presented with severe dyspnea as the first chief complaint because of severe systolic LV dysfunction. Approximately 66% of acromegalic patients show concentric LV hypertrophy, but only 1% to 3% of patients present with heart failure symptoms, such as exertional dyspnea, as their initial manifestation. Moreover, 3 weeks after normalization of blood pressure, the LVEF recovered from 25% to 66%, although structural abnormalities, such as concentric LV hypertrophy, remained. The LV mass index, which reflects concentric hypertrophy, recovered 6 months after the surgery (Table 1). In acromegaly, myocardial hypertrophy is more common than ventricular dilatation and is associated with high cardiac output; it rarely develops to CHF with severe systolic dysfunction [2]. Most cases of cardiovascular mortality in acromegaly is due to other complications such as arrhythmia and valvular heart disease, which present before LV systolic dysfunction is revealed. One case of acromegaly with dilated cardiomyopathy was reported in Korea [5], but no cases of marked LV enlargement or hypertrophy with severe LV dysfunction have been reported. Therefore, this is the first clinical report in Korea of simultaneous CHF with severe LV systolic dysfunction as the first clinical manifestation of acromegaly.
- Previous studies showed a reversal in cardiac function after the surgical removal of a pituitary tumor or somatostatin therapy [67]. In a recent report by Bihan et al. [2], 3% of acromegalic patients manifested CHF of unclear cause. Among those, one case was similar to the current case, whose blood pressure normalization led to improved LVEF (from 40% to 68%) and amelioration of LV dilatation. This suggests that the hypertensive urgency revoked congestive heart disease with impaired systolic function. In a study performed in India, six of 150 patients (4%) with acromegaly presented with overt CHF. The authors concluded that GH and IGF-1 were the causes of the myocardial hypertrophy, because the cardiac manifestations reversed after GH and IGF-1 levels were normalized [8].
- In the current case, blood pressure was normalized using combination therapy with an antihypertensive regimen of angiotensin receptor blockers, a β-antagonist, diuretics, calcium channel blockers, and α-blockers. This regimen improved the LVEF, and even though there was no immediate change in the LV hypertrophy, it recovered 6 months after surgical resection of the GH-producing tumor. This suggests that not only hypertension itself but also over-secretion of GH or IGF-1 contributed to the development of severe LV hypertrophy.
- The second unusual aspect of this case was the normal IGF-1 levels exhibited. If we had not performed the glucose-loading GH suppression test, we might have misdiagnosed this case using only IGF-1 screening. Previous studies revealed that certain conditions, such as malnutrition, hepatic dysfunction, uncontrolled diabetes, inflammatory diseases, renal dysfunction, and malignant neoplasm, might result in reduced IGF-1 levels [7]. In particular, IGF-1 synthesis is inhibited in acromegalic patients with uncontrolled type 1 diabetes or type 2 diabetes, and thus such patients might present with normal IGF-1 levels. After controlling glucose metabolism, elevated IGF-1 levels were observed. There are two case reports of acromegaly with normal IGF-1 levels: one in Korea and one in Japan [34]. In the current case, malnutrition, hepatic congestion due to heart failure, and poorly controlled diabetes might have contributed to the normal IGF-1 levels. After resection of the pituitary adenoma, glucose levels recovered to norma levels, and IGF-1 levels were elevated slightly from 183.8 to 249.5 ng/mL. These data suggest that further studies are needed regarding the association between IGF-1 levels and markers of glucose metabolism such as HbA1c.
- The third rare aspect of the current case was the severe nonproliferative retinopathy manifested (Fig. 3). In secondary diabetes caused by over-secretion of hormones that counter-regulate insulin, such as in Cushing syndrome and acromegaly, retinopathy is relatively mild [9]. The association between serum IGF-1 levels and diabetic retinopathy is controversial. One report found no significant association between serum IGF-1 levels and diabetic retinopathy [10], whereas another study revealed abundant GH and IGF-1 receptors in retinal vessels [11]. In the current case, severe nonproliferative diabetic retinopathy was presented at first diagnosis and improved to a certain degree after resection of the pituitary adenoma. This might have resulted from proper control of the hyperglycemia and severe hypertension, although removal of the hyperstimulation by GH and IGF-1 might also have contributed to the amelioration of diabetic retinopathy.
- In conclusion, we reported an atypical case of an acromegalic patient with CHF with LV systolic dysfunction as the first clinical manifestation, normal IGF-1 levels, and severe nonproliferative diabetic retinopathy. These symptoms were improved by resection of the GH-producing pituitary adenoma. This case suggests that the presence of severe heart failure with normal serum IGF-1 levels cannot exclude a diagnosis of acromegaly, particularly when the patient present with typical acromegalic features, poorly controlled hypertension, and diabetes mellitus.
DISCUSSION
-
CONFLICTS OF INTEREST: No potential conflict of interest relevant to this article was reported.
Article information
- 1. Mosca S, Paolillo S, Colao A, Bossone E, Cittadini A, Iudice FL, et al. Cardiovascular involvement in patients affected by acromegaly: an appraisal. Int J Cardiol 2013;167:1712–1718. ArticlePubMed
- 2. Bihan H, Espinosa C, Valdes-Socin H, Salenave S, Young J, Levasseur S, et al. Long-term outcome of patients with acromegaly and congestive heart failure. J Clin Endocrinol Metab 2004;89:5308–5313. ArticlePubMed
- 3. Lim DJ, Kwon HS, Cho JH, Kim SH, Choi YH, Yoon KH, et al. Acromegaly associated with type 2 diabetes showing normal IGF-1 levels under poorly controlled glycemia. Endocr J 2007;54:537–541. ArticlePubMed
- 4. Arihara Z, Sakurai K, Yamada S, Murakami O, Takahashi K. Acromegaly with normal IGF-1 levels probably due to poorly controlled diabetes mellitus. Tohoku J Exp Med 2008;216:325–329. ArticlePubMed
- 5. Ryu JS, Shong YK, Lee KU, Kim JJ, Park SW, Park SJ, et al. A case of acromegaly with dilated cardiomyopathy. J Korean Soc Endocrinol 1990;5:314–317.
- 6. Minniti G, Moroni C, Jaffrain-Rea ML, Esposito V, Santoro A, Affricano C, et al. Marked improvement in cardiovascular function after successful transsphenoidal surgery in acromegalic patients. Clin Endocrinol (Oxf) 2001;55:307–313. ArticlePubMed
- 7. Grottoli S, Gasco V, Ragazzoni F, Ghigo E. Hormonal diagnosis of GH hypersecretory states. J Endocrinol Invest 2003;26(10 Suppl):27–35.
- 8. Dutta P, Das S, Bhansali A, Bhadada SK, Rajesh BV, Reddy KS, et al. Congestive heart failure in acromegaly: a review of 6 cases. Indian J Endocrinol Metab 2012;16:987–990. ArticlePubMedPMC
- 9. Ballintine EJ, Foxman S, Gorden P, Roth J. Rarity of diabetic retinopathy in patients with acromegaly. Arch Intern Med 1981;141:1625–1627. ArticlePubMed
- 10. Payne JF, Tangpricha V, Cleveland J, Lynn MJ, Ray R, Srivastava SK. Serum insulin-like growth factor-I in diabetic retinopathy. Mol Vis 2011;17:2318–2324. PubMedPMC
- 11. Rymaszewski Z, Cohen RM, Chomczynski P. Human growth hormone stimulates proliferation of human retinal microvascular endothelial cells in vitro. Proc Natl Acad Sci U S A 1991;88:617–621. ArticlePubMedPMC
References
Fig. 1

Chest X-ray and echocardiogram findings showed marked cardiomegaly and left ventricle (LV) hypertrophy. (A) Marked cardiomegaly was detected on chest X-ray. (B) Echocardiogram showed an enlarged left atrium (LA) and LV with concentric LV hypertrophy.
Fig. 2
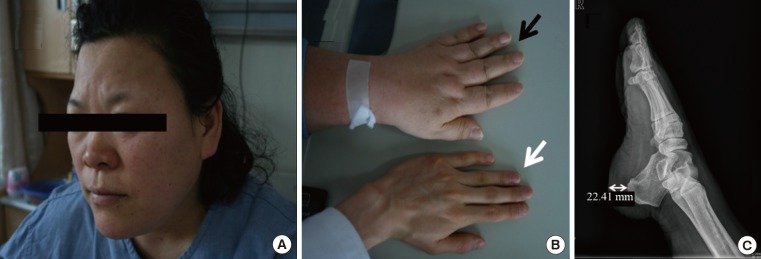
Clinical manifestations and radiographic findings showed the distinguishing features of acromegaly. (A) Jaw enlargement and frontal bone protrusion. (B) Soft tissue overgrowth of the hand (black arrow) compared with a normal adult hand (white arrow). (C) Soft tissue overgrowth of the heel pad in a foot X-ray.
Fig. 3
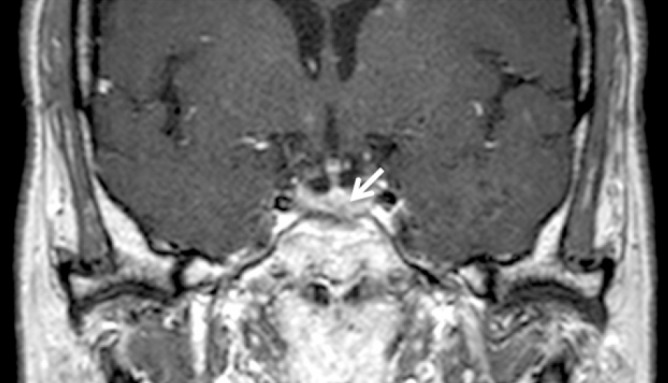
Magnetic resonance imaging of the sella showed a suspicious 5-mm linear shape delayed enhancing lesion at the midline to the left side of the pituitary gland (arrow).

Fig. 5
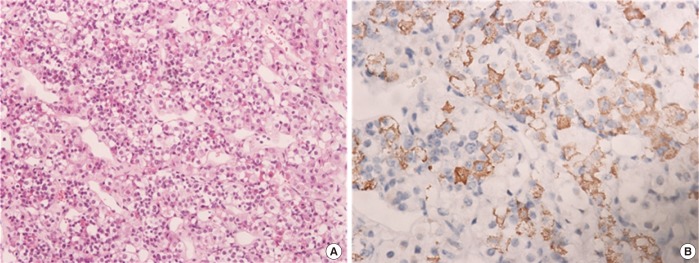
Pathological findings of the pituitary tumor identified it as a growth hormone (GH)-secreting adenoma. (A) A pituitary adenoma in the pituitary gland (H&E stain, ×200). (B) Immunohistochemical staining of the pituitary tumor tissue showed that tumor cells were uniformly positive for GH (×400).
Table 1
![enm-30-395-i001.jpg]()
The Results of Echocardiography before and after Pituitary Tumor Removal
Table 2
![enm-30-395-i002.jpg]()
Dynamic Test of Growth Hormone Test
Figure & Data
References
Citations
Citations to this article as recorded by 
- Risk of Neurodegenerative Diseases in Patients With Acromegaly
Sangmo Hong, Kyungdo Han, Kyung-Soo Kim, Cheol-Young Park
Neurology.2022;[Epub] CrossRef - Levels of Serum IGF-1, HCY, and Plasma BNP in Patients with Chronic Congestive Heart Failure and Their Relationship with Cardiac Function and Short-Term Prognosis
Zhengyi Hu, Leifang Mao, Ling Wang, Weiguo Li
Evidence-Based Complementary and Alternative Medicine.2022; 2022: 1. CrossRef - Neurofibromatosis Type 1 with Concurrent Multiple Endocrine Disorders: Adenomatous Goiter, Primary Hyperparathyroidism, and Acromegaly
Shigemitsu Yasuda, Ikuo Inoue, Akira Shimada
Internal Medicine.2021; 60(15): 2451. CrossRef - Metformin stimulates IGFBP-2 gene expression through PPARalpha in diabetic states
Hye Suk Kang, Ho-Chan Cho, Jae-Ho Lee, Goo Taeg Oh, Seung-Hoi Koo, Byung-Hyun Park, In-Kyu Lee, Hueng-Sik Choi, Dae-Kyu Song, Seung-Soon Im
Scientific Reports.2016;[Epub] CrossRef
 PubReader
 Cite
Cite