Articles
- Page Path
- HOME > Endocrinol Metab > Volume 39(2); 2024 > Article
-
Original ArticleCalcium & bone metabolism Protein Signatures of Parathyroid Adenoma according to Tumor Volume and Functionality
-
Sung Hye Kong1,2*
 , Jeong Mo Bae3*, Jung Hee Kim2,4, Sang Wan Kim2,5, Dohyun Han6, Chan Soo Shin2,4
 -
Endocrinology and Metabolism 2024;39(2):375-386.
DOI: https://doi.org/10.3803/EnM.2023.1827
Published online: March 21, 2024
1Department of Internal Medicine, Seoul National University Bundang Hospital, Seongnam, Korea
2Department of Internal Medicine, Seoul National University College of Medicine, Seoul, Korea
3Department of Pathology, Seoul National University Hospital, Seoul, Korea
4Department of Internal Medicine, Seoul National University Hospital, Seoul, Korea
5Department of Internal Medicine, Seoul Metropolitan Government Seoul National University Boramae Medical Center, Seoul, Korea
6Transdisciplinary Department of Medicine & Advanced Technology, Seoul National University Hospital, Seoul, Korea
- Corresponding authors: Chan Soo Shin Department of Internal Medicine, Seoul National University College of Medicine, 101 Daehak-ro, Jongno-gu, Seoul 03080, Korea Tel: +82-2-2072-3734, Fax: +82-2-765-3734, E-mail: csshin@snu.ac.kr
- Dohyun Han Transdisciplinary Department of Medicine & Advanced Technology, Seoul National University Hospital, 101 Daehak-ro, Jongno-gu, Seoul 03080, Korea Tel: +82-2-2072-4279, Fax: +82-2-765-3734, E-mail: hdohyun@gmail.com
- *These authors contributed equally to this work.
Copyright © 2024 Korean Endocrine Society
This is an Open Access article distributed under the terms of the Creative Commons Attribution Non-Commercial License (http://creativecommons.org/licenses/by-nc/4.0/) which permits unrestricted non-commercial use, distribution, and reproduction in any medium, provided the original work is properly cited.
- 403 Views
- 17 Download
ABSTRACT
-
Background
- Parathyroid adenoma (PA) is a common endocrine disease linked to multiple complications, but the pathophysiology of the disease remains incompletely understood. The study aimed to identify the key regulator proteins and pathways of PA according to functionality and volume through quantitative proteomic analyses.
-
Methods
- We conducted a retrospective study of 15 formalin-fixed, paraffin-embedded PA samples from tertiary hospitals in South Korea. Proteins were extracted, digested, and the resulting peptides were analyzed using liquid chromatography-tandem mass spectrometry. Pearson correlation analysis was employed to identify proteins significantly correlated with clinical variables. Canonical pathways and transcription factors were analyzed using Ingenuity Pathway Analysis.
-
Results
- The median age of the participants was 52 years, and 60.0% were female. Among the 8,153 protein groups analyzed, 496 showed significant positive correlations with adenoma volume, while 431 proteins were significantly correlated with parathyroid hormone (PTH) levels. The proteins SLC12A9, LGALS3, and CARM1 were positively correlated with adenoma volume, while HSP90AB2P, HLA-DRA, and SCD5 showed negative correlations. DCPS, IRF2BPL, and FAM98A were the main proteins that exhibited positive correlations with PTH levels, and SLITRK4, LAP3, and AP4E1 had negative correlations. Canonical pathway analysis demonstrated that the RAN and sirtuin signaling pathways were positively correlated with both PTH levels and adenoma volume, while epithelial adherence junction pathways had negative correlations.
-
Conclusion
- Our study identified pivotal proteins and pathways associated with PA, offering potential therapeutic targets. These findings accentuate the importance of proteomics in understanding disease pathophysiology and the need for further research.
- Primary hyperparathyroidism (PHPT) is a common endocrine disorder with a globally increasing incidence [1,2]. It is the primary cause of outpatient hypercalcemia and presents with a wide spectrum of symptoms impacting the renal, skeletal, neurological, cardiovascular, and gastrointestinal systems [3]. Although surgery is the standard curative treatment, there is a growing clinical need for supplementary medical therapies that are rooted in a deeper understanding of the pathophysiology of PHPT.
- The underlying mechanisms of PHPT involve clonally dysregulated parathyroid overgrowth and excess secretion of parathyroid hormone (PTH), often occurring independently of calcium-sensing receptor (CaSR) expression [4]. Notably, the functionality and cellular growth of a parathyroid tumor do not always positively correlate, adding complexity to the disease presentation [5,6]. Previous research has predominantly focused on genetic aspects of parathyroid adenoma (PA) development and functionality, contributing valuable but limited insights [7-9]. In recent research, genomic-scale quantitative proteomic analysis has been widely used to deepen our understanding of the pathophysiology of diseases [10,11]. Novel biomarkers and therapeutic targets for various diseases have been reported with advances in proteomics analysis [12-14].
- Considering that the functionality of PA does not always align with tumor volume, a more comprehensive approach is needed to unravel these complexities. Utilizing proteomics allows us to explore these variances at the molecular level, identifying unique proteins and pathways that may be separately implicated in the volume and functionality of PA. Advances in proteomic methodologies offer a more dynamic view of the cellular mechanisms at play, thus revealing potential therapeutic targets that could lead to more personalized and effective treatments [15-17]. Existing proteomic studies on PAs have primarily focused on comparing the overall proteomic profile of PA with other disease groups [18,19], and there has been a lack of research specifically examining the proteomic profile in relation to the functionality and functionality of PA itself.
- The current limitations in medical treatment options for PA underscore the urgent need for a more detailed understanding of its pathophysiology. Accordingly, this study aimed to utilize advanced proteomic analyses to identify crucial regulatory proteins and pathways that contribute to the variability in PA functionality and volume.
INTRODUCTION
- Study participants
- We collected and prepared 15 PA samples from two tertiary hospitals in South Korea for a pilot study. The samples were obtained from Seoul National University Hospital (n=8) and Seoul Metropolitan Government Seoul National University Boramae Medical Center (n=7). These tumor samples were formalin-fixed and paraffin-embedded (FFPE), and were acquired from surgical procedures conducted for pathological examination between 2008 and 2018. The study received approval from the Institutional Review Board (protocol number H-1306-101-499) and was carried out in accordance with the ethical standards of the Declaration of Helsinki. Due to the retrospective nature of the study, the requirement for obtaining consent from participants was waived, and all samples were de-identified to protect patient confidentiality.
- Measurements of clinical variables
- Standing height and weight were measured without shoes and in light clothing. Body mass index was calculated as weight divided by height squared (kg/m2). Serum calcium, phosphorus, alkaline phosphatase (ALP), and creatinine levels were measured using an autoanalyzer (TBA-200 FR NEO, Toshiba, Tokyo, Japan). Plasma 25-hydroxyvitamin D and 1,25-dihydroxyvitamin D levels were determined by radioimmunoassay (DiaSorin Inc., Stillwater, MN, USA), with an interassay coefficient of variation (CV) of 11.1% and an intraassay CV of 8.8%. Serum intact PTH was measured with an electrochemiluminescence immunoassay on the Cobas e411 analyzer (Roche Diagnostics, Mannheim, Germany). The maximal diameter and volume of the PA were calculated based on pathology reports. Volume was determined using the formula Π/6×R1×R2×R3, where R1, R2, and R3 represent the lengths of the x, y, and z-axes of the PA (mm), respectively, assuming an ellipsoid shape.
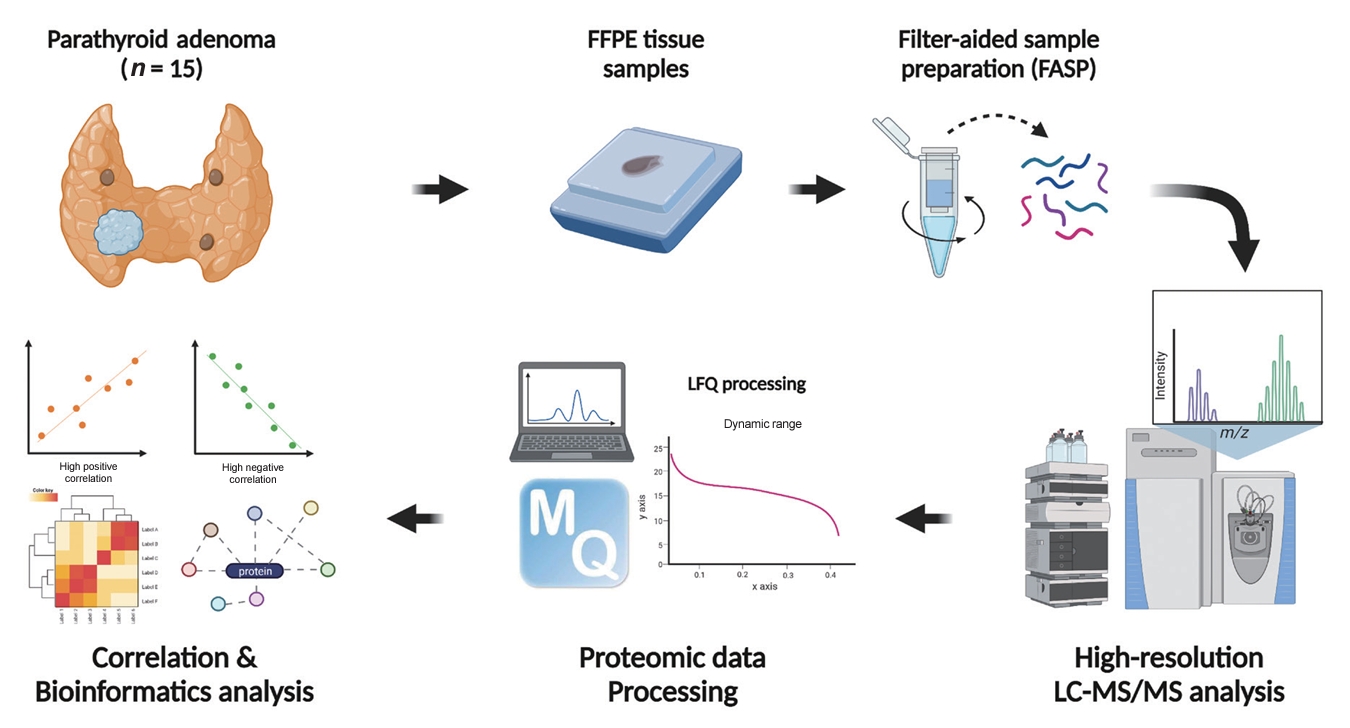
- FFPE sample preparation
- The overall study flow is described in Fig. 1. FFPE samples were reviewed. All samples were confirmed as PA, and the region of interest of the main lesion was marked by a pathologist (J.M.B.). Sample preparation for the in-depth proteomic profiling of FFPE samples followed previously described methods [20,21] with some modifications. In brief, FFPE sections underwent two 5-minute incubations in xylene, followed by two 3-minute incubations in 100% (v/v) ethanol. The sections were then hydrated with two 1.5-minute incubations in 85% (v/v) ethanol and a 5-minute rinse in distilled water. The regions of interest were manually dissected using a razor blade, and an extraction buffer (4% sodium dodecyl sulfate [SDS], 1 mM tris(2-carboxyethyl)phosphine [TCEP], and 0.3 M Tris at a pH of 8.0) was applied to the tissue samples. Post-sonication, the samples were incubated at 95°C for 2 hours to ensure efficient de-crosslinking. Proteins were precipitated by adding chilled acetone at a buffer-to-acetone volume ratio of 1:5, followed by a 16-hour incubation at −20°C. For digestion, 50 μg of protein per sample was processed using the filter-aided sample preparation procedure as previously described [21]. Briefly, the precipitated protein samples were redissolved in 50 µL of SDT (4% SDS, 10 mM TCEP, and 50 mM chloracetamide in 0.1 M Tris HCl at a pH of 8.5) buffer. The protein samples were then loaded onto a 30 K amplicon filter (Millipore, Billerica, MA, USA), and the buffer was exchanged with urea acid (8 M urea in 0.1 M Tris at a pH of 8.5) solution through centrifugation at 14,000 ×g. This was followed by another buffer exchange with 40 mM ammonium bicarbonate (ABC), and overnight digestion at 37°C using a trypsin/Lys-C mixture at an enzyme-to-substrate ratio of 1:100. The resulting peptides were collected in a fresh Eppendorf tube by centrifugation, with an additional elution step using 40 mM ABC and 0.5 M NaCl. All peptides were acidified with 10% trifluoroacetic acid (Thermo Fisher Scientific, Waltham, MA, USA). To increase the depth of the proteome analysis, a three-fractionation strategy was employed. The acidified peptides were loaded onto homemade sulfonated styrene-divinylbenzene polymer StageTips (3M, St. Paul, MN, USA) according to previously described protocols [22]. The fractionated peptides were completely dried in a vacuum dryer and stored at –80°C.
- Establishment of a matching spectral library
- To construct a spectral library for run-to-run matching, we digested frozen samples of normal parathyroid tissue using the two-step filter-aided sample preparation method previously described [23,24]. This normal parathyroid tissue was incidentally removed during thyroidectomy procedures. For the comprehensive data set, we fractionated 100 µg of peptides using an Agilent 1260 bioinert high-performance liquid chromatography system (HPLC, Agilent Technologies, Santa Clara, CA, USA) equipped with a 4.6×250 mm analytical column with 5-µm particles. We performed high-pH reversed-phase peptide fractionation at a flow rate of 0.8 mL/min across a 60-minute gradient, employing solvent A (15 mM ammonium hydroxide in water) and solvent B (15 mM ammonium hydroxide in 90% acetonitrile). We collected a total of 96 fractions at 1-minute intervals and pooled them non-contiguously into 24 fractions. These fractions were then dried using a vacuum centrifuge and stored at –80°C until analyzed by liquid chromatography-tandem mass spectrometry (LC-MS/MS).
- LC-MS/MS analysis
- All LC-MS/MS analyses were performed using an Ultimate 3000 UHPLC system (Dionex, Sunnyvale, CA, USA) coupled to a Q-Exactive Plus mass spectrometer (Thermo Scientific, Hamburg, Germany), following the method previously described [25] with some modifications. Per the manufacturer’s instructions, peptides were resuspended in 2% acetonitrile and 0.1% formic acid, then spiked with the hyperreaction monitoring kit (Biognosys AG, Schlieren-Zurich, Switzerland). The peptide samples underwent separation on a two-column system consisting of a trap column (300 µm×5 mm length) and an analytical column (EASY-Spray C18, 75 µm×50 cm length), using 90-minute gradients ranging from 8% to 30% acetonitrile at a flow rate of 300 nL/min. The temperature of the column was maintained at 60°C with a column heater. The eluent from the column was introduced to the Q-Exactive Plus via nanoelectrospray ionization. A survey scan (m/z 350–1,650) was acquired with a resolution of 70,000 at m/z 200. The top-20 method was employed to select precursor ions within an isolation window of 1.2 m/z. MS/MS spectra were obtained using higher-energy collisional dissociation at a normalized collision energy of 30 and a resolution of 17,500 at m/z 200. The maximum ion injection times were set to 20 ms for full scans and 100 ms for MS/MS scans.
- Data processing for label-free quantification
- All raw MS files were processed using MaxQuant version 1.6.1.10 (Max Planck Institute of Biochemistry, Martinsried, Germany) [26]. The MS/MS spectra were searched against the Human UniProt protein sequence database (December 2014, 88,657 entries) using the Andromeda search engine [27]. The primary searches were conducted with a precursor ion tolerance of 6 ppm. An MS/MS ion tolerance of 20 ppm was applied in this study. Carbamidomethylation of cysteine was set as a fixed modification, while N-acetylation of proteins and oxidation of methionine were treated as variable modifications. The enzyme specificity was defined for complete tryptic digestion. We included peptides with a minimum length of six amino acids and allowed up to two missed cleavages. The false discovery rate (FDR) was set at 1% at the peptide, protein, and modification levels. To enhance quantification across samples, the “Match between Runs” feature was enabled in the MaxQuant platform. Label-free quantification (LFQ) was carried out, with a minimum ratio set to 1 [28].
- Statistical analysis
- Statistical analyses of proteomic data were performed using Perseus software (Max Planck Institute of Biochemistry) [29]. Initially, the proteins were identified only by site and reverse hits, and contaminants were removed. The protein expression levels were estimated by determining their LFQ values calculated using the MaxLFQ algorithm in MaxQuant software [28]. Due to the skewed distribution of the data, these values were subject to log2 transformation. Valid values were filtered using proteins with a minimum of 70% quantified values in at least one sample group. Missing values were imputed based on a normal distribution (width=0.5, downshift=1.8) to simulate the signals of low-abundance proteins. To identify the significantly correlated proteins, Pearson correlation analysis was done between protein expression levels and clinical variables using the following thresholds for significance: P<0.05 and permutation-based FDR <0.05. Protein abundance levels were subjected to z-normalization using the Perseus software.
- The canonical pathways and transcriptional factor analysis were evaluated using Ingenuity Pathway Analysis (IPA, QIAGEN, Hilden, Germany) based on the annotated significantly correlated proteins with matched gene names. The analytical algorithms embedded in IPA use lists of significantly correlated proteins to predict biological processes and pathways. The statistical significance of enrichment analysis was determined using the Fisher exact test. All statistical tests were two-sided, and statistical significance was set at P<0.05.
- Data availability
- The data related to the results presented in this article can be obtained upon reasonable request.
METHODS
- Clinical characteristics
- A total of 15 PA samples were analyzed. The patients’ median age was 52 years, and nine patients (60.0%) were women (Table 1). The median serum PTH level was 125.0 pg/mL (interquartile range [IQR], 113.0 to 172.8), and the median serum calcium and ALP levels were 11.3 mg/dL (IQR, 10.9 to 11.8) and 113.0 IU/L (IQR, 104.0 to 122.8), respectively. The median diameter and volume of adenomas were 17.4 mm (IQR, 15.0 to 25.5) and 1,762 mm3 (IQR, 1,330 to 2,636), respectively.
- Proteins significantly correlated with volume and PTH
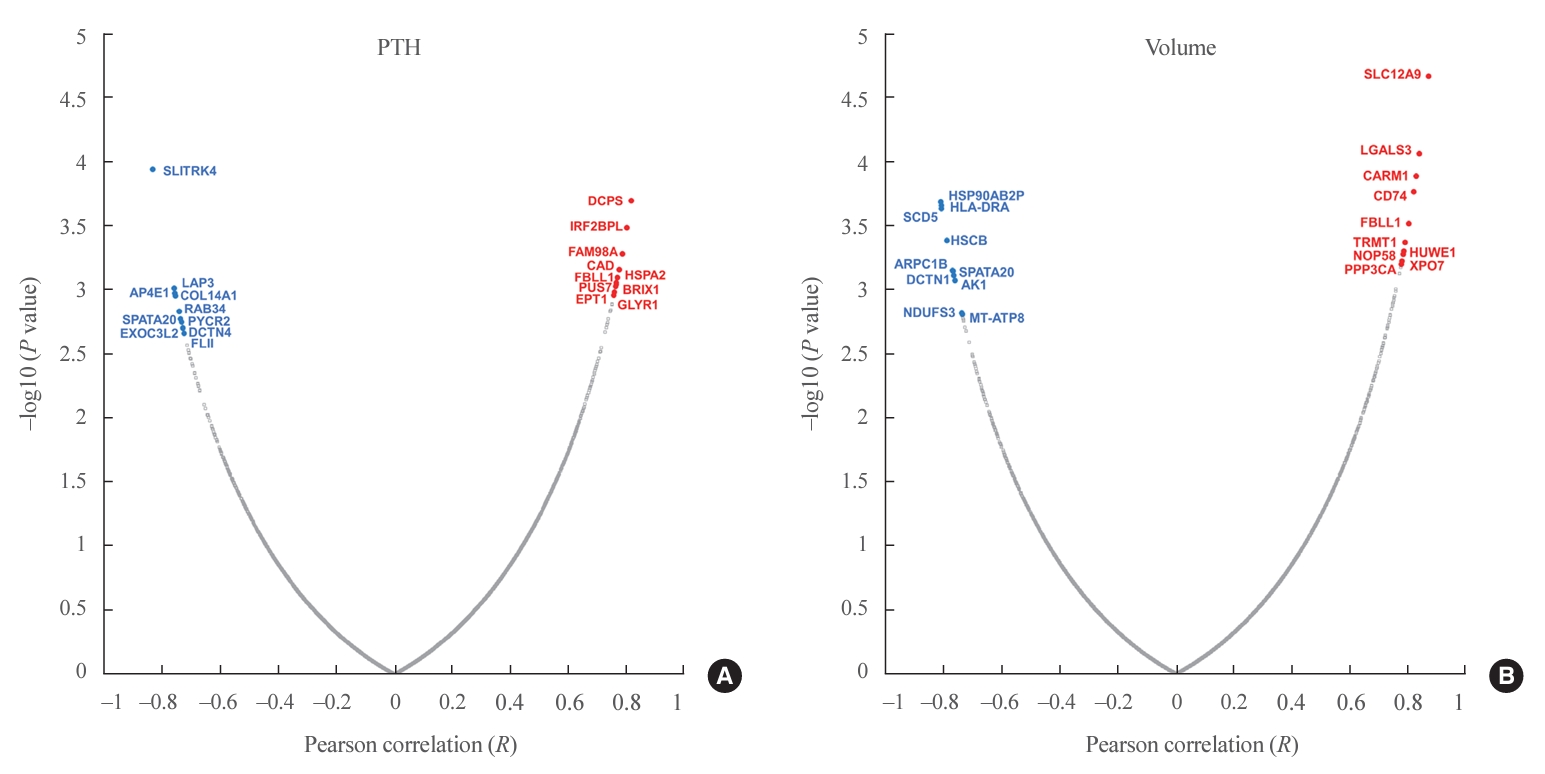
- In total, 8,153 proteins were identified in all samples at the 1% FDR level. The MaxLFQ algorithm quantified an average of 5,000 protein groups in each sample. Among 431 proteins significantly correlated with PTH levels, 284 were positively correlated and 147 were negatively correlated (Fig. 2A, Supplemental Table S1). Among them, the scavenger mRNA-decapping enzyme (DCPS), interferon regulatory factor 2 binding protein-like (IRF2BPL), and family with sequence similarity 98 member A (FAM98A) proteins were the top 3 positively correlated proteins, while SLIT and NTRK like family member 4 (SLITRK4), leucine aminopeptidase 3 (LAP3), and adaptor related protein complex 4 subunit epsilon 1 (AP4E1) exhibited negative correlations.
- Among 496 proteins significantly correlated with adenoma volume, 306 were positively correlated and 190 were negatively correlated (Fig. 2B, Supplemental Table S2). Among them, the solute carrier family 12 member 9 (SLC12A9), galectin 3 (LGALS3), and coactivator associated arginine methyltransferase 1 (CARM1) proteins were the top 3 positively correlated proteins, while heat shock protein 90 alpha family class B member 2, pseudogene (HSP90AB2P), major histocompatibility complex, class II, DR alpha (HLA-DRA), and stearoyl-CoA desaturase 5 (SCD5) were negatively correlated.
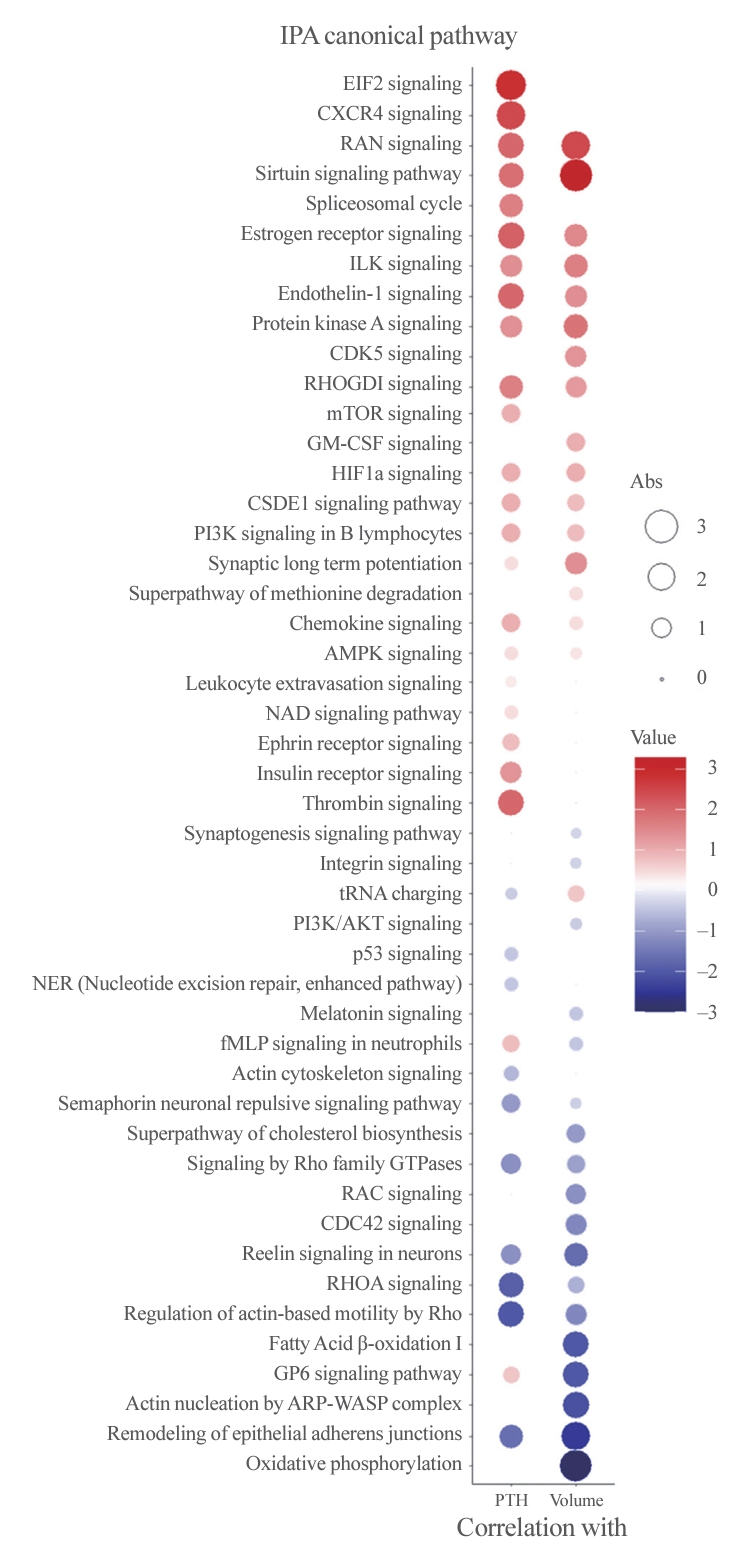
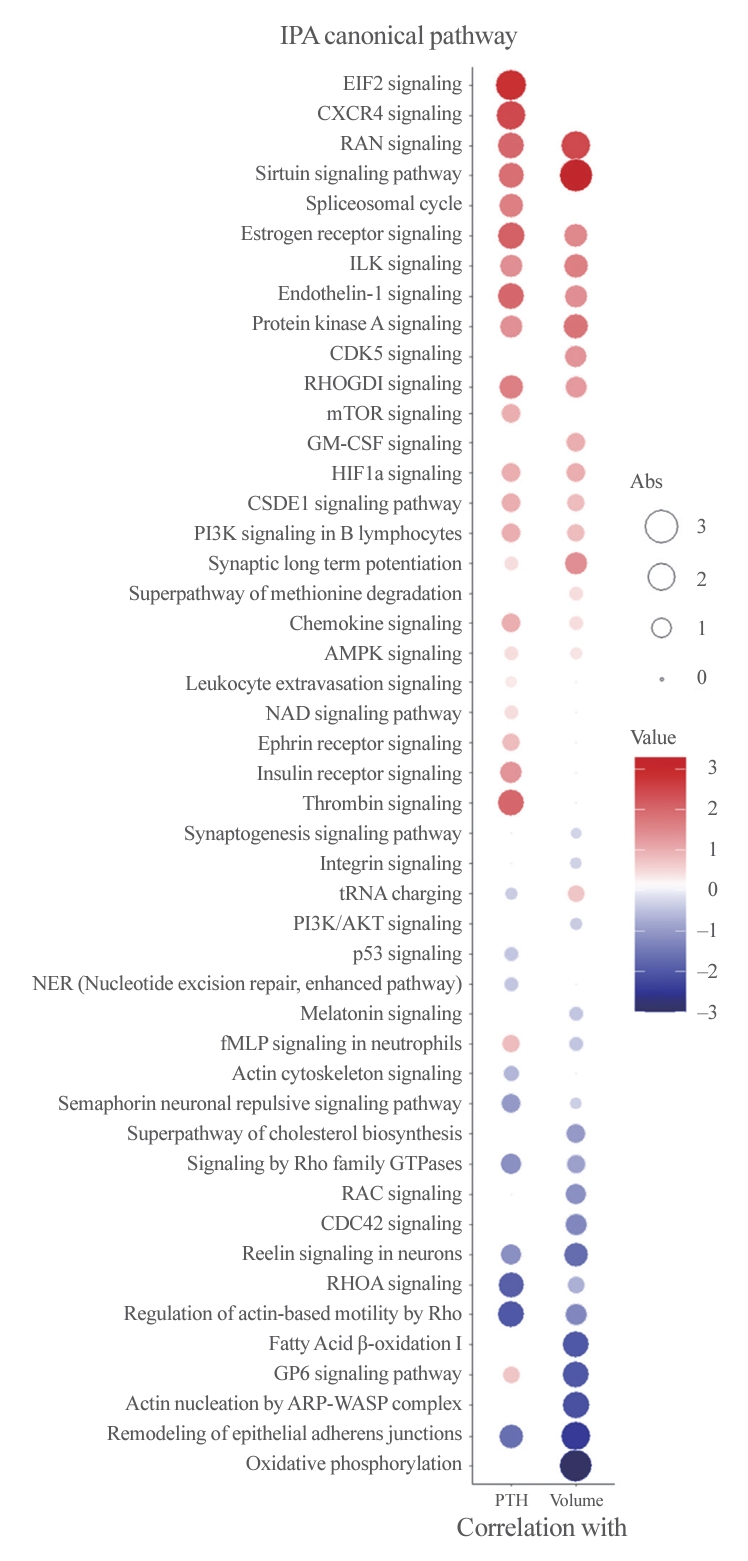
- Enriched canonical pathways and protein network analyses
- To better understand the pathophysiology of PA, canonical pathway analysis was performed using the IPA tool (Fig. 3). The Ras-related nuclear protein (RAN) and sirtuin signaling pathways were positively correlated, while pathways related to epithelial adherence junctions were negatively correlated with both PTH levels and adenoma volume. Furthermore, eukaryotic translation initiation factor 2 (EIF2) signaling, C-X-C motif chemokine receptor 4 (CXCR4), and the thrombin pathway were positively correlated with PTH levels, while Rho-related pathways were negatively correlated. Additionally, oxidative phosphorylation, fatty acid oxidation, and glycoprotein VI platelet (GP6) signaling pathways were negatively correlated with PA volume only.
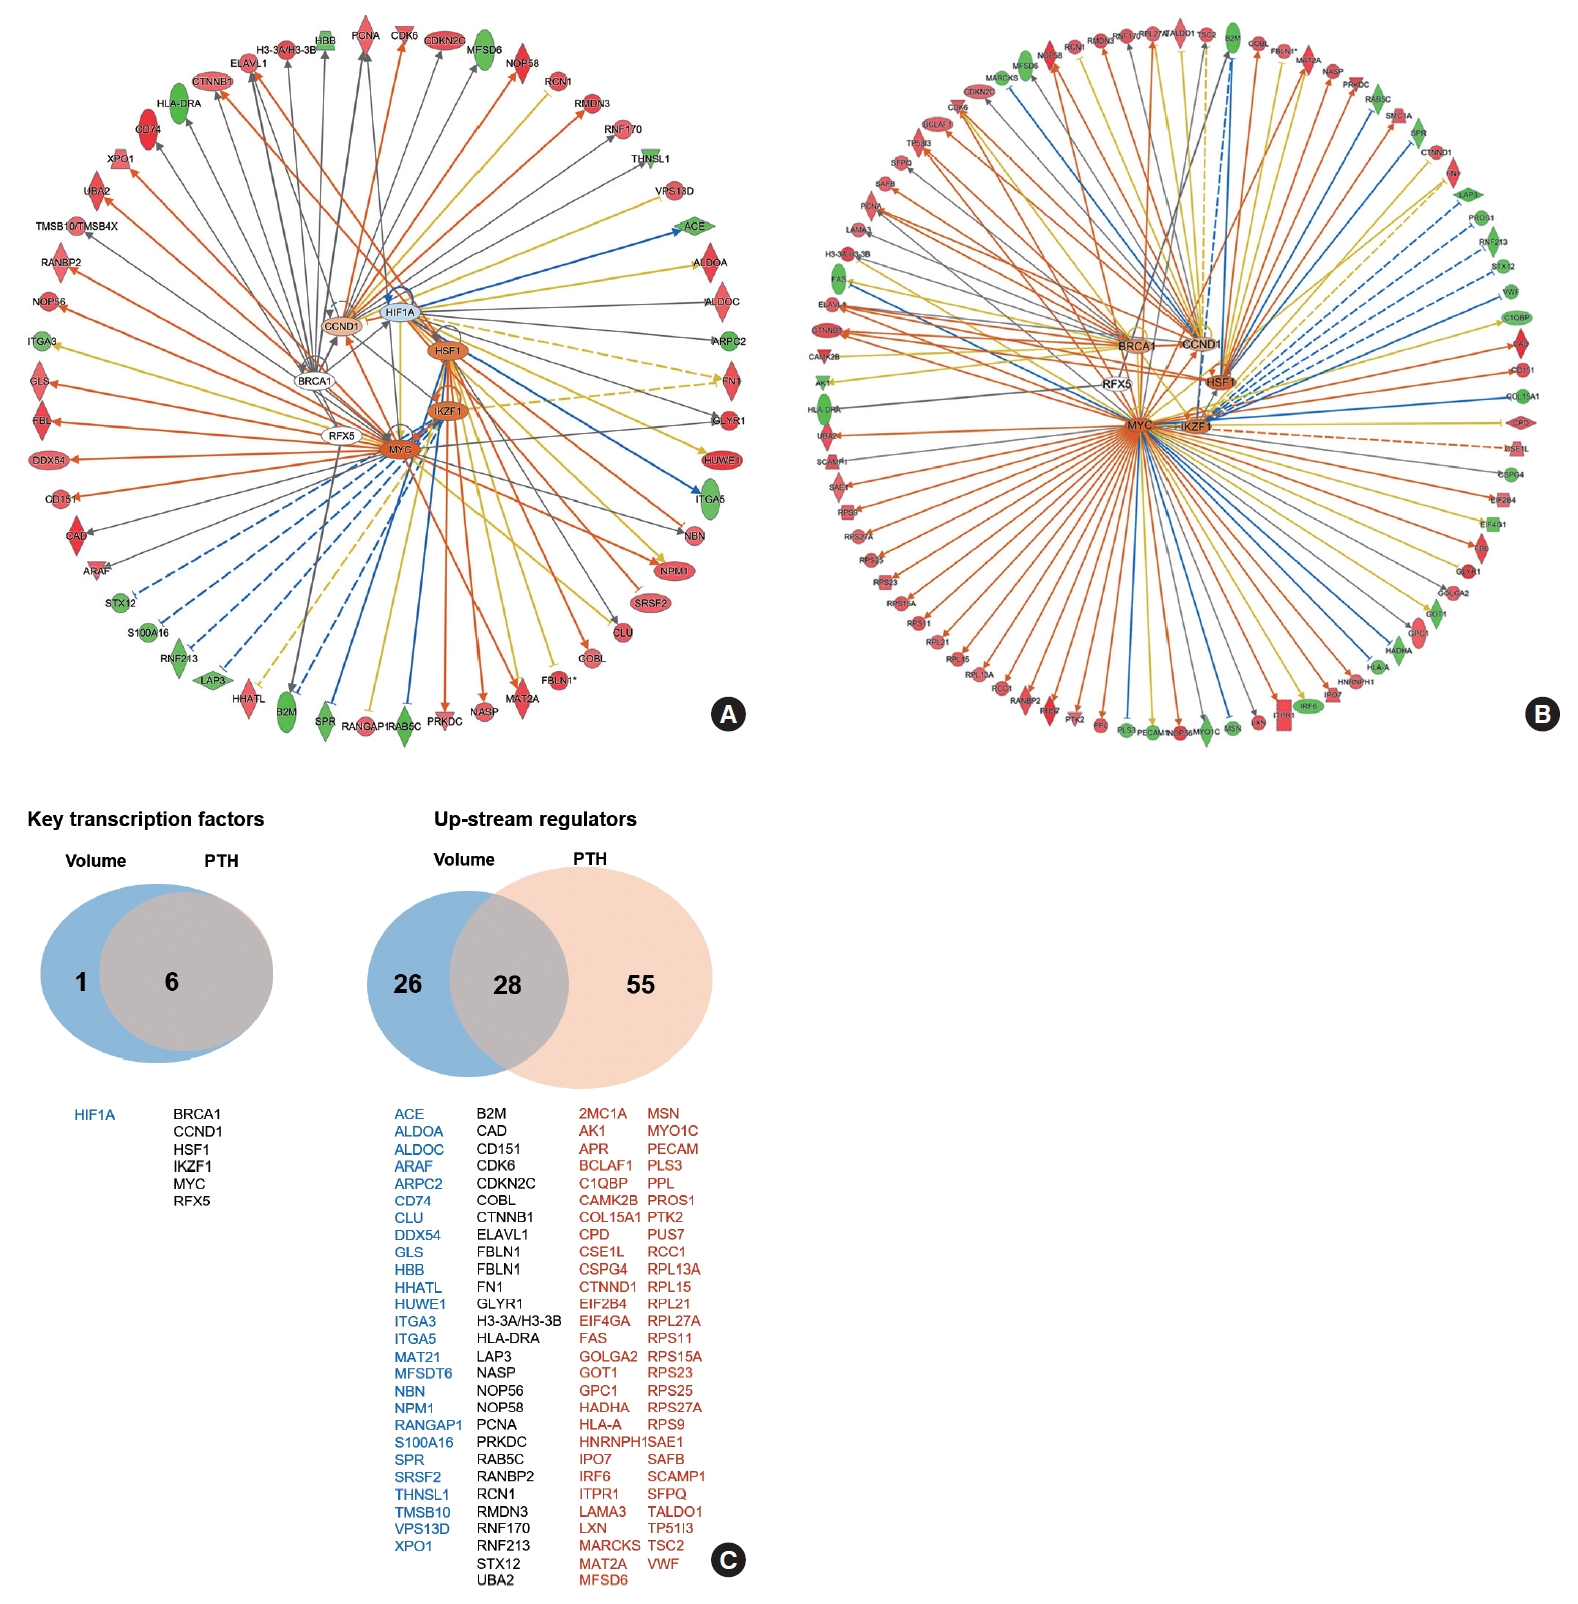
- The functional network for upstream regulators is depicted in Fig. 4A, B. The key transcription factors related to PA volume were hypoxia inducible factor 1 subunit alpha (HIF1A), cyclin D1 (CCND1), breast cancer gene 1 (BRCA1), regulatory factor X5 (RFX5), Myc, IKAROS family zinc finger 1 (IKZF1), and heat shock transcription factor 1 (HSF1), which were tightly correlated with each other (Fig. 4A). The key transcription factors related to PTH levels were CCND1, BRCA1, RFX5, Myc, IKZF1, and HSF1, which were similar to volume-related factors (Fig. 4B). A Venn diagram of the key transcriptional factors and upstream regulators according to volume and PTH is depicted in Fig. 4C.
RESULTS
- The study analyzed 15 PA tissue samples using proteomics to reveal the key proteins associated with the functionality and volume of PAs. The mean volume of PAs was 1,762 mm3, and the mean PTH level was 125 pg/mL. Among 8,153 proteins identified in the samples, 431 and 496 proteins were significantly correlated with PTH levels and adenoma volume, respectively. The SLC12A9 and HSP90AB2P proteins were significantly correlated with volume, and the DCPS, IRF2BPL, and FAM98A proteins were correlated with PTH. The RAN and sirtuin signaling pathways were positively correlated with both PTH levels and PA volume, while pathways related to epithelial adherence junctions were negatively correlated. However, the EIF2 and thrombin signaling pathways were correlated with PTH levels only. The key transcription factors related to PTH and volume included CCND1, BRCA1, RFX5, Myc, IKZF1, and HSF1.
- Proteomics is the large-scale study of proteins, focusing on their structures, functions, and roles within complex biological systems. Techniques such as mass spectrometry, two-dimensional gel electrophoresis, and other high-throughput methods enable us to quantitatively analyze protein expression, post-translational modifications, and interactions comprehensively [15-17]. Unlike genomics or transcriptomics, which provide insights at the DNA and RNA levels, respectively, proteomics concentrates on the end products that execute various cellular functions. This downstream analysis is critical because the correlation between mRNA levels and protein expression is not always direct, owing to complex regulatory mechanisms such as alternative splicing, post-translational modifications, and variable rates of protein degradation [30]. High-resolution proteomic data, in particular, offers a more nuanced understanding that surpasses what genomic and transcriptomic data can reveal [31]. Thus, the use of proteomics in this study is not a replacement for other omics technologies but rather a complementary and, in many cases, essential tool for unraveling the intricate molecular underpinnings of PAs.
- In this study, SLC12A9 and HSP90AB2P were found to strongly correlate with PA volume. SLC12A9 belongs to the solute carrier (SLC) family, which is involved in the transport of exogenous and endogenous substances through influx and efflux mechanisms. The SLC family has also been linked to tumor formation, influencing processes such as proliferation, migration, angiogenesis, and epithelial-mesenchymal transition [32]. However, research on the SLC12 family has been relatively limited compared to other SLCs. Emerging evidence indicates that members of the SLC12 gene family may act as either tumor-suppressive genes or proto-oncogenes. For instance, SLC12A2 and SLC12A5 have been identified as tumor suppressors in human esophageal and colorectal cancers [33,34]. The specific role of SLC12A9 is not yet fully understood, but its upregulation has been associated with increased aggressiveness in melanoma [35], mediated by the HLA complex P5 (HCP5)/miR-140-5p axis. miR-140-5p has been reported to regulate the Akt and Wnt signaling pathways [36], suggesting that miR-140-5p could be one of the main pathways involved in PA progression, and SLC12A9 could be a potential downstream marker of parathyroid proliferation.
- Meanwhile, the DCPS protein was found to be positively correlated with PTH levels. DCPS, a decapping scavenger enzyme, plays a role in the exosome-mediated mRNA decay pathway. It prevents the potentially toxic accumulation of capped mRNA fragments within the cell [37]. The stability of PTH mRNA is regulated by ribonucleolytic machinery, with the decay of PTH mRNA progressing through the exosome-mediated removal of the 5’ fragment via exonucleolytic cleavage [38], which mainly involves DCPS [39]. Hence, while there are no existing reports directly linking DCPS to PTH levels in parathyroid diseases, it is theoretically plausible that changes in the quantity and function of DCPS could influence PTH levels. This possibility suggests that DCPS might serve as a potential target for modulating activity in PAs.
- The present study identified several signaling pathways that significantly correlate with the volume and function of adenomas. Notably, the RAN signaling pathway exhibited a strong correlation with both the volume and functionality of these growths. As a member of the Ras superfamily, RAN is recognized as a critical pathway for proliferative signaling and resistance to apoptosis across various cancer types [40]. Furthermore, activation of the intracellular Erk-RAS cascade has been reported to increase cell proliferation in the parathyroid gland [41], potentially leading to larger adenomas with elevated PTH levels, as observed in this study. Interestingly, the sirtuin signaling pathway was also found to be associated with adenoma volume and PTH level. The sirtuin family, which is known for its role in histone deacetylation, can function as either tumor suppressors or promoters, depending on the signaling target or type of neoplasm. Sirtuin 1, in particular, has been identified as a negative regulator of PTH-induced stimulation of matrix metallopeptidase 13 (MMP13) in osteoblastic cells [42]. Sirtuin 1 is also known as an oncogenic factor that promotes cell proliferation by upregulating DNA polymerases and inhibiting p53 in breast cancer cell lines [43]; this mechanism of action could also potentially contribute to the growth of PAs.
- The EIF2 and thrombin signaling pathways were found to correlate exclusively with PTH levels. The EIF2 signaling pathway is a well-established regulator of translational initiation in response to stressors, including infection. Moreover, recent studies have indicated that PTH can regulate cell proliferation, in part, by activating the HSP90-dependent EIF2 signaling pathway [44]. Conversely, the thrombin and coagulation pathways have also shown a positive correlation with PTH levels. Thrombin is recognized for its role in mobilizing intracellular calcium alongside PTH [45]. Furthermore, while thrombin is primarily associated with thrombosis and hemostasis, research suggests that thrombosis may facilitate tumor progression through interactions between platelets and tumor cells [46]. It has also been reported that patients with hyperparathyroidism had an increased risk of thrombosis dependent on PTH levels. This heightened risk may be attributable to the augmented activity of the thrombin pathway, as evidenced by elevated levels of plasminogen activator inhibitor-1 and tissue plasminogen activator [47].
- In addition, we found that Rho-related pathways were negatively correlated with PTH levels. Radeff et al. [48] highlighted this inverse relationship, demonstrating that the activity of Rho family G-proteins is inversely related to PTH signaling in osteoblasts, which particularly affects protein kinase C translocation and interleukin-6 promoter activity. These findings underscore the role of Rho GTPases in modulating key aspects of bone metabolism. Complementing these insights, the research by Huck et al. [49] explored the specific role of Rac1, a member of the Rho GTPase family, in osteoblast differentiation. Their work demonstrated that deleting Rac1 in preosteoblasts leads to diminished osteoblast differentiation and lower bone mineral density, highlighting the critical role of Rac1 in normal osteoblast function. Collectively, these studies illuminate the complex influence of Rho GTPases on bone physiology and contribute to a more comprehensive understanding of their involvement in the bone phenotypes associated with parathyroid diseases.
- We also observed a significant association between parathyroid disease volume and pathways involved in fatty acid oxidation and oxidative phosphorylation. This finding is consistent with recent insights into the role of fatty acid metabolism in cancer pathogenesis [50]. The expression of the fatty acid synthase (FAS) gene and its biosynthetic activity have been increasingly recognized as critical molecular events in the development of cancer [51]. These processes seem to be an early response to the tumor microenvironment, which is characterized by poor oxygenation and high acidity, often due to inadequate angiogenesis and nutritional supply. Given the growing evidence of FAS-driven signaling in regulating key networks in carcinogenesis, our study contributes to the understanding of fatty acid metabolism as a potentially critical factor in the progression of parathyroid disease.
- In this study, HIF1A was identified as a key upstream regulator of parathyroid volume and function. HIF, a group of transcription factors, plays a role in the body’s response to hypoxia by activating genes that encourage blood vessel growth and anaerobic glycolysis [52]. However, it has been shown that HIF1A expression and the expression of HIF1A-driven genes can be controlled in various ways that do not depend on oxygen [53]. PTH has been found to regulate HIF-induced signaling independently of oxygen, particularly through changes in cyclic adenosine monophosphate levels mediated by PTH [54]. This mechanism suggests a complex interaction between PTH and HIF, wherein PTH affects the cellular response to hypoxia through intracellular signaling pathways that are not exclusively dependent on oxygen levels. Additionally, calcium signaling through the CaSR has been reported to stimulate HIF1A translation under hypoxic conditions [55]. These findings point to the potential for complex communication between hormonal and oxygen-sensitive pathways, highlighting the sophisticated regulatory systems that control cellular adaptation to various physiological states.
- Notably, CCND1 and BRCA1 were identified as transcription factors significantly correlated with both PTH levels and adenoma volume. Cyclins are crucial regulators of cyclin-dependent kinases (CDKs), which are enzymes that control cell progression through the cell cycle phases. An increased level of CCND1 leads to enhanced transcription of numerous genes essential for DNA synthesis and the smooth progression of the cell cycle, which has been implicated in 20% to 40% of sporadic PAs according to previous studies [56,57]. BRCA1, in contrast, acts as a conductor orchestrating a variety of key signaling events in normal replicating cells and following DNA damage [58,59]. Following DNA damage, BRCA1 is actively recruited to the sites of damage to aid in the repair process, while also regulating transcriptional programs that promote cell survival by activating cell cycle checkpoints and suppressing apoptosis. Its well-known role in DNA repair suggests a possible involvement in parathyroid tumorigenesis, although reports on the association between BRCA1 and parathyroid glands are scarce.
- The study has several strengths. The major strength of this study is that it identified novel transcriptional factors that could serve as potential targets for the treatment of PA. Additionally, our innovative approach involved separate analyses of PA in terms of functionality and volume, leading to the discovery of different proteins significantly correlated with each parameter. This has broadened our understanding of the pathophysiology of PA. However, the study has several limitations. Our findings could only suggest associations between proteins and clinical parameters, rather than direct causal relationships. Therefore, additional research is needed to explore the potential roles of these factors in oncogenesis. Furthermore, we could not validate the potential markers in another independent dataset. We did not conduct in vitro or in vivo validation experiments to directly investigate the effects of the overexpression or inhibition of these specific genes on PTH levels or the rate of tumor proliferation; this warrants further validation studies. In addition, we could not include a control normal parathyroid group due to ethical and practical issues, since normal parathyroid tissue should not be surgically removed. Therefore, we focused on changes in factors within PAs without comparison to normal glands. This is a critical consideration, given the likely differences between the physiological and molecular environments of normal and pathological parathyroid tissues. Comparative studies have shown that differentially expressed genes (DEGs) between normal glands and PAs, such as mediator complex subunit 12 (MED12), lysine methyltransferase 5A (KMT5A), bone morphometric protein 2 inducible kinase (BMP2K), and ATPase family AAA domain containing 2 (ATAD2), are frequently associated with cell proliferation and transcriptional regulation [6]. However, these DEGs did not overlap with our findings, suggesting that the protein level changes observed in our study may be specific to PA. Future research should aim to investigate these pathways in normal parathyroid glands and compare them to pathological conditions.
- In conclusion, we report a proteomic study of PA in terms of functionality and volume with differentially expressed essential proteins, signaling pathways, and transcriptional factors. The report is clinically meaningful insofar as it suggests different key proteins according to the functionality and volume of PA. In addition, the key signaling pathways may shed light on the therapeutic targets of PA in the future. By distinctly analyzing the factors affecting functionality and volume, our study lays the foundation for in-depth understanding of the disease. These findings are in line with the questions posed in the Introduction section of this paper, but require further validation to establish their clinical utility.
DISCUSSION
Supplementary Material
Supplemental Table S1.
Supplemental Table S2.
-
CONFLICTS OF INTEREST
No potential conflict of interest relevant to this article was reported.
-
AUTHOR CONTRIBUTIONS
Conception or design: S.H.K., J.H.K., C.S.S. Acquisition, analysis, or interpretation of data: S.H.K., J.M.B. Drafting the work or revising: S.H.K., J.M.B., J.H.K., S.W.K., D.H., C.S.S. Final approval of the manuscript: S.H.K., J.M.B., J.H.K., S.W.K., D.H., C.S.S.
Article information
-
Acknowledgements
- The study was funded by Korean Endocrine Society of EnM Research Award 2018.

- 1. Kong SH, Kim JH, Park MY, Kim SW, Shin CS. Residual risks of comorbidities after parathyroidectomy in a nationwide cohort of patients with primary hyperparathyroidism. Endocrine 2023;79:190–9.ArticlePubMedPDF
- 2. Rao SD. Epidemiology of parathyroid disorders. Best Pract Res Clin Endocrinol Metab 2018;32:773–80.ArticlePubMed
- 3. Bilezikian JP, Khan AA, Silverberg SJ, Fuleihan GE, Marcocci C, Minisola S, et al. Evaluation and management of primary hyperparathyroidism: summary statement and guidelines from the Fifth International Workshop. J Bone Miner Res 2022;37:2293–314.PubMed
- 4. Singh P, Bhadada SK, Dahiya D, Arya AK, Saikia UN, Sachdeva N, et al. Reduced calcium sensing receptor (CaSR) expression is epigenetically deregulated in parathyroid adenomas. J Clin Endocrinol Metab 2020;105:3015–24.ArticlePubMedPMCPDF
- 5. Kong SH, Kim JH, Kim SW, Shin CS. Radioactive parathyroid adenomas on sestamibi scans: low parathyroid hormone secretory potential and large volume. Endocrinol Metab (Seoul) 2021;36:351–8.ArticlePubMedPMCPDF
- 6. Chai YJ, Chae H, Kim K, Lee H, Choi S, Lee KE, et al. Comparative gene expression profiles in parathyroid adenoma and normal parathyroid tissue. J Clin Med 2019;8:297.ArticlePubMedPMC
- 7. Haven CJ, Howell VM, Eilers PH, Dunne R, Takahashi M, van Puijenbroek M, et al. Gene expression of parathyroid tumors: molecular subclassification and identification of the potential malignant phenotype. Cancer Res 2004;64:7405–11.PubMed
- 8. Kim SW. Gene expression profiles in parathyroid adenoma and normal parathyroid tissue. Vitam Horm 2022;120:289–304.ArticlePubMed
- 9. Brewer K, Costa-Guda J, Arnold A. Molecular genetic insights into sporadic primary hyperparathyroidism. Endocr Relat Cancer 2019;26:R53–72.ArticlePubMed
- 10. Callesen AK, Vach W, Jorgensen PE, Cold S, Tan Q, Depont Christensen R, et al. Combined experimental and statistical strategy for mass spectrometry based serum protein profiling for diagnosis of breast cancer: a case-control study. J Proteome Res 2008;7:1419–26.ArticlePubMed
- 11. Mezger ST, Mingels AM, Bekers O, Cillero-Pastor B, Heeren RM. Trends in mass spectrometry imaging for cardiovascular diseases. Anal Bioanal Chem 2019;411:3709–20.ArticlePubMedPMCPDF
- 12. Ellis MJ, Gillette M, Carr SA, Paulovich AG, Smith RD, Rodland KK, et al. Connecting genomic alterations to cancer biology with proteomics: the NCI Clinical Proteomic Tumor Analysis Consortium. Cancer Discov 2013;3:1108–12.ArticlePubMedPMCPDF
- 13. Faria SS, Morris CF, Silva AR, Fonseca MP, Forget P, Castro MS, et al. A timely shift from shotgun to targeted proteomics and how it can be groundbreaking for cancer research. Front Oncol 2017;7:13.ArticlePubMedPMC
- 14. Lin YH, Eguez RV, Torralba MG, Singh H, Golusinski P, Golusinski W, et al. Self-assembled STrap for global proteomics and salivary biomarker discovery. J Proteome Res 2019;18:1907–15.PubMed
- 15. Posadas EM, Simpkins F, Liotta LA, MacDonald C, Kohn EC. Proteomic analysis for the early detection and rational treatment of cancer: realistic hope? Ann Oncol 2005;16:16–22.ArticlePubMed
- 16. Nanjundan M, Byers LA, Carey MS, Siwak DR, Raso MG, Diao L, et al. Proteomic profiling identifies pathways dysregulated in non-small cell lung cancer and an inverse association of AMPK and adhesion pathways with recurrence. J Thorac Oncol 2010;5:1894–904.ArticlePubMedPMC
- 17. Shruthi BS, Vinodhkumar P. Proteomics: a new perspective for cancer. Adv Biomed Res 2016;5:67.ArticlePubMedPMC
- 18. Akpinar G, Kasap M, Canturk NZ, Zulfigarova M, Islek EE, Guler SA, et al. Proteomics analysis of tissue samples reveals changes in mitochondrial protein levels in parathyroid hyperplasia over adenoma. Cancer Genomics Proteomics 2017;14:197–211.ArticlePubMedPMC
- 19. Varshney S, Bhadada SK, Arya AK, Sharma S, Behera A, Bhansali A, et al. Changes in parathyroid proteome in patients with primary hyperparathyroidism due to sporadic parathyroid adenomas. Clin Endocrinol (Oxf) 2014;81:614–20.ArticlePubMed
- 20. Lee KM, Lee H, Han D, Moon WK, Kim K, Oh HJ, et al. Combined the SMAC mimetic and BCL2 inhibitor sensitizes neoadjuvant chemotherapy by targeting necrosome complexes in tyrosine aminoacyl-tRNA synthase-positive breast cancer. Breast Cancer Res 2020;22:130.ArticlePubMedPMCPDF
- 21. Jang HN, Moon SJ, Jung KC, Kim SW, Kim H, Han D, et al. Mass spectrometry-based proteomic discovery of prognostic biomarkers in adrenal cortical carcinoma. Cancers (Basel) 2021;13:3890.ArticlePubMedPMC
- 22. Park J, Kim H, Kim SY, Kim Y, Lee JS, Dan K, et al. In-depth blood proteome profiling analysis revealed distinct functional characteristics of plasma proteins between severe and non-severe COVID-19 patients. Sci Rep 2020;10:22418.ArticlePubMedPMCPDF
- 23. Kim DK, Han D, Park J, Choi H, Park JC, Cha MY, et al. Deep proteome profiling of the hippocampus in the 5XFAD mouse model reveals biological process alterations and a novel biomarker of Alzheimer’s disease. Exp Mol Med 2019;51:1–17.ArticlePDF
- 24. Kim JE, Han D, Jeong JS, Moon JJ, Moon HK, Lee S, et al. Multisample mass spectrometry-based approach for discovering injury markers in chronic kidney disease. Mol Cell Proteomics 2021;20:100037.ArticlePubMedPMC
- 25. Kim JH, Kim H, Dan K, Kim SI, Park SH, Han D, et al. Indepth proteomic profiling captures subtype-specific features of craniopharyngiomas. Sci Rep 2021;11:21206.ArticlePubMedPMCPDF
- 26. Cox J, Mann M. MaxQuant enables high peptide identification rates, individualized p.p.b.-range mass accuracies and proteome-wide protein quantification. Nat Biotechnol 2008;26:1367–72.ArticlePubMedPDF
- 27. Cox J, Neuhauser N, Michalski A, Scheltema RA, Olsen JV, Mann M. Andromeda: a peptide search engine integrated into the MaxQuant environment. J Proteome Res 2011;10:1794–805.ArticlePubMed
- 28. Cox J, Hein MY, Luber CA, Paron I, Nagaraj N, Mann M. Accurate proteome-wide label-free quantification by delayed normalization and maximal peptide ratio extraction, termed MaxLFQ. Mol Cell Proteomics 2014;13:2513–26.ArticlePubMedPMC
- 29. Tyanova S, Temu T, Sinitcyn P, Carlson A, Hein MY, Geiger T, et al. The Perseus computational platform for comprehensive analysis of (prote)omics data. Nat Methods 2016;13:731–40.ArticlePubMedPDF
- 30. Mata J, Marguerat S, Bahler J. Post-transcriptional control of gene expression: a genome-wide perspective. Trends Biochem Sci 2005;30:506–14.ArticlePubMed
- 31. Cox J, Mann M. Quantitative, high-resolution proteomics for data-driven systems biology. Annu Rev Biochem 2011;80:273–99.ArticlePubMed
- 32. Rashid K, Ahmad A, Liang L, Liu M, Cui Y, Liu T. Solute carriers as potential oncodrivers or suppressors: their key functions in malignant tumor formation. Drug Discov Today 2021;26:1689–701.ArticlePubMed
- 33. Xie J, Zhu XY, Liu LM, Meng ZQ. Solute carrier transporters: potential targets for digestive system neoplasms. Cancer Manag Res 2018;10:153–66.ArticlePubMedPMCPDF
- 34. Jiang Y, Liao HL, Chen LY. A pan-cancer analysis of SLC12A5 reveals its correlations with tumor immunity. Dis Markers 2021;2021:3062606.ArticlePubMedPMCPDF
- 35. Yan C, Hu X, Liu X, Zhao J, Le Z, Feng J, et al. Upregulation of SLC12A3 and SLC12A9 mediated by the HCP5/miR-140-5p axis confers aggressiveness and unfavorable prognosis in uveal melanoma. Lab Invest 2023;103:100022.ArticlePubMed
- 36. He Y, Yang Y, Liao Y, Xu J, Liu L, Li C, et al. miR-140-3p inhibits cutaneous melanoma progression by disrupting AKT/p70S6K and JNK pathways through ABHD2. Mol Ther Oncolytics 2020;17:83–93.PubMedPMC
- 37. Fuchs AL, Wurm JP, Neu A, Sprangers R. Molecular basis of the selective processing of short mRNA substrates by the DcpS mRNA decapping enzyme. Proc Natl Acad Sci U S A 2020;117:19237–44.ArticlePubMedPMC
- 38. Nechama M, Peng Y, Bell O, Briata P, Gherzi R, Schoenberg DR, et al. KSRP-PMR1-exosome association determines parathyroid hormone mRNA levels and stability in transfected cells. BMC Cell Biol 2009;10:70.ArticlePubMedPMCPDF
- 39. Wang Z, Kiledjian M. Functional link between the mammalian exosome and mRNA decapping. Cell 2001;107:751–62.ArticlePubMed
- 40. Boudhraa Z, Carmona E, Provencher D, Mes-Masson AM. Ran GTPase: a key player in tumor progression and metastasis. Front Cell Dev Biol 2020;8:345.ArticlePubMedPMC
- 41. Juhlin CC, Erickson LA. Genomics and epigenomics in parathyroid neoplasia: from bench to surgical pathology practice. Endocr Pathol 2021;32:17–34.ArticlePubMedPDF
- 42. Fei Y, Shimizu E, McBurney MW, Partridge NC. Sirtuin 1 is a negative regulator of parathyroid hormone stimulation of matrix metalloproteinase 13 expression in osteoblastic cells: role of sirtuin 1 in the action of PTH on osteoblasts. J Biol Chem 2015;290:8373–82.PubMedPMC
- 43. Xu Y, Qin Q, Chen R, Wei C, Mo Q. SIRT1 promotes proliferation, migration, and invasion of breast cancer cell line MCF-7 by upregulating DNA polymerase delta1 (POLD1). Biochem Biophys Res Commun 2018;502:351–7.ArticlePubMed
- 44. Zhang K, Wang M, Li Y, Li C, Tang S, Qu X, et al. The PERK-EIF2α-ATF4 signaling branch regulates osteoblast differentiation and proliferation by PTH. Am J Physiol Endocrinol Metab 2019;316:E590–604.ArticlePubMed
- 45. Babich M, Choi H, Johnson RM, King KL, Alford GE, Nissenson RA. Thrombin and parathyroid hormone mobilize intracellular calcium in rat osteosarcoma cells by distinct pathways. Endocrinology 1991;129:1463–70.ArticlePubMed
- 46. Braun A, Anders HJ, Gudermann T, Mammadova-Bach E. Platelet-cancer interplay: molecular mechanisms and new therapeutic avenues. Front Oncol 2021;11:665534.ArticlePubMedPMC
- 47. Erem C, Kocak M, Nuhoglu I, Yilmaz M, Ucuncu O. Increased plasminogen activator inhibitor-1, decreased tissue factor pathway inhibitor, and unchanged thrombin-activatable fibrinolysis inhibitor levels in patients with primary hyperparathyroidism. Eur J Endocrinol 2009;160:863–8.ArticlePubMed
- 48. Radeff JM, Nagy Z, Stern PH. Rho and Rho kinase are involved in parathyroid hormone-stimulated protein kinase C alpha translocation and IL-6 promoter activity in osteoblastic cells. J Bone Miner Res 2004;19:1882–91.PubMed
- 49. Huck K, Sens C, Wuerfel C, Zoeller C, Nakchbandi IA. The Rho GTPase RAC1 in osteoblasts controls their function. Int J Mol Sci 2020;21:385.ArticlePubMedPMC
- 50. Menendez JA, Lupu R. Oncogenic properties of the endogenous fatty acid metabolism: molecular pathology of fatty acid synthase in cancer cells. Curr Opin Clin Nutr Metab Care 2006;9:346–57.ArticlePubMed
- 51. Buckley D, Duke G, Heuer TS, O’Farrell M, Wagman AS, McCulloch W, et al. Fatty acid synthase: modern tumor cell biology insights into a classical oncology target. Pharmacol Ther 2017;177:23–31.ArticlePubMed
- 52. Huang X, Zhang Y, Qi B, Sun K, Liu N, Tang B, et al. HIF‑1α: its notable role in the maintenance of oxygen, bone and iron homeostasis (Review). Int J Mol Med 2022;50:141.ArticlePubMed
- 53. Satija S, Kaur H, Tambuwala MM, Sharma P, Vyas M, Khurana N, et al. Hypoxia-inducible factor (HIF): fuel for cancer progression. Curr Mol Pharmacol 2021;14:321–32.ArticlePubMedPDF
- 54. Wong A, Loots GG, Yellowley CE, Dose AC, Genetos DC. Parathyroid hormone regulation of hypoxia-inducible factor signaling in osteoblastic cells. Bone 2015;81:97–103.ArticlePubMedPMC
- 55. Hui AS, Bauer AL, Striet JB, Schnell PO, Czyzyk-Krzeska MF. Calcium signaling stimulates translation of HIF-alpha during hypoxia. FASEB J 2006;20:466–75.ArticlePubMedPDF
- 56. Vasef MA, Brynes RK, Sturm M, Bromley C, Robinson RA. Expression of cyclin D1 in parathyroid carcinomas, adenomas, and hyperplasias: a paraffin immunohistochemical study. Mod Pathol 1999;12:412–6.PubMed
- 57. Newey PJ, Nesbit MA, Rimmer AJ, Attar M, Head RT, Christie PT, et al. Whole-exome sequencing studies of nonhereditary (sporadic) parathyroid adenomas. J Clin Endocrinol Metab 2012;97:E1995–2005.ArticlePubMedPMC
- 58. Sharma B, Preet Kaur R, Raut S, Munshi A. BRCA1 mutation spectrum, functions, and therapeutic strategies: the story so far. Curr Probl Cancer 2018;42:189–207.ArticlePubMed
- 59. Werner H. BRCA1: an endocrine and metabolic regulator. Front Endocrinol (Lausanne) 2022;13:844575.ArticlePubMedPMC
 PubReader
 ePub Link
 Cite
Cite