Articles
- Page Path
- HOME > Endocrinol Metab > Volume 34(2); 2019 > Article
-
Original ArticleEndocrine Research Expression of NF2 Modulates the Progression of BRAFV600E Mutated Thyroid Cancer Cells
-
Mi-Hyeon You
 , Min Ji Jeon, Tae Yong Kim, Won Bae Kim, Young Kee Shong, Won Gu Kim
 -
Endocrinology and Metabolism 2019;34(2):203-212.
DOI: https://doi.org/10.3803/EnM.2019.34.2.203
Published online: June 24, 2019
Division of Endocrinology and Metabolism, Department of Internal Medicine, Asan Medical Center, University of Ulsan College of Medicine, Seoul, Korea.
- Corresponding author: Won Gu Kim. Division of Endocrinology and Metabolism, Department of Internal Medicine, Asan Medical Center, University of Ulsan College of Medicine, 88 Olympic-ro 43-gil, Songpa-gu, Seoul 05505, Korea. Tel: +82-2-3010-5883, Fax: +82-2-3010-6962, wongukim@amc.seoul.kr
• Received: March 27, 2019 • Revised: May 8, 2019 • Accepted: May 13, 2019
Copyright © 2019 Korean Endocrine Society
This is an Open Access article distributed under the terms of the Creative Commons Attribution Non-Commercial License (http://creativecommons.org/licenses/by-nc/4.0/) which permits unrestricted non-commercial use, distribution, and reproduction in any medium, provided the original work is properly cited.
ABSTRACT
-
Background
- We previously reported the frequent neurofibromatosis 2 (NF2) gene mutations in anaplastic thyroid cancers in association with the BRAFV600E mutation. We aimed to investigate the role of NF2 in thyroid cancer with BRAF mutation.
-
Methods
- To identify the function of NF2 in thyroid cancers, we investigated the changes in cell proliferation, colon formation, migration and invasion of thyroid cancer cells (8505C, BHT101, and KTC-1) with BRAFV600E mutation after overexpression and knock-down of NF2. We also examined how cell proliferation changed when NF2 was mutagenized. Human NF2 expression in papillary thyroid carcinoma (PTC) was analyzed using the The Cancer Genome Atlas (TCGA) data.
-
Results
- First, NF2 was overexpressed in 8505C and KTC-1 cells. Compared to control, NF2 overexpressed group of both thyroid cancer cells showed significant inhibition in cell proliferation and colony formation. These results were also confirmed by cell migration and invasion assay. After knock-down of NF2 in 8505C cells, there were no significant changes in cell proliferation and colony formation, compared with the control group. However, after mutagenized S288* and Q470* sites of NF2 gene, the cell proliferation increased compared to NF2 overexpression group. In the analysis of TCGA data, the mRNA expression of NF2 was significantly decreased in PTCs with lateral cervical lymph node (LN) metastasis compared with PTCs without LN metastasis.
-
Conclusion
- Our study suggests that NF2 might play a role as a tumor suppressor in thyroid cancer with BRAF mutation. More studies are needed to elucidate the mechanism how NF2 acts in thyroid cancer with BRAF mutation.
- Thyroid cancer is known to have a good prognosis, but the recurrence rate after surgery and standard treatment is about 10% to 20% [12]. In patients with an intractable or metastatic thyroid cancer, the prognosis was poor and 1-year survival rate of anaplastic thyroid cancer (ATC) is reported to be less than 10% [23]. To find effective management of these cancers, researches to elucidate the mechanism of thyroid cancer progression is needed [4].
- BRAFV600E mutation is the most common mutation in thyroid cancers which continuously activate mitogen-activated protein kinases/extracellular signal-regulated kinases (MAPK/ERK) signaling pathway. In our previous study, we performed next-generation sequencing of ATC samples and BRAF mutation was also the most frequently observed genetic changes in ATC [5]. Among newly observed mutations, neurofibromatosis 2 (NF2) mutation was common and reported in 28% of in our ATC samples.
- NF2 is a gene encoding a protein called Merlin. Its role as a tumor suppressor gene is recently known [678910]. In studies up to now, Merlin has been shown to inhibit tumor suppression by inhibiting the signaling of receptors and the Rho GTPase family present in the cancer cell membrane [101112]. One previous study also announced that NF2 and RAS mutations synergize to promote thyroid cancer growth [12]. In that study, NF2 deletion induces hippo pathway inactivation and MAPK signal intensification in vitro and in vivo, thereby activating the RAS signal and promoting tumorigenesis [12]. However, little is known about the role of NF2 in BRAFV600E mutated thyroid cancer [1213].
- Therefore, we aimed to identify the role of NF2 in thyroid cancer in association with BRAFV600E mutation in this study.
INTRODUCTION
- Cell lines and reagents
- 8505C, BHT101, and KTC-1 thyroid cancer cells were used in the experiments. All these cells have BRAFV600E mutation. KTC-1 cells were papillary origin and BHT101 and 8505C cells were anaplastic origin. All cells were maintained in Dulbecco's modified Eagle's medium high-glucose supplemented with 10% fetal bovine serum (FBS), 100 U/mL penicillin, and 100 µg/mL streptomycin (all from Gibco, Roskilde, Denmark). All cell lines were authenticated by short tandem repeat profiling.
- Cell proliferation assay
- The effects of NF2 overexpression on 8505C and KTC-1 cell proliferation were evaluated by MTT assay (Cell Bio labs, San Diego, CA, USA). The normal non-transfected (wild-type [WT] group), cytomegalovirus immediate early promoter (pCMV6)-empty-myc DDK tagged plasmid transfected (control group), and pCMV6-NF2-myc DDK-GAT TAC AAG GAT GAC GAC GAT AAG (DYKDDDDK) tagged plasmid transfected cells (1×10³ cells/mL) were cultured into 24 well plates for different durations (1, 2, 3, 4, and 5 days after stable transfection) and then MTT assay was performed. Briefly, MTT reagent was added to each well and incubated at 37℃ for 4 hours. The reaction was stopped by the addition of 100 µL Detergent Solution followed by incubated at room temperature for 2 hours to overnight protected from light. Absorbance values were then measured at 540 nm.
- Colony formation assay
- Parental or NF2 overexpressing cells (5,000 cells/well) were plated into the 6-well plate and cultured for 5 to 8 days. Cells on the plates were then fixed and stained with 0.1% crystal violet in 20% methanol. The number of colonies was counted.
- Wound healing assay
- Cells were seeded in 6-well plates and scraped with a pipette tip for 24 hours. After scraping, the cells were washed with phosphate buffered saline, photographed and placed in a medium containing 1% FBS to prevent cleavage. After 24 hours, a matched wound was filmed. The wound area was calculated by Image J (https://imagej.net).
- Transwell invasion assay
- Matrigel invasion chamber was used to investigate cell penetration ability. 105 cells (8505C and KTC-1) were placed in the coated upper chamber in serum-free medium. Complete medium containing 10% FBS was added to the lower chamber. After 24 hours, the cells remaining in the upper membrane were removed with a cotton pad, while cells invading through the membrane were stained and counted with 20% methanol and 0.1% crystal violet.
- Western blot analysis
- Western blot (WB) analysis was performed as described previously [14]. Cellular lysates were prepared using ice-cold lysis buffer (10 mM Tris-HCl [pH 7.4], 0.8 M NaCl, 1 mM ethylene glycol tetraacetic acid [EGTA], 10% sucrose, 1 mM 1,4-dithiothreitol [pH 7.4]) supplemented with a protease inhibitor cocktail and phosphatase inhibitor. Protein samples (30 µg of lysates) were separated by sodium-dodecyl sulfate-polyacrylamide gel electrophoresis on 10% to 12% (w/v) gradient NuPAGE gels (Thermo Fisher Scientific, Waltham, MA, USA) and transferred to nitrocellulose membranes (Amersham Bioscience, Piscataway, NJ, USA). The membrane was then blocked with 5% nonfat dry milk in Tris-buffered saline with 0.1% Tween 20 (TBS-T), and the NF2/Merlin (Abcam, Cambridge, UK); phosphorylated ERK (pERK; Thr202/Tyr204), ERK, actin (Cell Signaling Technology, Danvers, MA, USA). Primary antibodies were detected using a horseradish peroxidase (HRP)-conjugated secondary antibody and a Western Lightning EzWestlumi plus (ATTO, Tokyo, Japan) or Supersignal™ West Femto Maximum Sensitivity Substrate (Thermo Fisher Scientific) chemiluminescence system.
- Mutagenesis study
- The specific 863C>G,[S288*] and 1408 C>T [Q470*] mutant types in the full length NF2 (NM_200268) were generated by QuikChange Lightning Site-Directed Mutagenesis Kit (Agilent Technologies, Santa Clara, CA, USA) using according to the manufacturer's instruction. Polymerase chain reaction (PCR) primers were obtained from the Agilent Quick-change Primer Design program as follows: the 863C>G mutant type 5′-gatgtcttcaagtttaactcctgaaagcttcgtgttaataagctg-3′sense and 5′-cagcttattaacacgaagctttcaggagttaaacttgaagacatc-3′ anti-sense primers and the 1408 C>T mutant type 5′-gcggagcgaagagccaagtagaagct-cctggagatt-3′ sense and 5′-aatctccaggagcttctacttggctcttcgctccgc-3′ anti-sense primers.
- The mutants were amplified by PCR with initial 2-minute incubation at 95℃, followed by 18 cycles of 95℃ for 20 seconds, 60℃ for 10 seconds, and 68℃ for 3.5 minutes, and finally 68℃ for 5 minutes. Then, add 2 µL of the provided Dpn I restriction enzyme directly to each amplification react at 37℃ for 5 minutes. DH5a competent cells (RBC real biotech, Banqiao, Taiwan) were transformed with the PCR products. The cells were plated on Luria-Bertani (LB) agar containing kanamycin (20 µg/mL) and kept at 37℃ overnight and isolated using Plasmid Miniprep Kit (Bioneer, Seoul, Korea). Successful change in code and the NF2 insert in the plasmid were confirmed by sequencing and Western blotting.
- Small interfering RNA transfection
- All four different NF2 small interfering RNAs (si-RNAs) (small interfering NF2 [siNF2]) were designed using the best-in-class design algorithm developed by Rosetta and were synthesized by Dharmacon (Lafayette, CO, USA). KTC-1 cells were transiently transfected with four different si-RNAs against human NF2 or scrambled si-RNA using lipofectamine 3000 Reagent (Invitrogen, Carlsbad, CA, USA) according to the manufacturer's instructions. The si-RNA target sequences were as follows: human NF2-#1, ACGCCGAGAU-GGAGUUCAA; human NF2-#2, C-UUACGCCGUCCAGGCCAA; human NF2-#3, AGAAGCA-GAUUUUAGAUGA; human NF2-#4, AGGAAGCAACCCA-AGACGU and scrambled si-RNA, human control-#1, UAGCGACUAAACACAUCAA; human control-#2, UAAGGCUAUGAAGAGAUAC; human control-#3, AUGUAUUGGCCUGUAUUAG; human control-#4, AUGAACGUGAAUUGCUCAA. A scrambled si-RNA does not match any human sequences in Gene Bank search. For cell proliferation assay and colony formation, the number of cells per groups is 5,000.
- NF2 knockout via Crispr/Cas9
- KTC-1 cells were transfected with NF2 clustered regularly interspaced short palindromic repeats (Crispr)/Cas9 KO Plasmid (sc-400504, Santa Cruz Biotechnology, Santa Cruz, CA, USA) using lipofectamine 3000 following to the manufacturer's instruction. Three days later after transfection, the stably green fluorescent protein (GFP) expressing cells were sorted by flow cytometry. NF2 deletion level was then confirmed by WB. For cell proliferation assay and colony formation, the number of cells per groups is 10,000.
- Analysis of The Cancer Genome Atlas data
- The data were downloaded from the Genomic Data Commons Data Portal (https://portal.gdc.cancer.gov/). The data included somatic mutations, and clinical information from The Cancer Genome Atlas (TCGA) research. The data analysis was performed using the cgdsr package using R statistical software (http://www.R-project.org) [15]. After excluding patients without adequate clinical or genetic data, or whose samples were from metastatic tissues, total of 384 papillary thyroid carcinoma (PTC) patients were included for analysis. NF2 mRNA expression levels were analyzed according to the cervical lymph node (LN) metastasis status by the one-way analysis of variance (ANOVA) test with post hoc analysis. LN metastasis was determined by the 7th tumor node metastasis (TNM) staging system [16].
- Statistical analysis
- The data are displayed as mean±standard error. Statistical significance of three independent experiments was calculated by one-way ANOVA analysis. GraphPad Prism version 6.0 (GraphPad Software Inc., La Jolla, CA, USA) was used for statistical analysis followed by Bonferroni comparison post hoc test using Prism. All P values were two-sided and P values <0.05 were considered statistically significant.
METHODS
- Merlin protein levels in thyroid cancer cell lines
- Firstly, we confirmed the protein level of Merlin in various thyroid cell lines (Fig. 1A). It was confirmed that the cell line with BRAFV600E mutation exhibits various degrees of Merlin expression. For instance, 8505C and BHT101 cells with anaplastic origin showed a lower protein expression level of Merlin than KTC-1 cells with papillary origin.
- NF2 overexpression suppresses cell growth in 8505C and KTC-1 cells
- To elucidate the role of NF2 as a tumor suppressor in thyroid cell line, we first examined cell proliferation and colony formation after overexpression of Myc-vector (Vec) and Myc-NF2 (Fig. 1). Both 8505C and KTC-1 cells have the BRAFV600E mutation, but have different basal protein levels of Merlin and have been selected for the study of NF2 function (Fig. 1A). When the NF2 gene was overexpressed in 8505C cells with a low basal protein expression of Merlin, cell proliferation was significantly inhibited compared to the control group (P<0.05) (Fig. 1B). This tendency was also shown by colony formation in these cells. Colony size and number were significantly decreased in NF2 over-expressed cells compared with control group at Day 7 (P<0.05) (Fig. 1C). These results were also confirmed in KTC-1 cells with a relatively higher basal protein expression of Merlin (Fig. 1D, E). These results suggest that NF2 can inhibit the proliferation of thyroid cancer cells with BRAF mutation and support the role of NF2 as a tumor suppressor in BRAF mutated thyroid cancer.
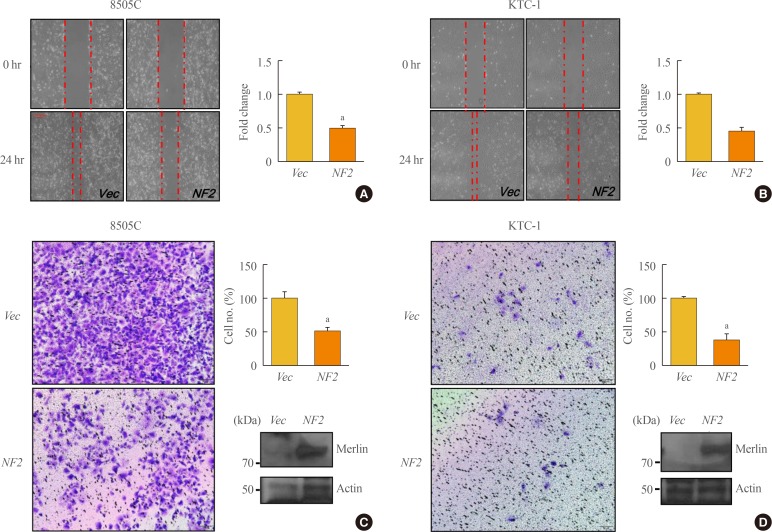
- NF2 overexpression suppresses migration and invasion of 8505C and KTC-1 cells
- We investigated cell migration and invasion in thyroid cancer cells after NF2 overexpression (Fig. 2). In 8505C cells, the cell migration ability was inhibited in the NF2 overexpressing group as compared with the control group (P<0.05) (Fig. 2A). This tendency was also observed in the KTC-1 cells (P<0.05) (Fig. 2B). In the invasion analysis of 8505C cells, invasion ability decreased in the group overexpressing NF2 compared to the control group (P<0.05) (Fig. 2C). The same trend was also observed in KTC-1 cells (P<0.05) (Fig. 2D). These results indicate that the overexpression of the NF2 gene, regardless of the basal levels, resulted in the inhibition of migration and invasion ability of the thyroid cancer cells with BRAF mutation. This also suggests that NF2 acts as a tumor suppressor in thyroid cancer with BRAF mutation.
- Downregulation of endogenous NF2 in KTC-1 cell does not affect cell growth
- After observing that cell growth was inhibited by NF2 overexpression, we conducted an experiment to find out changes in cell growth after lowering the endogenous NF2/Merlin protein level. The KTC-1 is selected as the Merlin protein level was higher than that of other thyroid cell lines. The KTC-1 cells were transiently or permanently lowered in NF2 gene levels using the si-RNA and CRISPR/CAS9 methods. KTC-1 transfected with siNF2 pool was found to have marked decreased NF2 levels between 48 and 72 hours, whereas control si-RNA pool did not affect NF2 levels significantly (Fig. 3A, B). Cell proliferation during 5 days was not significantly different between siNF2 group and control group (Fig. 3A). These results were similar in colony formation (Fig. 3B).
- GFP CRISPR/CAS9 NF2 plasmids were used to knock down NF2 gene in KTC-1 cells (Supplemental Fig. S1). GFP expression was first confirmed by confocal, and then fluorescence activated cell sorter (FACS) sorting was performed to collect cells expressing GFP at 100% (Fig. 3C, D). After subculture, we confirmed the NF2 gene level (GFP-control, GFP-NF2 CRISPR/CAS9) with WB analysis in KTC-1 cells (Fig. 3E). Cell proliferation and the colony formation were not different after NF2 knock down, compared to the control (Fig. 3E, F). There is no difference of pERK level in GFP-control, and GFP-NF2 group (Supplemental Fig. S2).
- NF2 mutagenesis enhances cell growth in 8505C and BHT101 cells
- In our previous study, NF2 mutation, which was not previously found in ATC, was found in three-elevenths frequency in association with BRAFV600E mutation, especially non-sense mutation at 288 and 470 sites [16]. Therefore, the NF2 gene sequence was mutagenized at 288 and 470 sites [5]. The proliferation assay was then performed on the 8505C cell line using these constructs (Fig. 4). As a result, it was confirmed that NF2 group showed statistically significant inhibition of cell proliferation, compared to control from Day 2 to 5. The cell proliferation of 288 and 470 sites mutagenized group were similar with that of control group and were increased compared to NF2 overexpressed group (post hoc analysis, Day 5, P<0.001). The same experiment was carried out on BHT101 cells and the same tendency was obtained (post hoc analysis, Day 4, P<0.05). These findings confirmed our previous reports [5] and also suggested the role of loss-of-function mutation of NF2 in the progression of thyroid cancer with BRAF mutation.
- Association of NF2 levels and the prognosis of PTC patients
- We analyzed TCGA data of 523 PTC patients with available clinical and pathological information. The median age of patients was 47 years and 278 patients (72%) were female. Of them, 130 patients (34%) showed advanced disease stages (TNM stage III/IV by the 7th TNM staging system) and 162 patients (42%) had LN metastasis including 72 patients with lateral cervical LN metastasis. When we compared the mRNA expression of NF2 according to the LN metastasis status, it was significantly associated with the LN metastasis status (P=0.030, data not shown). This trend was also significant in subgroup analysis according to BRAF mutant status (P=0.035 in BRAF WT group, P=0.012 in BRAFV600E mutant group) (Fig. 5). Especially, mRNA expression of NF2 was significantly decreased in PTCs with lateral cervical LN metastasis (N1b by 7th TNM staging system), compared to PTCs without LN metastasis in both BRAF wild group and BRAFV600E mutant group (Fig. 5).
RESULTS
- In this in vitro analysis evaluating the role of NF2 in BRAF mutated thyroid cancer cells, NF2 overexpression significantly inhibited cell proliferation, colony formation, migration and invasion of BRAF mutated thyroid cancer cells. Even though NF2 knock-down did not significantly affect the proliferation of thyroid cancer cells with BRAF mutation, mutagenesis study showed that loss-of-function mutation of NF2 increased proliferation of thyroid cancer cell, compared to NF2 overexpression group. Our findings suggest that NF2 has a role as a tumor suppressor in thyroid cancers with BRAF mutation. In the analysis of TCGA data, it was observed that the mRNA expression of NF2 was lower when the cervical LN metastasis progressed to the lateral cervical area. Our findings suggested that NF2 has a tumor suppressive role in thyroid cancer progression.
- We tried to find the underlying mechanism how NF2 overexpression inhibits the proliferation of thyroid cancer cells but, we could not find significant cellular signal changes after NF2 overexpression, compared to the control. The pERK signal aberrantly activated by the BRAFV600E mutation was influenced by also NF2 overexpression [17]. Knock-down of base-line signaling of NF2 by si-RNA and CRISPR/CAS9 system also had insignificant effects on cancer cell proliferation and colony formation. Considering this result, it might be thought that NF2 had a little impact on the signaling pathways activated by BRAF mutation. This finding is interesting because of loss of NF2 signaling could promoted thyroid carcinogenesis in RAS mutated thyroid cancer [12]. This might be one of the evidence that oncogenic driver mutations affects the distinct cellular responses of tumor suppressors.
- NF2 gene is a protein belonging to the ezrin-radixin-Moesin family [18]. It is known as a protein that binds to the membrane actin cytoskeleton and is thought to be a factor controlling the cytoskeleton dynamics of the cell [5]. When we look at this feature, another possibility is to consider the paper that NF2 gene, which acted as a tumor suppressor in mesothelioma, negatively regulates focal adhesion kinase (FAK) rather than mechanistic target of rapamycin pathway [181920]. That paper showed that NF2 regulates cell motility and invasion by decreasing phosphorylation at the Tyr397 region of FAK. So, it is believed that further research is needed to determine exact mechanism how NF2/Merlin acts as a tumor suppressor when the expression was significantly increased.
- Collectively, our findings support that the role of NF2 in thyroid cancer progression in BRAF mutated thyroid cancer. In vitro studies have demonstrated that NF2 plays a role as tumor suppressor in thyroid cancer cells with BRAFV600E mutation, demonstrating that it is, at least in part, related to the progression of thyroid cancer.
DISCUSSION
-
Acknowledgements
- This study was supported by the National Research Foundation (NRF) of Korea Research Grant (NRF-2015R1C1A1A0203659).
ACKNOWLEDGMENTS
-
CONFLICTS OF INTEREST: No potential conflict of interest relevant to this article was reported.
-
AUTHOR CONTRIBUTIONS:
Article information
SUPPLEMENTARY MATERIALS
Supplemental Fig. S1
Supplemental Fig. S2
- 1. Jung KW, Won YJ, Oh CM, Kong HJ, Lee DH, Lee KH, et al. Cancer statistics in Korea: incidence, mortality, survival, and prevalence in 2014. Cancer Res Treat 2017;49:292–305. ArticlePubMedPMCPDF
- 2. Landa I, Ibrahimpasic T, Boucai L, Sinha R, Knauf JA, Shah RH, et al. Genomic and transcriptomic hallmarks of poorly differentiated and anaplastic thyroid cancers. J Clin Invest 2016;126:1052–1066. ArticlePubMedPMC
- 3. Swaak-Kragten AT, de Wilt JH, Schmitz PI, Bontenbal M, Levendag PC. Multimodality treatment for anaplastic thyroid carcinoma: treatment outcome in 75 patients. Radiother Oncol 2009;92:100–104. ArticlePubMed
- 4. Ain KB, Egorin MJ, DeSimone PA. Collaborative Anaplastic Thyroid Cancer Health Intervention Trials (CATCHIT) Group. Treatment of anaplastic thyroid carcinoma with paclitaxel: phase 2 trial using ninety-six-hour infusion. Thyroid 2000;10:587–594. ArticlePubMed
- 5. Jeon MJ, Chun SM, Kim D, Kwon H, Jang EK, Kim TY, et al. Genomic alterations of anaplastic thyroid carcinoma detected by targeted massive parallel sequencing in a BRAF(V600E) mutation-prevalent area. Thyroid 2016;26:683–690. ArticlePubMed
- 6. Gutmann DH. The neurofibromatoses: when less is more. Hum Mol Genet 2001;10:747–755. ArticlePubMedPDF
- 7. James MF, Han S, Polizzano C, Plotkin SR, Manning BD, Stemmer-Rachamimov AO, et al. NF2/merlin is a novel negative regulator of mTOR complex 1, and activation of mTORC1 is associated with meningioma and schwannoma growth. Mol Cell Biol 2009;29:4250–4261. ArticlePubMedPMC
- 8. Lopez-Lago MA, Okada T, Murillo MM, Socci N, Giancotti FG. Loss of the tumor suppressor gene NF2, encoding merlin, constitutively activates integrin-dependent mTORC1 signaling. Mol Cell Biol 2009;29:4235–4249. ArticlePubMedPMC
- 9. Guerrero PA, Yin W, Camacho L, Marchetti D. Oncogenic role of Merlin/NF2 in glioblastoma. Oncogene 2015;34:2621–2630. ArticlePubMedPDF
- 10. Petrilli AM, Fernandez-Valle C. Role of Merlin/NF2 inactivation in tumor biology. Oncogene 2016;35:537–548. ArticlePubMedPDF
- 11. Piccolo S, Dupont S, Cordenonsi M. The biology of YAP/TAZ: hippo signaling and beyond. Physiol Rev 2014;94:1287–1312. ArticlePubMed
- 12. Garcia-Rendueles ME, Ricarte-Filho JC, Untch BR, Landa I, Knauf JA, Voza F, et al. NF2 loss promotes oncogenic RAS-induced thyroid cancers via YAP-dependent transactivation of RAS proteins and sensitizes them to MEK inhibition. Cancer Discov 2015;5:1178–1193. ArticlePubMedPMC
- 13. Yu C, Zhang L, Luo D, Yan F, Liu J, Shao S, et al. MicroRNA-146b-3p promotes cell metastasis by directly targeting NF2 in human papillary thyroid cancer. Thyroid 2018 9 22 [Epub].Article
- 14. Jeon MJ, Lim S, You MH, Park Y, Song DE, Sim S, et al. The role of Slit2 as a tumor suppressor in thyroid cancer. Mol Cell Endocrinol 2019;483:87–96. ArticlePubMed
- 15. Suh S, Kim YH, Goh TS, Jeong DC, Lee CS, Jang JY, et al. mRNA expression of SLC5A5 an SLC2A family genes in papillary thyroid cancer: an analysis of The Cancer Genome Atlas. Yonsei Med J 2018;59:746–753. ArticlePubMedPMC
- 16. Edge SB, Compton CC. The American Joint Committee on Cancer: the 7th edition of the AJCC cancer staging manual and the future of TNM. Ann Surg Oncol 2010;17:1471–1474. ArticlePubMedPDF
- 17. Friedl P, Wolf K. Tumour-cell invasion and migration: diversity and escape mechanisms. Nat Rev Cancer 2003;3:362–374. ArticlePubMedPDF
- 18. Poulikakos PI, Xiao GH, Gallagher R, Jablonski S, Jhanwar SC, Testa JR. Re-expression of the tumor suppressor NF2/merlin inhibits invasiveness in mesothelioma cells and negatively regulates FAK. Oncogene 2006;25:5960–5968. ArticlePubMedPDF
- 19. Schlaepfer DD, Mitra SK. Multiple connections link FAK to cell motility and invasion. Curr Opin Genet Dev 2004;14:92–101. ArticlePubMed
- 20. Mitra SK, Hanson DA, Schlaepfer DD. Focal adhesion kinase: in command and control of cell motility. Nat Rev Mol Cell Biol 2005;6:56–68. ArticlePubMedPDF
References
Fig. 1
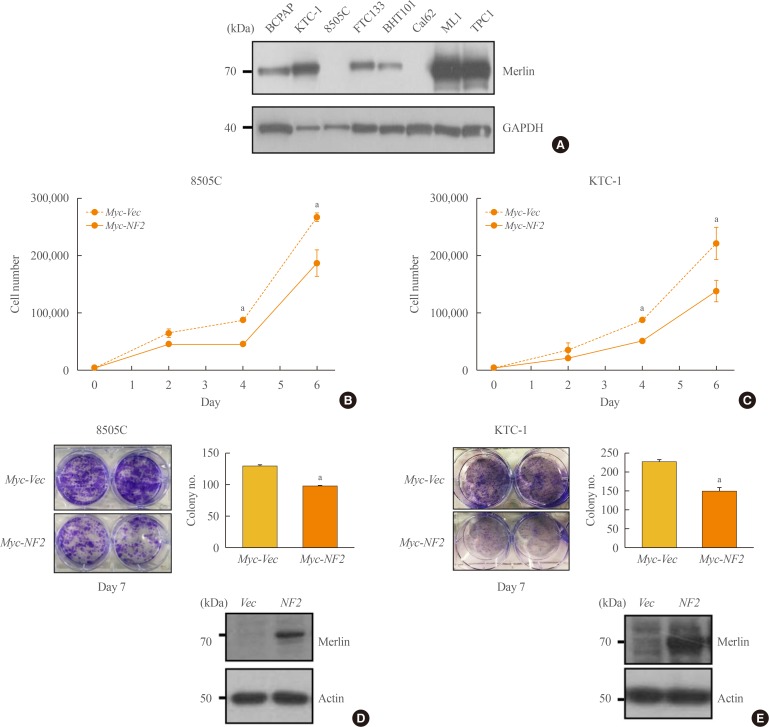
Neurofibromatosis 2 (NF2) overexpression suppresses cell growth in 8505C and KTC-1 cells. (A) Western blot analysis confirmed the differences in the Merlin protein expression between groups. (B) Proliferation assay to measure the cell growth rate in control and NF2 overexpressing 8505C cells. (C) Colony formation assay of 8505C cells in Day 7. (D) Proliferation assay to measure the cell growth rate in control and NF2 overexpressing KTC-1 cell. (E) Colony formation assay of KTC-1 cells in Day 7. Each data point represents mean±standard error of three independent experiments. GAPDH, glyceraldehyde 3-phosphate dehydrogenase; Vec, vector. aP<0.05.
Fig. 2

Neurofibromatosis 2 (NF2) overexpression inhibits cancer cell migration and invasion cancer in 8505C and KTC-1 cell. (A, B) In vitro wound healing assay in control and NF2 overexpressing thyroid cancer cells. Image was measured after 0, 24 hours after scratching (left) and quantification of wound closure was expressed in graph (right) (A) 8505C, (B) KTC-1. (C, D) In vitro transwells assay in control and NF2 overexpressing thyroid cancer cells. Representative images of invasive potential are shown and quantification was expressed in the bar graph (right) (C) 8505C, (D) KTC-1. The photographs were taken at 100×X and the bar size was 50 µm. Each data point represents mean±standard error of three independent experiments. Vec, vector. aP<0.05.
Fig. 3
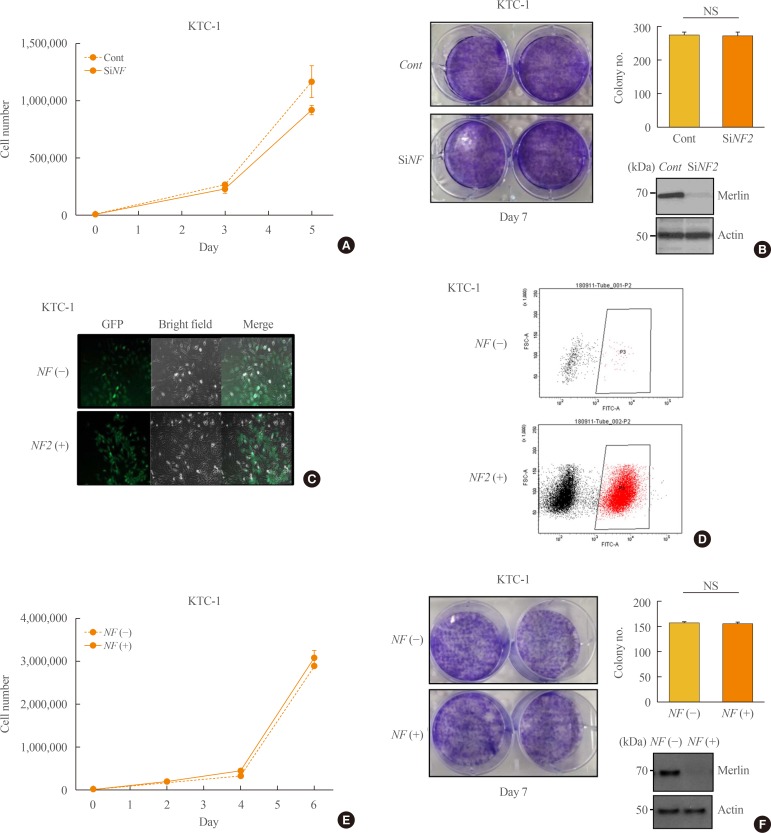
Neurofibromatosis 2 (NF2) loss fails to suppress growth in KTC-1 cells. (A) Proliferation assay to measure the cell growth rate in the control and small interfering NF2 (siNF2) KTC-1 cells. (B) Colony formation assay in the control and siNF2 KTC-1 cells. After the NF2/control clustered regularly interspaced short palindromic repeats (CRISPR) were conducted in the KTC-1 cell line, the NF2 gene knock out rate were measured using (C) confocal image, (D) fluorescence activated cell sorter sorting, (E) proliferation assay to measure the cell growth rate in the control KTC-1 cells and NF2 knock down KTC-1 cells using CRISPR/Cas9 system. (F) Colony formation assay in KTC-1 cells using CRISPR/Cas9 system. Each data point represents mean±standard error of three independent experiments. NS, no significant; FSC-A, forward Scatter-A; FITC-A, fluorescin isothiocyanate-A.
Fig. 4

Neurofibromatosis 2 (NF2) mutagenesis enhances cell growth in 8505C and BHT101 cells. (A, B) Mutagenesis of the NF2 gene was performed on 8505C and BHT101. Cell proliferation was assessed in control and NF2 overexpressing thyroid cancer cells and also mutagenized thyroid cancer cells at 288 and 470 sites of NF2 gene. (A) 8505C: the control, 288, and 470 site of NF2 gene group showed significant decreased cell proliferation compared to NF2 group. (B) BHT101: the control, 288, and 470 site of NF2 gene group showed significant decreased cell proliferation compared to NF2 group. Each data point represents mean±standard error of three independent experiments. OD, optical density; pCMV, cytomegalovirus immediate early promoter. aP<0.001; bP<0.05.
Fig. 5
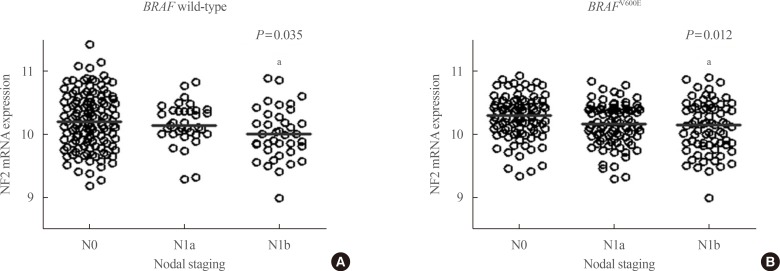
Association between neurofibromatosis 2 (NF2) expression and cervical lymph node (LN) metastasis of papillary thyroid cancer. By The Cancer Genome Atlas data, mRNA expression of NF2 was significantly different according to cervical LN metastasis status. Especially, mRNA expression of NF2 was significantly decreased in papillary thyroid carcinomas (PTCs) with lateral cervical LN metastasis, compared to PTCs without LN metastasis in both (A) BRAF wild-type group and (B) BRAFV600E mutant group. Y-axis showed log2 transformed mRNA expression of NF2. In post hoc analysis, mRNA expression of NF2 was significantly different between N0 and N1b group. aP<0.05.
Figure & Data
References
Citations
Citations to this article as recorded by 
- Mechanistic Insights of Thyroid Cancer Progression
Luis Javier Leandro-García, Iñigo Landa
Endocrinology.2023;[Epub] CrossRef - Gene Editing with CRISPR/Cas Methodology and Thyroid Cancer: Where Are We?
Cesar Seigi Fuziwara, Diego Claro de Mello, Edna Teruko Kimura
Cancers.2022; 14(3): 844. CrossRef - Extracellular Vesicles as Signal Carriers in Malignant Thyroid Tumors?
Małgorzata Grzanka, Anna Stachurska-Skrodzka, Anna Adamiok-Ostrowska, Ewa Gajda, Barbara Czarnocka
International Journal of Molecular Sciences.2022; 23(6): 3262. CrossRef - Mitofusin-2 modulates the epithelial to mesenchymal transition in thyroid cancer progression
Mi-Hyeon You, Min Ji Jeon, Seong ryeong Kim, Woo Kyung Lee, Sheue-yann Cheng, Goo Jang, Tae Yong Kim, Won Bae Kim, Young Kee Shong, Won Gu Kim
Scientific Reports.2021;[Epub] CrossRef - High Phosphoglycerate Dehydrogenase Expression Induces Stemness and Aggressiveness in Thyroid Cancer
Min Ji Jeon, Mi-Hyeon You, Ji Min Han, Soyoung Sim, Hyun Ju Yoo, Woo Kyung Lee, Tae Yong Kim, Dong Eun Song, Young Kee Shong, Won Gu Kim, Won Bae Kim
Thyroid.2020; 30(11): 1625. CrossRef
 PubReader
 ePub Link
 Cite
Cite