BRAFV600E Mutation Enhances Estrogen-Induced Metastatic Potential of Thyroid Cancer by Regulating the Expression of Estrogen Receptors
Article information

Abstract
Background
Cross-talk between mitogen-activated protein kinase and estrogen has been reported; however, the role of BRAFV600E in the estrogen responsiveness of thyroid cancer is unknown. We elucidated the effect of BRAFV600E on the estrogen-induced increase in metastatic potential in thyroid cancer.
Methods
Using a pair of cell lines, human thyroid cell lines which harbor wild type BRAF gene (Nthy/WT) and Nthy/BRAFV600E (Nthy/V600E), the expression of estrogen receptors (ERs) and estrogen-induced metastatic phenotypes were evaluated. Susceptibility to ERα- and ERβ-selective agents was evaluated to confirm differential ER expression. ESR expression was analyzed according to BRAFV600E status and age (≤50 years vs. >50 years) using The Cancer Genome Atlas (TCGA) data.
Results
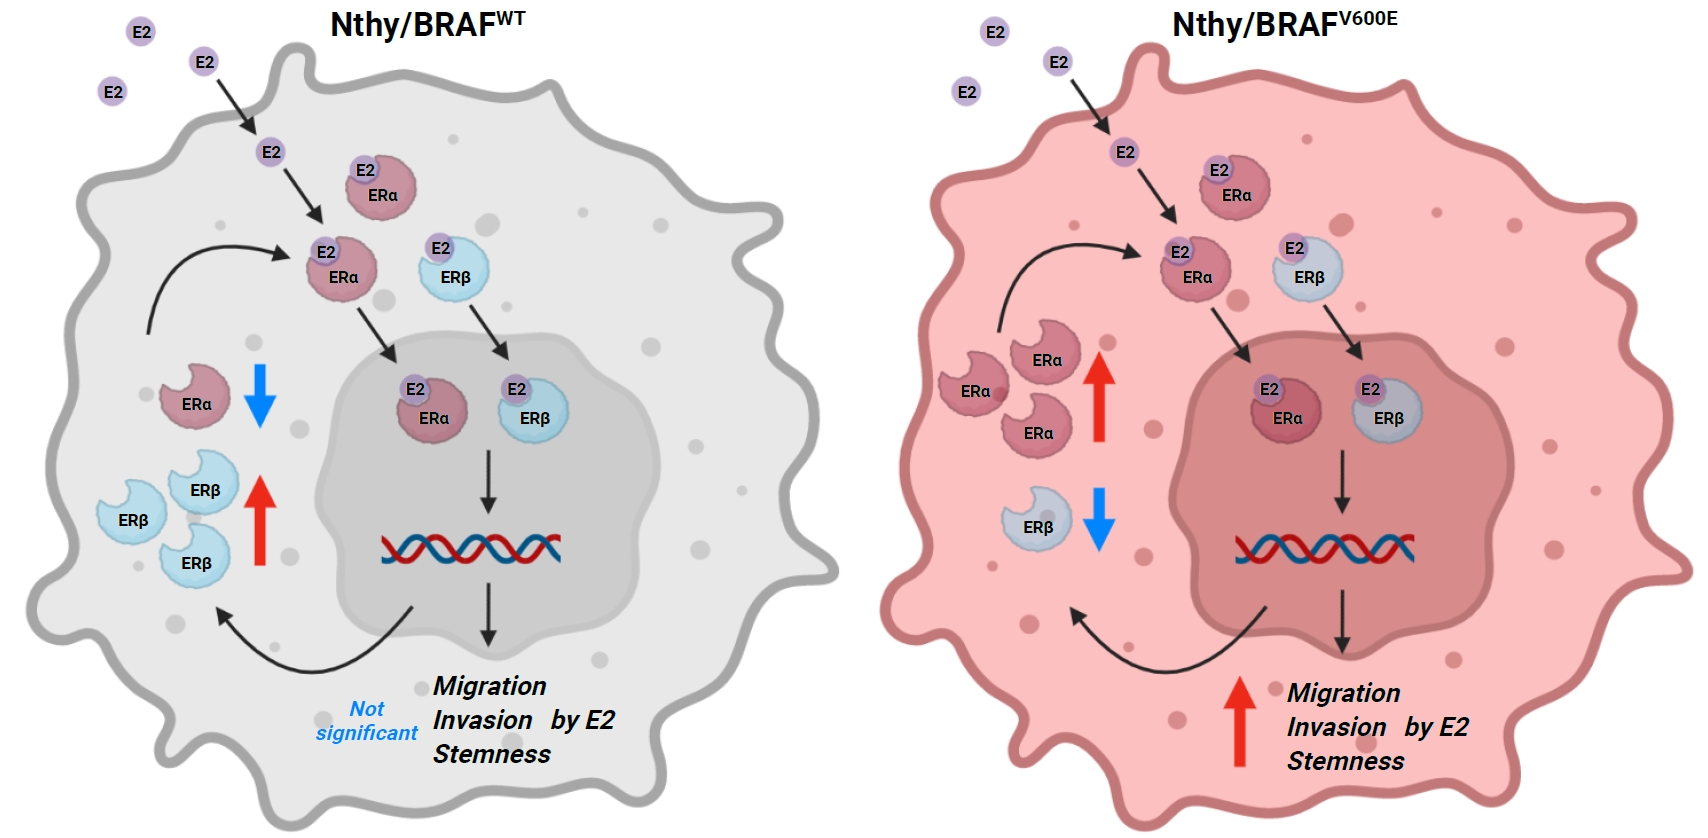
Estradiol increased the ERα/ERβ expression ratio in Nthy/V600E, whereas the decreased ERα/ERβ expression ratio was found in Nthy/WT. BRAFV600E-mutated cell lines showed a higher E2-induced increase in metastatic potential, including migration, invasion, and anchorage-independent growth compared with Nthy/WT. An ERα antagonist significantly inhibited migration in Nthy/V600E cells, whereas an ERβ agonist was more effective in Nthy/WT. In the BRAFV600E group, ESR1/ESR2 ratio was significantly higher in younger age group (≤50 years) compared with older age group (>50 years) by TCGA data analysis.
Conclusion
Our data show that BRAFV600E mutation plays a crucial role in the estrogen responsiveness of thyroid cancer by regulating ER expression. Therefore, BRAFV600E might be used as a biomarker when deciding future hormone therapies based on estrogen signaling in thyroid cancer patients.
INTRODUCTION
Thyroid cancer is a highly prevalent endocrine malignancy and its incidence has been increasing continuously worldwide [1,2]. Thyroid cancer occurs more frequently in relatively young individuals and shows a sex disparity, with female sex constituting a risk factor. In particular, the cancer risk has been reported to be higher in women who are premenopausal and pregnant, whereas the incidence decreases after menopause, in women between 45 and 55 years of age, which is characterized by dramatic decreases in the estrogen level in women [3-7]. Among the putative reasons for the sex disparity in the incidence of thyroid cancer, several studies have highlighted estrogen as a key contributor to increased risk of thyroid cancer [8,9].
The role of estrogen has long been investigated in thyroid, breast, and ovarian cancers. Estradiol (E2), which is a major form of estrogen, promotes metastatic potential, such as proliferation, migration, invasion, and stemness, in in vitro and in vivo models; this occurs mainly via estrogen receptor alpha and beta (ERα and ERβ), which are encoded by estrogen receptor 1 (ESR1) and ESR2, respectively [10-14]. Interestingly, the two receptors are involved in different downstream pathways: ERα is known to promote proliferation and anti-apoptotic signals, whereas ERβ is known to induce cell differentiation and proapoptotic signals [15,16]. Elucidation of the function of these receptors has shown that a higher ERα expression over ERβ and a higher ratio of ERα:ERβ in thyroid cancer patients were reported to be associated with poor prognostic factors at both the mRNA and protein levels [17,18]. Additionally, recent studies have suggested that estrogen promotes the metastatic potential of thyroid cancer through ERs [10,11,19].
BRAFV600E, the most common mutation in thyroid cancer, is known to be associated with poor clinical outcomes such as recurrence and mortality [20-22]. Interestingly, Yi et al. [18] reported that BRAFV600E is significantly associated with higher ESR1 and lower ESR2 expression in papillary thyroid cancer (PTC). A mitogen-activated protein kinase (MAPK) has been known to be closely related to estrogen signaling [23-25]. However, the effect of BRAFV600E on the expression of ERα and ERβ and estrogen responsiveness in thyroid cancer have not been studied so far. Other cancer types relevant to BRAFV600E and ERs such as melanoma and colorectal cancer are known to be ERβ-dominant unlike breast cancer and thyroid cancer, which are ERα-dominant [26,27]. Interestingly, melanoma with BRAFV600E is not responsive to ERβ-agonist unlike the NRAS-positive one, suggesting a potential of genomic driver mutations in estrogen signaling [26].
Thus, we aimed to elucidate the role of BRAFV600E in ER expression and estrogen responsiveness in the human thyroid cell line Nthy-ori 3-1. In addition, we investigated the association of BRAFV600E status and age group with the expression of ESR1 and ESR2.
METHODS
Cell culture
Nthy/BRAFWT (human thyroid cell lines which harbor wild type BRAF gene [Nthy/WT]) and Nthy/BRAFV600E (Nthy/V600E) are newly established cell lines expressing either BRAFWT or BRAFV600E by lentiviral transduction of human thyroid cell line Nthy-ori 3-1 [28,29]. Nthy/vector was not included because its functional activities such as colony formation and invasion were not observed in the previous study [28]. Also, in vivo tumorigenesis is also not observed in any of Nthy-ori 3-1, Nthy/vector, and Nthy/WT (data not included). Thus, Nthy/WT and Nthy/V600E were used in this study and grown in Roswell Park Memorial Institute (RPMI) 1640 supplemented with 10% fetal bovine serum (FBS, #S1480, Biowest, Nuaillé, France), 2 mM GlutaMAX (#35050061, Gibco, Waltham, MA, USA), and 100 U/mL penicillin-streptomycin (#15140122, Gibco) in a humidified atmosphere of 5% CO2 at 37°C. All cell lines were maintained for a month and replaced with another identically passaged vial. A Short Tandem Repeat (STR) analysis was performed by Korean Cell Line Bank (Seoul, Korea) using AmpFLSTR identifiler PCR Amplification Kit (#4322288, Applied Biosystems, Waltham, MA, USA) and validated that all the cell lines have the same STR profiles as that of ‘Nthy-ori 3-1’ (RRID: CVCL_2659). The absence of mycoplasma in the cell lines was demonstrated by Korean Cell Line Bank using e-Myco plus Mycoplasma PCR Detection Kit (#25237, iNtRON Biotechnology, Seongnam, Korea).
Western blot analysis
Before experiments, cells were incubated in phenol red-free RPMI 1640 with 10% FBS for 24 hours followed by of treatment of 100 nM E2 (#E2257, Sigma, St. Louis, MO, USA) for 24 hours. The concentration was determined based on other studies and the results of our invasion assay [10-12,14]. Cell lysates were prepared using RIPA buffer (#RC2002-050-00, Biosesang, Seongnam, Korea) containing protease inhibitor cocktail (#8340, Sigma) and phosphatase inhibitor cocktail 2 and 3 (#p5726 and #p0044, Sigma). The protein concentrations were determined using BCA method and resuspended in sodium dodecyl sulfate–polyacrylamide gel electrophoresis (SDS-PAGE) loading buffer (#SF2002-110-00, Biosesang) at 1 μg/μL followed by incubation at 95°C for 5 minutes. For 10% SDS-PAGE, 15 μg (for ERα) or 25 μg (for ERβ) of the protein sample was loaded and separated in Tris-Glycine running buffer. Polyvinylidene difluoride membrane was used to transfer the proteins and then blocked in 5% nonfat dry milk at room temperature for 30 minutes. Subsequently, they were incubated in primary antibodies at 4°C overnight: rabbit monoclonal antibody ‘ab108398’ (1:4,000, clone: EPR4097, Abcam, Cambridge, MA, USA) for ERα, rabbit polyclonal antibody ‘ab3576’ (1:4,000, Abcam) for ERβ, rabbit monoclonal antibody ‘#2118’ (1:10,000, clone: 14C10, Cell Signaling Technology, Danvers, MA, USA) for glyceraldehyde-3-phosphate dehydrogenase (GAPDH) as an endogenous control. Detection was performed using Luminata Forte Western HRP Substrate (#ELLUF0100, Millipore, Burlington, MA, USA) following 2 hours of incubation in the secondary antibody at room temperature: anti-rabbit HRP-conjugated antibody ‘#7074’ (1:4,000, clone: 14C10, Cell Signaling Technology). Densitometry analysis was performed using Image Lab (Bio-Rad Laboratories, Hercules, CA, USA). ERα and ERβ were normalized by GAPDH first, and fold change by E2 treatment was calculated in each experiment. The ratio of ERα and ERβ was calculated by using the GAPDH-normalized ERα and ERβ values, and the relative fold change in Fig. 1B is visualized based on the ratio of the normalized expression in E2-treated group over control group to show the effect of E2 on expression of ERs depending on BRAF status. Statistical tests were performed between Nthy/WT and Nthy/V600E with four biological replicates.
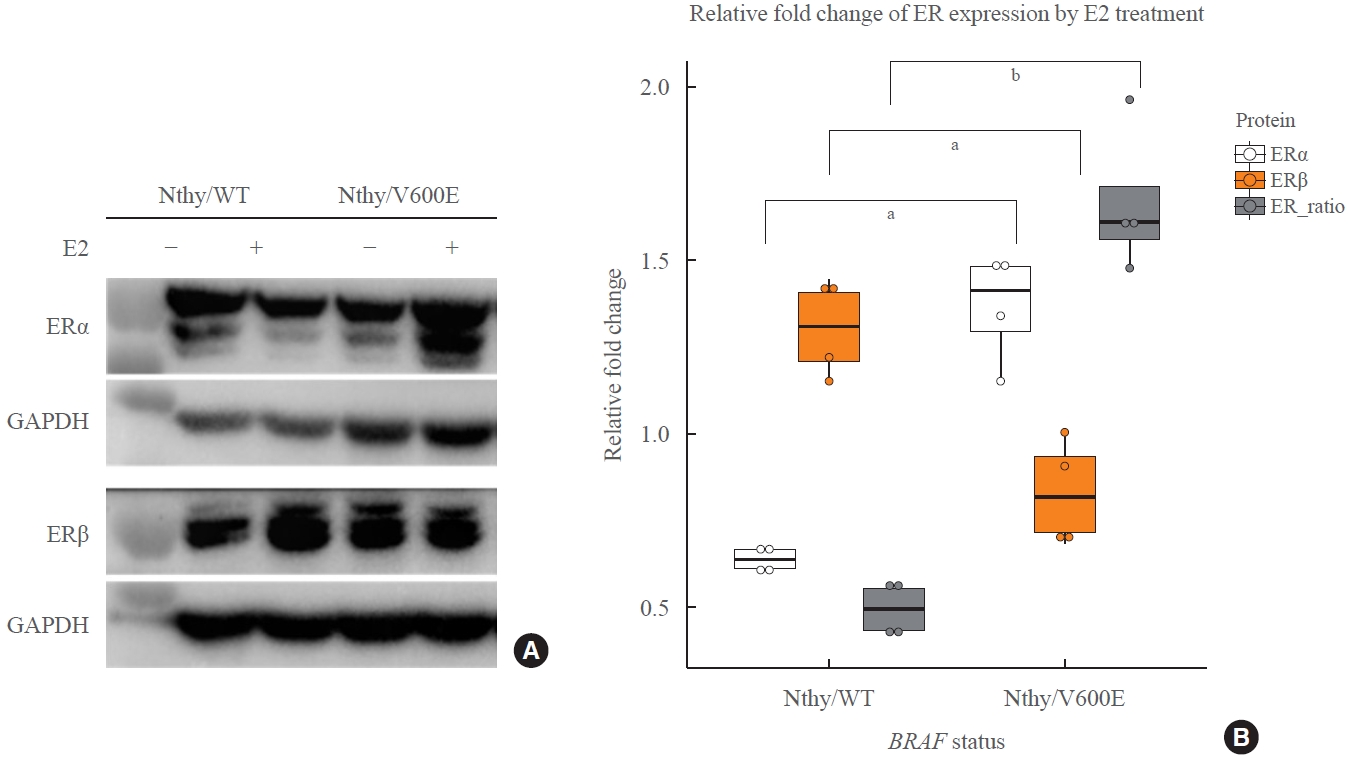
Expression change of estrogen receptor α (ERα) and ERβ in thyroid cell lines by E2 treatment depending on BRAFV600E status. (A) Expression of estrogen receptors were measured to see how BRAFV600E affects regulation of the receptors in thyroid cell lines. All cell lines were cultured in phenol red-free complete medium and treated with 100 nM of E2 for 24 hours. The response to E2 treatment was opposite between human thyroid cell lines which harbor wild type BRAF gene (Nthy/WT) and Nthy/BRAFV600E (Nthy/V600E). It shows increased ERα and decreased ERβ in Nthy/V600E whereas decreased ERα and increased ERβ in Nthy/WT by E2 treatment. (B) Densitometry results for fold change of ERα, ERβ, and the ratio of ERα over ERβ after E2 treatment. Each value was calculated by fold change of glyceraldehyde-3-phosphate dehydrogenase (GAPDH)-normalized levels of ER proteins on the same membranes. E2 treatment induced decreased ER ratio in Nthy/WT, but increased in Nthy/V600E (0.50 vs. 1.67, P=0.0006). aP<0.01; bP<0.001.
Transwell migration and invasion assay
BD cell culture inserts with 8-μm pore for 24-well plates (#353097, BD Bioscience, Bedford, MA, USA) were used and coated with 40 μL of 0.5 mg/mL growth factor-reduced Matrigel (#356230, BD Bioscience) for invasion assay. Matrigel was equilibrated for 12 hours at 37°C in 5% CO2 before cell loading. Cells were incubated in phenol red-free complete RPMI medium supplemented with 2% dextran charcoal-stripped FBS for 48 hours before the experiments and harvested using TrypLE Express without phenol red (#12604-021, Gibco). The harvested cells were resuspended in RPMI without FBS at 1E6 cells/mL, and 100 μL of the cell suspension was loaded onto the culture inserts. The bottom chambers were filled with RPMI with 2% FBS. Either dimethyl sulfoxide (DMSO) or E2 was added to both the upper and bottom chambers and incubated for 24 hours at 37°C in 5% CO2. After the incubation, the cells on the upper side of the culture inserts were removed using cotton swabs and the media in the bottom chambers were carefully aspirated. To measure the amount of migrated or invaded cells under the culture inserts and on the bottom wells quantitatively, CellTiter-Glo Luminescent Cell Viability Assay (#G7572, Promega, Madison, WI, USA) was used based on the manufacturer’s instruction. The measured values (relative light unit) were displayed with fold change by dividing by negative controls (0 nM of E2 in each cell line), and statistical significance was tested after log2 transformation.
Soft-agar colony formation assay
Soft-agar assay was performed using CytoSelect 96-Well Cell Transformation Assay kit (#CBA-130, Cell Biolabs, San Diego, CA, USA). Nthy/WT and Nthy/V600E cells were seeded at about 7,000 cells per well in 24-well plates in a top layer of 0.4% agarose on a base layer of 1.2% agarose. Culture medium containing DMSO or E2 was added to each well and cultured for 2 weeks changing the media every 2 to 3 days. After about 2 weeks, the number of cells was measured quantitatively by using the fluorescent dye included in the assay kit following the manufacturer’s instruction. The detected relative fluorescence units using SpectraMax M5 (Molecular Devices, San Jose, CA, USA) were normalized by the no-cell controls, and fold changes of E2-treated groups over the control group in each experiment were visualized.
Wound healing assay
Nthy/WT and Nthy/V600E were seeded at 5E4 cells per each well in 24-well culture plate and incubated until all wells reach 100% confluence. Each well was wounded by scratching with a SPLScar scratcher (#201925, SPL Life Science, Pocheon, Korea) and washed with Dulbecco’s phosphate-buffered saline (DPBS) with Ca2+ and Mg2+ to remove the debris followed by filling up 400 μL of complete media with 10% FBS and phenol red. After confirming that wounds are evenly formed without a chunk of cells, we added 100 μL of media containing either DMSO, 50 nM of diarylpropionitrile (DPN; #1494, ERβ-selective agonist, Tocris Bioscience, Bristol, UK), or 5 μM of methylpiperidino pyrazole (MPP; #13863, ERα-selective antagonist, Cayman Chemical, Ann Arbor, MI, USA). The concentrations were determined based on the previous studies using these molecules [30-32]. We marked the clearly scratched area under the plates before incubation and took pictures after 0 and 6 hours of incubation. In the two matched images, we made two representative borders for before and after incubation with black and red colors, respectively. The difference of widths between the borders was measured for each condition to compare the relative migrated area.
RNA-sequencing and clinical data from The Cancer Genome Atlas
To analyze expression pattern of ESR1 and ESR2 in thyroid cancer patients depending on BRAFV600E status and age group, we downloaded clinicopathologic, somatic mutation, and mRNA expression count data of 365 female PTC patients that both clinical and RNA-sequencing data are available from The Cancer Genome Atlas (TCGA) data portal. In the dataset, mRNA sequencing experiments were performed by University of North Carolina using a HiSeq 2000 (Illumina, San Diego, CA, USA). Gene expression counts were expressed as RNA-sequencing by expectation maximization (RSEM) with upper quartile normalization, while RSEM results pertaining to the ESR1 and ESR2 genes were extracted from RNA-sequencing data. The ‘ESR ratio’ was defined as ESR1 to ESR2 (ESR1/ESR2) RSEM count. Data pertaining to somatic mutations of BRAF genes were obtained from the mutation calling file provided by Broad Institute and Baylor College of Medicine using an Illumina Genome Analyzer. We have previously reviewed pathologic documents downloaded from TCGA to correct some inaccurate data. Expression of ESR1, ESR2, and ESR ratio were analyzed by dividing into four groups depending on the two factors: BRAFV600E status (excluded two patients with different types of BRAF mutation) and age 50 at diagnosis. Gene signatures such as thyroid differentiation score (TDS), BRAFV600E-Ras score (BRS), and M2 macrophage signature (M2) were calculated using single-sample gene set enrichment analysis (ssGSEA) based on the markers reported by the TCGA group and expressed in log2- transformed z-score [33].
Statistical analysis
Statistical analyses were performed using GraphPad PRISM version 8.0.0 (GraphPad Software, San Diego, CA, USA) for experimental data and R version 4.0.3 (R Foundation for Statistical Computing, Vienna, Austria) for TCGA data. Data are presented as mean±standard deviation. The independent t test or Mann-Whitney test was used for comparison of continuous variables. Statistical significance was defined as two-sided P<0.05.
RESULTS
BRAFV600E regulates E2-induced expression of ERα and ERβ in human thyroid cell lines
At the basal level in the described culture condition, Nthy/V600E expressed lower ERα levels and higher ERβ levels than Nthy/WT (Fig. 1A). However, following E2 treatment, Nthy/WT cells decreased the ERα/ERβ ratio by downregulating and upregulating the expression of ERα and ERβ, respectively (Fig. 1). In contrast, Nthy/V600E manifested an increased ERα/ERβ ratio through the upregulation of ERα and a slight decrease in ERβ expression in response to E2 (Fig. 1). As these cell lines have an identical genomic background except for BRAFV600E expression, BRAFV600E is likely to be involved in the downstream estrogen signaling pathways in this human thyroid cancer cell line.
BRAFV600E promotes E2-induced migration and invasion of thyroid cell lines
The E2 treatment increases the migration and invasion ability of thyroid cancer cell lines, which are especially important in the initial process of cancer metastasis. There was little change in the migratory ability of Nthy/WT based on the treatment concentration of E2, whereas Nthy/V600E was more sensitive to the E2 concentration (Fig. 2A). Moreover, invasion was significantly increased in Nthy/V600E, but not in Nthy/WT (Fig. 2A). Despite no significant difference in migration, it was evident that Nthy/V600E was more susceptible to E2-induced increase in migration and invasion than was Nthy/WT. It is consistent with the expression changes of ERs in response to E2 treatment: increased and decreased ERα/ERβ ratio in Nthy/V600E and Nthy/WT, respectively.
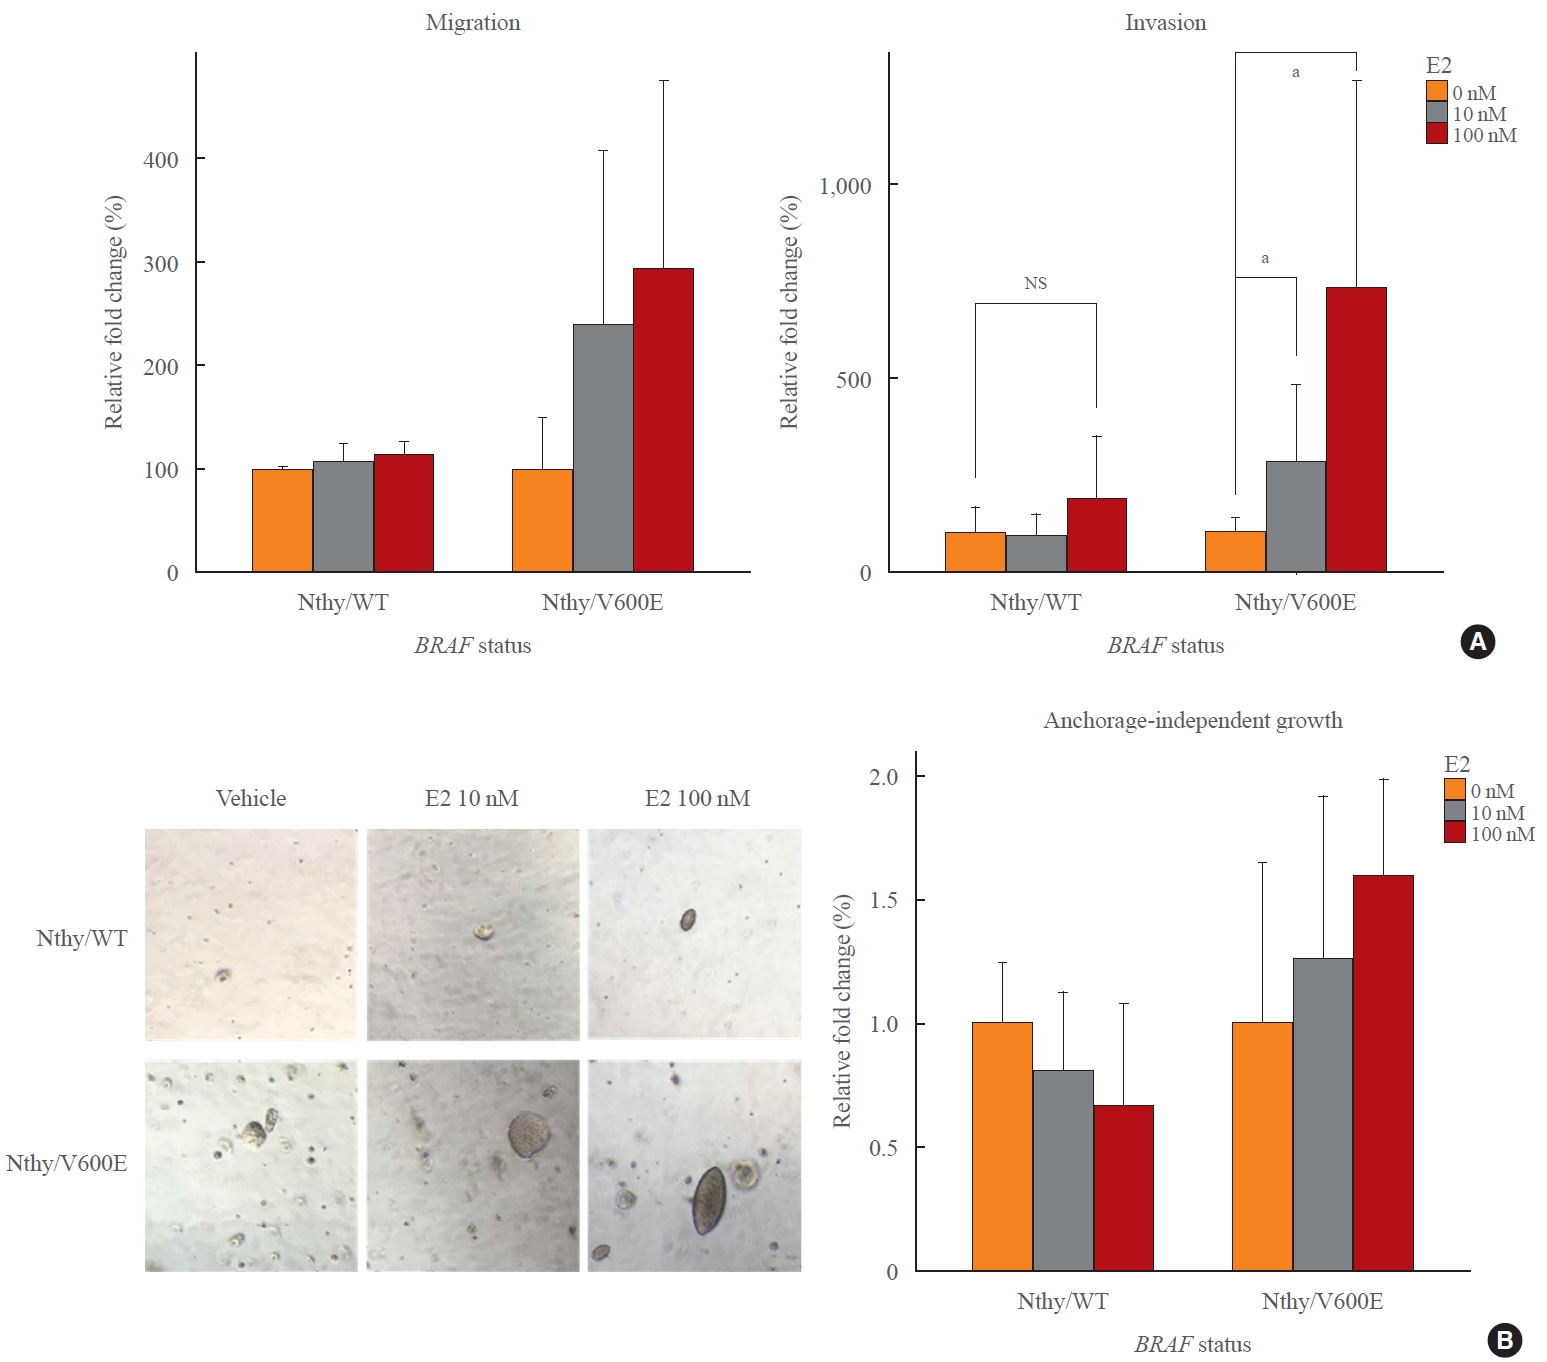
Enhanced increase of metastatic potentials of thyroid cell lines by BRAFV600E. (A) Human thyroid cell lines which harbor wild type BRAF gene (Nthy/WT) did not show significant changes of migration and invasion by E2. However, BRAFV600E-positive cell lines, and Nthy/BRAFV600E (Nthy/V600E), showed over two times more increase of migration and significant increase of invasion in response to E2 treatment. (B) Anchorage-independent growth of thyroid cell lines was observed under microscopy and the total amount of cells was measured using fluorescent dye included in the soft-agar assay kit. While E2 slightly inhibited growth of Nthy/WT, it promoted colony formation and growth in BRAFV600E-positive cell lines in a dose-dependent manner. NS, not significant. aP<0.05.
BRAFV600E plays an important role in enhanced E2-induced anchorage-independent growth of thyroid cell lines
Anchorage-independent growth is considered to be a key phenotype of cancers [34]. In particular, anchorage-independent growth plays a critical role in the late stage of metastasis because this ability is closely associated with anoikis resistance and stemness of cancers [35]. E2 increases stem-like features and anchorage-independent growth of breast cancer cell lines and primary thyrocytes from nodular goiters [14,36]; therefore, we evaluated the role of E2 in the anchorage-independent growth of thyroid cell lines depending on their BRAFV600E status.
Nthy/WT formed only a few colonies and grew rarely, and E2 treatment slightly inhibited anchorage-independent growth (Fig. 2B). In contrast, E2 enhanced the growth of Nthy/V600E in soft-agar, forming more and larger colonies in a dose-dependent manner (Fig. 2B). These results corresponded to the changes in ERα and ERβ expression following E2 treatment, which showed an increased and decreased ERα/ERβ ratio in Nthy/V600E and in Nthy/WT, respectively. This suggests that BRAFV600E contributed to the enhancement of the tumor-promoting effects of E2 by modulating the expression of ERα and ERβ in response to E2 treatment.
BRAFV600E increases the susceptibility to an ERα-selective antagonist, but decreases the efficacy of an ERβ-selective agonist in human thyroid cell line
In order to confirm that the differential responsiveness BRAFV600E to E2 is mediated by the altered expression of ERα and ERβ, we tested the efficacy of ERα-selective antagonist “MPP” and ERβ-selective agonist “DPN” in reducing the migration ability via a wound healing assay. We cultured Nthy/WT and Nthy/V600E in complete media with phenol red and 10% FBS to ensure the proper functioning of both ERα antagonist and ERβ agonist. The representative pictures were selected based on the mean values in each condition.
As Nthy/WT showed relatively low ERα and high ERβ expression compared to Nthy/V600E in the presence of E2, DPN significantly inhibited the migration of Nthy/WT whereas MPP did not. Thus, ERβ agonist was more effective in Nthy/WT (Fig. 3). Unlike Nthy/WT, DPN did not significantly inhibit migration, whereas MPP significantly reduced migration in Nthy/V600E, which expresses higher ERα and lower ERβ concentrations in the presence of E2 (Fig. 3). As both cell lines were tested under identical conditions, it was clear that BRAFV600E rendered the ERα signaling pathway more dominant over ERβ in Nthy under E2-treated conditions, with a resultant E2-induced enhancement of cancer-promoting responses.
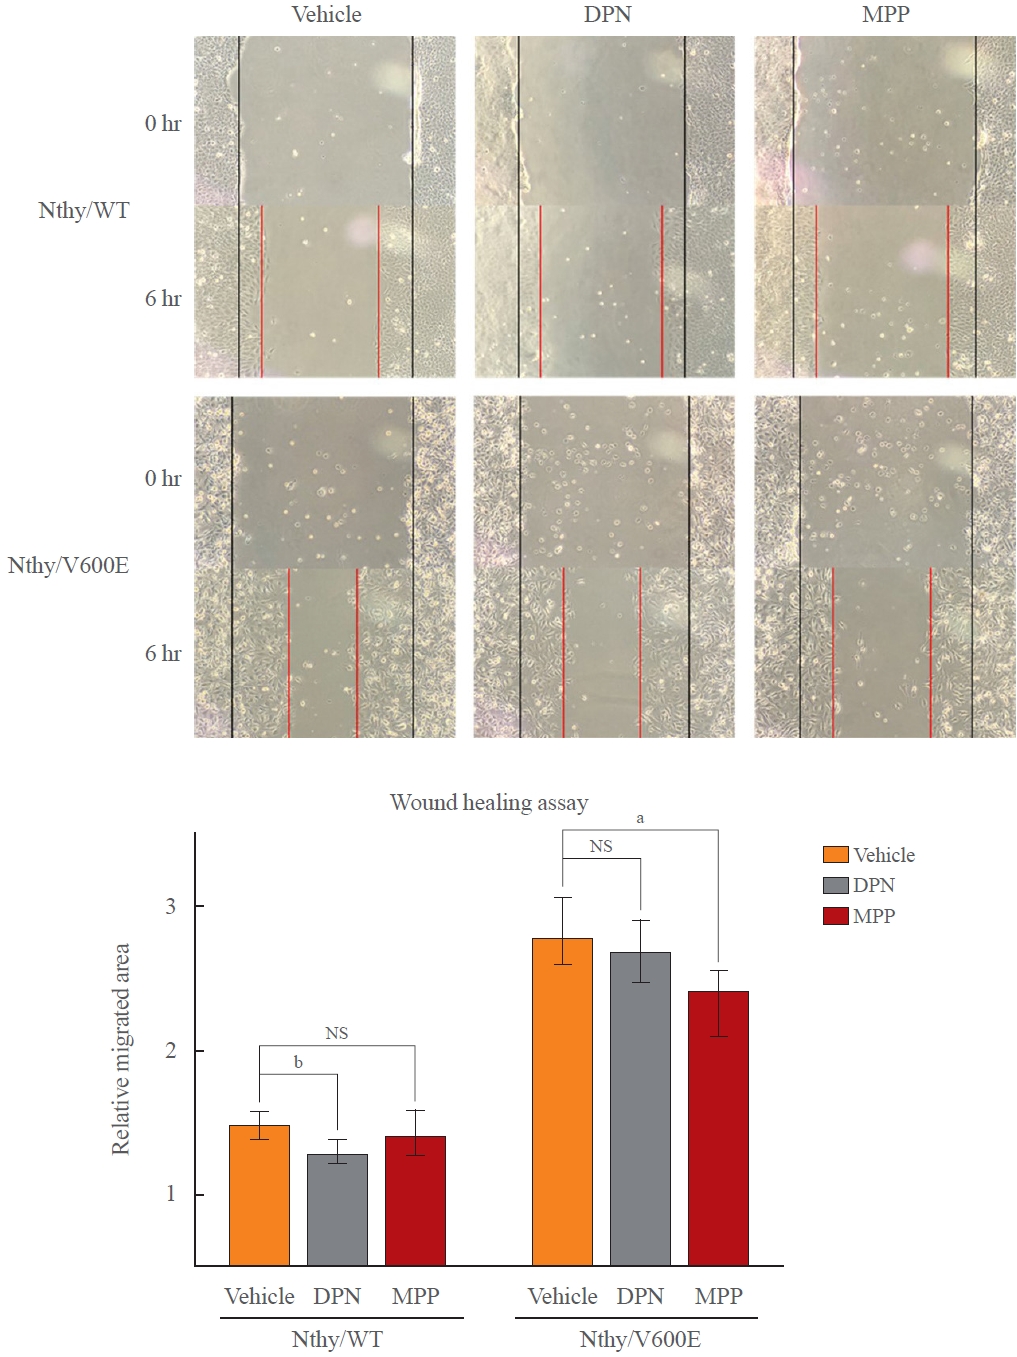
Altered anti-migratory effects of selective estrogen receptor α (ERα) antagonist and ERβ agonist. Wound healing assay was used to see if susceptibilities to diarylpropionitrile (DPN) and methylpiperidino pyrazole (MPP), which activate ERβ and block ERα, respectively. Both result in inhibition of cell migration. Under presence of endogenous estrogen and estrogenic phenol red, treatment of the reagents showed different efficacies depending on BRAFV600E status. As the ratio of ERα over ERβ decreased in human thyroid cell lines which harbor wild type BRAF gene (Nthy/WT) under presence of E2, DPN, ERβ-selective agonist was more effective that MPP in Nthy/WT while Nthy/BRAFV600E (Nthy/V600E) showed the opposite. NS, not significant. aP<0.05; bP<0.01.
Differential expression of ESR1 and ESR2 in female PTC patients depending on BRAFV600E status and age
In the TCGA data, the overall ESR1 expression is higher in BRAFV600E group than in BRAFWT group, and women who are younger than 51 years expresses higher ESR1 levels than those older than 50 years (Fig. 4A). Both BRAFV600E and age less than 51 years are associated with a higher ESR1 expression, although the effect of age is stronger in BRAFV600E group than in BRAFWT group (744.5 vs. 426.0, P=0.0129 in BRAFV600E; and 502.3 vs. 389.3, P=0.5057 in BRAFWT) (Fig. 4A). The overall ESR2 expression is lower in BRAFV600E group compared to BRAFWT group, but significant differences by age were not observed in both groups (8.902 vs. 8.049, P=0.2054 in BRAFV600E group; and 11.46 vs. 12.90, P=0.333 in BRAFWT group) (Fig. 4A). Nevertheless, the ESR ratio of the young group is significantly higher in BRAFV600E group, but not in BRAFWT group (127.6 vs. 68.58, P=0.0257 in BRAFV600E group; and 58.21 vs. 41.39, P=0.3214 in BRAFWT group) (Fig. 4A). In correlation analysis between ESR genes and BRS, BRAFWT group does not show strong correlations regardless of age groups although BRAFV600E-like signature is positively correlated with higher ESR1 and lower ESR2. However, a different correlation pattern is observed in BRAFV600E group. In the younger age group with BRAFV600E, BRAFV600E-like signature is positively correlated more strongly than in the BRAFWT groups (Fig. 4B). On the other hand, the older age group with BRAFV600E had the opposite pattern showing BRAFV600E-like signature is associated with lower ESR1 and higher ESR2 (Fig. 4B).

Relative estrogen receptor 1 (ESR1) and ESR2 expression depending on BRAFV600E status and menopause-related age group. (A) Papillary thyroid cancer (PTC) patients (363 females) were divided according to BRAFV600E status, and we compared expression of ESR genes between age groups because the level of estrogen is known to dramatically decrease around age 50. Whereas BRAFWT group does no show significant differences in both ESR1 and ESR2 genes between age groups, BRAFV600E group shows significantly higher ESR1 and ESR1/2 ratio in younger group (age under 51). (B) Correlation between ESR genes and BRAFV600E-RAS score (BRS) in each group by BRAFV600E and age. In the BRAFWT group, there are no clear differences between the age groups, but the BRAFV600E group shows different associations depending on age group. BRAFV600E-like gene signature (higher BRS) is correlated positively with ESR1 and ESR1/2 ratio and negatively with ESR2 expression in premenopausal age group (age <51, purple line) whereas it was opposite in post-menopausal age group with BRAFV600E (age ≥51, blue line). (C) Heatmap to show ESR genes and other prognosis-related gene signatures according to the level of BRAFV600E-RAS signature in thyroid cancer. TCGA, The Cancer Genome Atlas; RSEM, RNA-sequencing by expectation maximization; NS, not significant. aP<0.05; bP<0.01.
As BRAFV600E-like gene signature has been reported to be associated with poor differentiation (low TDS) and activated MAPK pathway signatures by TCGA group, high ESR1 and low ESR2 also showed correlation with the prognosis-related gene signatures including EMT-related genes and M2 macrophage signature (Fig. 4C, Supplemental Fig. S1). These results suggest that BRAFV600E might be associated with the regulation of ESR1 and ESR2 expression, which would be contributed by the higher level of estrogen in the group of younger women. Taken together, BRAFV600E might enhance the effect of estrogen on thyroid cancer cells by modifying the responsiveness.
DISCUSSION
In this study, we showed that BRAFV600E is closely associated with estrogen responsiveness in thyroid cancer. The expression of ESR1 and ESR2 did not significantly differ depending on age groups in the wild type group; however, female PTC patients harboring BRAFV600E showed significantly higher ESR1 and ESR1/ESR2 ratios in the group of patients who were younger than 51 years. Therefore, BRAFV600E is likely to be associated with estrogen-dependent regulation of ESR gene expression. Similarly, we found that BRAFV600E can modulate the estrogen responsiveness of the human thyroid cell line Nthy-ori 3-1. E2 treatment increased the ratio of ERα/ERβ in Nthy/V600E, whereas the opposite pattern was observed in Nthy/WT. Furthermore, Nthy/V600E showed enhanced E2-induced metastatic phenotypes, antitumor effects of ERα-selective antagonists, and resistance to ERβ-selective agonists. As BRAFV600E is used as a prognostic and therapeutic marker of thyroid cancer [37,38], this finding suggests the need for further development of combinatorial therapy based on BRAFV600E status and ERs.
Studies have reported that estrogen can promote metastatic phenotypes of thyroid cancer cell lines; however, it is not known whether BRAFV600E is involved in the tumor-promoting mechanisms of estrogen. In particular, the fact that BRAFV600E enhanced estrogen responsiveness in an E2-dependent manner might be an important point for further investigations in clinical application. Selective ER modulators, such as tamoxifen, are commonly used to treat ER-positive breast cancer patients. The therapeutic potential of tamoxifen in thyroid cancer in vitro and in vivo has been reported by Weber et al. [39] and Hoelting et al. [40] in 1990 and 1996, respectively; however, subsequent studies have only reported that tamoxifen can increase the level of thyroid-stimulating hormone and thyroid proliferation without any additional study on its anticancer effects [39-42]. As anti-estrogen therapy for thyroid cancer has not been approved yet, the finding that the efficacy of ERα-selective antagonists and ERβ-selective agonists on the migratory potential of thyroid cell lines varied depending on BRAFV600E status is an encouraging result. The results from our study suggest that therapeutic approaches based on the estrogen pathway might need to be considered based on BRAFV600E status for better treatment efficacy.
Furthermore, Yi et al. [18] previously reported that BRAFV600E is significantly associated with higher ESR1 and ESR1/2 ratio in PTC patients, and this study is the first to investigate how BRAFV600E affects the expression of ERs and responsiveness to estrogen in thyroid cancer. A pair of cell lines, Nthy/WT and Nthy/V600E, was developed to establish a model to study the roles of BRAFV600E in human thyroid epithelial cells and was characterized in vitro and in vivo [28,29]. The two cell lines harbor almost identical genomic backgrounds, except for BRAFV600E, and they were suitable for demonstrating the role of BRAFV600E in the estrogen responsiveness of thyroid cells. The two cell lines used in this study express both ERα and ERβ at the gene and protein levels and do not harbor other genomic alterations that activate MAPK pathways except for the BRAFV600E mutation. These characteristics allowed us to investigate the association between BRAFV600E and the estrogen pathway in thyroid cancer in vitro.
To ascertain the role of BRAFV600E in estrogen responsiveness of thyroid cancer, we analyzed the RNA-sequencing data of patient samples from the TCGA as well as in in vitro experiments. Similar to the results of in vitro experiments, BRAFV600E affected the expression of ESR1 and ESR2, and resulted in a higher ESR ratio in the young female group with BRAFV600E (Fig. 4).
The gene signature analysis revealed some interesting points. First, ESR genes are closely associated with differentiation status (Supplemental Fig. S1A). The TCGA group has reported that low TDS is correlated with BRAFV600E mutation and a higher BRS [33]. The BRAFWT group showed a negative correlation of ESR1 and ESR1/2 ratio with TDS, whereas the BRAFV600E group showed a positive correlation with ESR2 (Supplemental Fig. S1). Furthermore, the BRAFV600E-like gene signature, which is a highly expressed gene signature in BRAFV600E-mutated thyroid cancers compared to RAS-mutated ones, was significantly associated with lower ESR2 expression and higher ESR1/2 ratio (Supplemental Fig. S1).
This study has some limitations that need to be addressed in further investigations. First, we could not show a direct correlation between the expression of ESR1 and ESR2 and either the estrogen level or menopausal status due to the lack of relevant data in TCGA. Ethnic and epidemiological background can affect menopausal status and the estrogen level in each group that was classified based on the average age of menopause (50 years), and statistical analysis might not fully represent the results based on their medical records. In addition, the limited number of cell lines may not be sufficient to cover the diverse genomic backgrounds of thyroid cancer patients. Nthy is derived from normal human thyrocytes; however, the cell line was immortalized using SV40 transfection, which inhibits p53 and pRb and develops dedifferentiated thyroid carcinoma in vivo by BRAFV600E transduction [29,43,44]. It means that the model used in this study might not adequately represent PTC harboring either BRAFWT or BRAFV600E. Further studies using various cell lines with or without BRAFV600E would be required to solidify our findings in the interplay between estrogen pathways and BRAFV600E. Nonetheless, we found a rational concordance between the results from statistical analysis using the dataset of female PTC patients and the set of cell lines expressing either BRAFWT or BRAFV600E regarding the role of BRAFV600E in the estrogen pathway of thyroid cancer.
In conclusion, our data suggest that BRAFV600E is closely associated with estrogen responsiveness in thyroid cancer through modulation of the expression of ERs. We could not uncover the molecular mechanism, although BRAFV600E contributed to the higher ratio of ERα/ERβ in human thyroid cell lines in the presence of estrogen, resulting in enhanced metastatic potential by estrogen. In addition, a higher ESR1/ESR2 ratio was significantly associated with the young age group only in BRAFV600E-positive female patients. Therefore, we expect that these findings will facilitate the development of novel therapeutic approaches for the management and treatment of thyroid cancer patients.
Supplementary Material
Supplemental Fig. S1.
A scatter plot between estrogen receptor (ESR) genes and thyroid cancer-related gene signatures. Associations of (A) thyroid differentiation score (TDS), (B) BRAFV600E-Ras score (BRS), and (C) M2 macrophage score with ESR1, ESR2, and ESR1/2 ratio were displayed with BRAFV600E status and approximate age. NA, not applicable.
Notes
CONFLICTS OF INTEREST
No potential conflict of interest relevant to this article was reported.
AUTHOR CONTRIBUTIONS
Conception or design: M.K., S.K. Acquisition, analysis, or interpretation of data: M.K., S.Y.H., Z.X., Y.H., H.G.J. Drafting the work or revising: M.K., S.K., S.W.C., Y.J.P., K.E.L. Final approval of the manuscript: M.K., S.K., S.Y.H., Z.X., Y.H., H.G.J., S.W.C., Y.J.P., K.E.L.
Acknowledgements
This study was funded by the the National Research Foundation of Korea (NRF) grant funded by the Korea government (MSIP) (Grant number: 2018R1C1B5045216), and the Seoul National University Hospital (SNUH) Research Fund (Grant No. 03- 2017-0190). We also acknowledge the support of the American Thyroid Association (ATA) and the Korean Cancer Association in the form of and 2018 ATA Trainee Grant and Merit Award, respectively.