Radioactive Parathyroid Adenomas on Sestamibi Scans: Low Parathyroid Hormone Secretory Potential and Large Volume
Article information

Abstract
Background
We investigated the clinical characteristics of parathyroid adenomas according to radioactivity on 99mTc-methoxyisobutylisonitrile (99mTc-MIBI) single-photon emission computed tomography/computed tomography (SPECT/CT) in primary hyperparathyroidism (PHPT) patients.
Methods
The study included 217 patients diagnosed with PHPT from 2000 to 2019 at Seoul National University Hospital who underwent 99mTc-MIBI SPECT/CT scans. On SPECT/CT, the radioactivity of parathyroid adenomas was measured as the ratio of the mean radioactivity count of the parathyroid adenoma to that of the contralateral thyroid.
Results
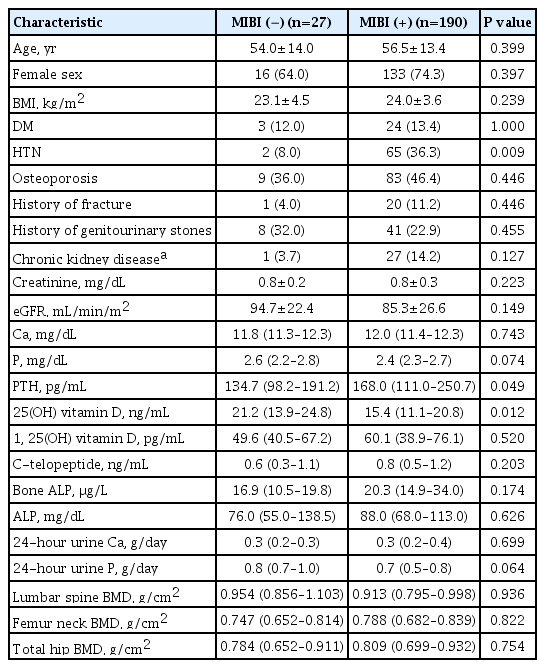
Tumors were localized by MIBI scans in 190 patients (MIBI [+] group) and by ultrasound or parathyroid four-dimensional CT in 27 patients (MIBI [−] group). The mean age was 55 years, and mean body mass index was 23.4 kg/m2. Patients in the MIBI (+) group had higher parathyroid hormone (iPTH) and lower 25-hydroxy vitamin D levels than those in the MIBI (−) group (168.0 pg/mL [interquartile range, IQR, 111.0 to 250.7] vs. 134.7 pg/mL [IQR, 98.2 to 191.2], P=0.049; 15.4 ng/mL [IQR, 11.1 to 20.8] vs. 21.2 ng/mL [IQR, 13.9 to 24.8], P=0.012, respectively). Patients in the MIBI (+) group had larger tumor volumes, but lower iPTH/volume ratios than those in the MIBI (−) group (1,216.66 [IQR, 513.40 to 2,663.02], 499.82 mm3 [IQR, 167.77 to 1,229.80], P=0.002; 0.18 [IQR, 0.08 to 0.46], 0.40 pg/mL/mm3 [IQR, 0.16 to 1.29], P=0.016, respectively). Adenoma radioactivity was positively correlated with calcium, iPTH, and volume (r=0.180, P=0.020; r=0.208, P=0.006; r=0.288, P<0.001, respectively), but not with iPTH/volume.
Conclusion
Parathyroid adenomas with positive MIBI scans had larger volumes and higher iPTH than adenomas with negative scans, but lower iPTH per unit volume.
INTRODUCTION
Primary hyperparathyroidism (PHPT), which results from a parathyroid adenoma in approximately 85% to 90% of patients, is the most common endocrinological cause of hypercalcemia [1]. Over the past few decades, the pattern of disease manifestation has changed from symptomatic disease to disease found incidentally by routine screening tests in asymptomatic patients [2]. To date, as the only curative therapy, surgery is often recommended for asymptomatic patients since the underlying risk of adverse events such as fractures or nephrocalcinosis can be prevented with effective surgery [3]. Therefore, accurate preoperative localization is vital for achieving a favorable treatment outcome. For localization, a commonly used functional imaging method is technetium-99-methoxyisobutylisonitrile (99mTc-MIBI) single-photon emission computed tomography/computed tomography (SPECT/CT).
The 99mTc-MIBI scan is a dual-phase scan that has been recently used with a hybrid imaging modality of SPECT/CT to improve localization accuracy [4,5]. Since 99mTc-MIBI binds to mitochondria depending on the membrane potential, the key mechanism of this imaging modality lies in the mitochondrial activity and metabolic state of the cell [6,7]. Based on this mechanism, some studies have reported correlations between 99mTc-MIBI uptake and functional markers such as parathyroid hormone (PTH) and calcium levels [7–9], while others have reported discordant results [10,11]. Furthermore, some authors reported an association between 99mTc-MIBI uptake and tumor size [7,12], although other authors reported that large adenomas were missed when using the 99mTc-MIBI/99mTc-pertechnetate subtraction technique [13]. These findings imply that other factors or the combined effects of tumor size and functionality may affect the ability of imaging to detect these tumors.
In clinical practice, physicians often encounter parathyroid adenomas that have high functionality or large size, but are not localized on 99mTc-MIBI scintigraphy, leading to the question of the major determinants of 99mTc-MIBI uptake. Based on the mechanisms of 99mTc-MIBI uptake, we postulated that 99mTc-MIBI uptake may be correlated with the functional intensity of disease, such as PTH secretion per unit volume of the adenoma. Although some studies have investigated the total activity of these tumors [7–9], studies have rarely focused on the functional intensity of the disease at the cell level.
Therefore, we aimed to evaluate the clinical characteristics of parathyroid adenomas in terms of their hormone-secreting intensity according to radioactivity on 99mTc MIBI scans in patients with PHPT.
METHODS
Study design and participants
The records of 392 patients diagnosed with PHPT from March 2000 to February 2019 at Seoul National University Hospital were analyzed. Among them, 72 patients without a MIBI SPECT/CT scan were excluded. Forty-nine patients without either a parathyroid 4-dimensional CT scan or ultrasound were excluded. After excluding 54 patients in whom tumors were not localized by the modalities mentioned above, the final analysis included 217 patients with localized parathyroid adenoma who underwent surgery. Among them, 190 patients had tumors localized by MIBI SPECT/CT and 27 patients did not; these patients were categorized as the MIBI (+) and (−) groups, respectively. Patients in the MIBI (−) group had tumors localized by other modalities such as CT or ultrasonography. The Institutional Review Board of Seoul National University Hospital approved the study (IRB No. 1306-101-499), and the requirement for informed consent was waived due to the retrospective study design.
Assessment of anthropometric and biochemical parameters
Standing height and weight were measured without shoes and in light clothing. Body mass index (BMI) was calculated as weight/height (kg/m2). Patients’ previous history of diabetes, hypertension (HTN), fractures, osteoporosis, and urinary stones was analyzed based on electronic health records. Fasting blood samples were collected in the morning. Serum calcium, phosphorus, and creatinine levels were measured with an autoanalyzer (TBA-200 FR NEO, Toshiba, Tokyo, Japan). Plasma 25-hydroxyvitamin (25(OH)) vitamin D and 1,25-hydroxy vitamin D levels were measured by radioimmunoassay (DiaSorin Inc., Stillwater, MN, USA), with an interassay coefficient of variation (CV) of 11.1% and an intraassay CV of 8.8%. Serum intact parathyroid hormone (iPTH) was measured using an electrochemiluminescence immunoassay using the Cobas e411 analyzer (Roche Diagnostics, Mannheim, Germany). The estimated glomerular filtration rate (eGFR) was calculated using the Modification of Diet in Renal Disease formula. The concentration of C-terminal telopeptide of type 1 collagen (CTX) was determined using a chemiluminescent immunoassay (Roche Diagnostics). Bone-specific alkaline phosphatase (ALP) was measured using an electrochemiluminescence immunoassay with a DXI-800 analyzer (Beckman Coulter Inc., Fullerton, CA, USA). Volumes were calculated based on pathology reports using the formula of Π/6×R1×R2×R3 (where R1, R2, and R3 are the lengths of the x, y, and z-axes of the parathyroid adenoma [mm], respectively), assuming an ellipsoid shape.
Bone mineral density assessment
The bone mineral density (BMD; g/cm2) of the lumbar spine (LS), femoral neck (FN), and total hip (TH) were measured using dual-energy X-ray absorptiometry (Lunar Prodigy, GE Healthcare, Madison, WI, USA) and analyzed with Encore Software version 11.0 (GE Healthcare). The average CVs were 1.22%, 1.97%, and 1.30% for the LS BMD, FN BMD, and TH BMD, respectively. For the LS BMD, the L1–4 value was chosen for analysis, but when a compression fracture or severe sclerotic changes were present, the affected vertebrae were omitted from the analysis (e.g., L2–4 were included in the analysis if there was a compression fracture at L1).
Assessment of the radioactivity of parathyroid adenomas
Dual-phase parathyroid planar scans of the neck area were taken in early (15 minutes) and late (150 minutes) phases after an intravenous injection of 99mTc-MIBI (555 MBq). Images were obtained using a hybrid SPECT/CT scanner with low-energy high-resolution collimators (Discovery NM/CT 670, GE Healthcare, Milwaukee, WI, USA) using the count-setting mode (700 kcounts) in 256×256 matrices. The energy window was 20% open with the photopeak centered at 140 keV. MIBI SPECT/CT was done immediately after a delayed phase of a planar scan with the same scanner. SPECT images were acquired by a step-and-shoot protocol (60 steps with 3° intervals and a 20-second acquisition per step). The images from SPECT were reconstructed on 128×128 matrices using a Butterworth postprocessing filter (cutoff 0.48) and an iterative algorithm (two iterations and 10 subsets, ordered-subset expectation-maximization algorithm). A helical CT scan was performed with attenuation correction and no contrast enhancement (60 to 100 mA, 120 kVp). The images from the CT scan were reconstructed into 3.75-mm slices with 512×512 matrices.
Images were reviewed and analyzed by consensus between two physicians. From the SPECT/CT images, a region of interest (ROI) was manually drawn for the uptake lesion of the parathyroid adenoma using an image analysis tool (Infinitt viewer, Infinitt, Seoul, Korea). Another ROI of the same size and shape was reproduced in the contralateral thyroid area as a background. If there was no definite uptake in the parathyroid area, ROIs were drawn in the area based on pathology reports and other imaging modalities. From the ROIs, the parathyroid adenoma-to-thyroid (P/T) uptake ratio was calculated as the ratio between the mean counts of the ROIs of the parathyroid adenoma and the contralateral thyroid gland [14]. The P/T uptake ratio is expressed as the radioactivity of the parathyroid adenoma throughout the manuscript.
Statistical analysis
Normally distributed data are presented as the mean±standard deviation, non-normally distributed data are reported as the median (interquartile range [IQR]), and categorical data are reported as number (%). The characteristics of patients in both groups were compared using the Student’s t test or the Mann-Whitney U test for continuous variables and the chi-square test for categorical variables. For the correlation analysis, Pearson correlation analyses were done. Differences were considered statistically significant at P values of <0.05. All analyses were performed using Stata version 13.0 (StataCorp, College Station, TX, USA) and R version 3.4.3 (R Foundation for Statistical Computing, Vienna, Austria), and graphs were generated using GraphPad Prism version 5.0 (GraphPad Software, San Diego, CA, USA).
RESULTS
Baseline characteristics
In 190 patients, the tumor was localized by the MIBI scan (MIBI [+] group), while in 27 patients, the tumor was instead localized by ultrasonography or parathyroid four-dimensional (4D)-CT (MIBI [−] group). The mean age of all patients was 55 years, and the mean BMI was 23.4 kg/m2. Patients in the MIBI (+) group were more likely to have HTN than those in the MIBI (−) group. Patients in both groups were similar in terms of age, sex, and their history of diabetes mellitus, osteoporosis, previous fractures, and genitourinary stones. They also had similar levels of creatinine and eGFR (Table 1).
Baseline Characteristics in Primary Hyperparathyroidism Patients According to the Results of MIBI Scan
Clinical characteristics of patients in the MIBI (+) and (−) groups
In respect to parathyroid-related characteristics, patients in the MIBI (+) group had higher iPTH and lower 25(OH) vitamin D levels than those in the MIBI (−) group (iPTH, 168.0 pg/mL [IQR, 111.0 to 250.7] vs. 134.7 pg/mL [IQR, 98.2 to 191.2], P= 0.049; 25(OH) vitamin D, 15.4 ng/mL [IQR, 11.1 to 20.8] vs. 21.2 ng/mL [IQR, 13.9 to 4.8], P=0.012, respectively) (Table 1). Serum and urine levels of calcium, phosphorus, and bone turnover markers (such as CTX and bone ALP) were similar. BMDs of the LS, FN, and TH were similar between groups.
The tumor volume was significantly larger in patients in the MIBI (+) group than in those in the MIBI (−) group (1,216.66 mm3 [IQR, 513.40 to 2,663.02] vs. 499.82 mm3 [IQR, 167.77 to 1,229.80], P=0.002, respectively) (Fig. 1A). The iPTH/volume ratio (pg/mL/mm3) was significantly lower in patients in the MIBI (+) group than in those in the MIBI (−) group (0.18 pg/mL/mm3 [IQR, 0.08 to 0.46], 0.40 pg/mL/mm3 [IQR, 0.16 to 1.29], P=0.016, respectively) (Fig. 1B). The radioactivity of parathyroid adenomas was higher in patients in the MIBI (+) group than in those in the MIBI (−) group (1.32 [IQR, 1.12 to 1.55], 1.00 [IQR, 0.85 to 0.13], P<0.001, respectively) (Fig. 1C).
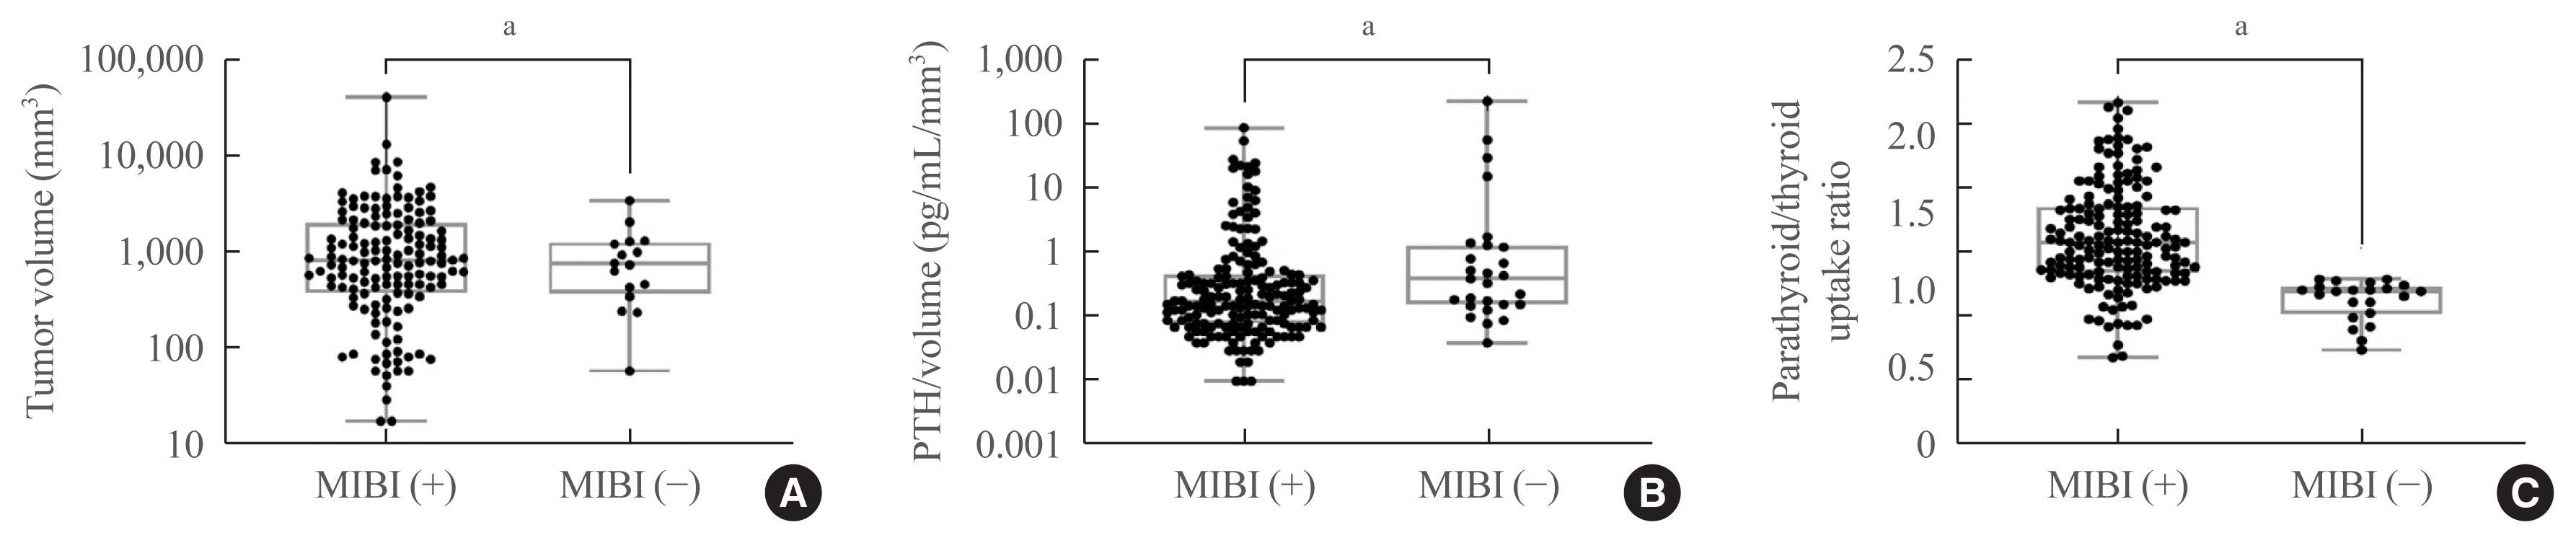
(A) Tumor volume, (B) parathyroid hormone (PTH)/volume, and (C) radioactivity of parathyroid adenomas according to methoxyisobutylisonitrile (MIBI) scan uptake. Radioactivity of parathyroid adenomas refers to the parathyroid/thyroid uptake ratio.
Association of the radioactivity of parathyroid adenomas with clinical parameters
As shown in Table 2, the radioactivity was positively correlated with calcium and iPTH levels (r=0.180, P=0.020 for calcium; r=0.208, P=0.006 for iPTH) (Fig. 2A, B). Although radioactivity was positively associated with the volume of the adenomas (r=0.288, P<0.001) (Fig. 2C), it was not correlated with iPTH/volume, as an indicator of the secretory potential of the parathyroid adenoma (r=0.041, P=0.609) (Fig. 2D). Tumor volume also showed significant correlations with various clinical parameters, such as serum calcium, phosphorus, and iPTH levels (Table 2).
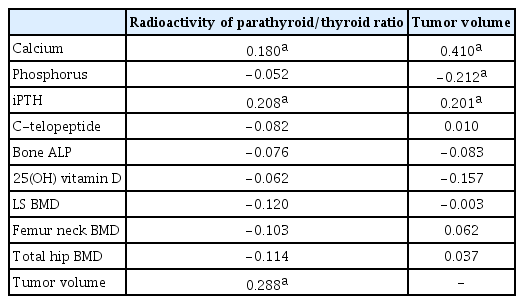
Correlation of Volumes and Radioactivity of Tumor with Clinical Parameters

Correlations between the radioactivity of parathyroid adenomas and (A) calcium and (B) parathyroid hormone (PTH) levels, (C) volume of adenomas, and (D) the PTH/volume ratio. Radioactivity of parathyroid adenomas refers to the parathyroid/thyroid uptake ratio. ln, natural logarithm.
DISCUSSION
The main finding of the study is that the radioactivity of parathyroid adenomas on MIBI scans was positively correlated with tumor volume and serum iPTH, but not with the iPTH per unit volume of the adenoma. Patients with positive MIBI scans had higher iPTH levels and larger adenoma volumes than those with negative scans. Patients with positive and negative MIBI scans were similar in terms of age, sex, renal function, and history of underlying diseases such as diabetes mellitus, osteoporosis, fracture, and genitourinary stones. Moreover, no significant differences were found in urinary calcium and phosphorus excretion, bone turnover markers, and BMD between groups.
In this study, patients with positive MIBI scans had higher iPTH levels than those with negative scans, and the degree of radioactivity was positively correlated with serum calcium and iPTH levels. From a mechanistic standpoint, the intensity of 99mTc-MIBI uptake is expected to be associated with parathyroid adenoma functionality since 99mTc-MIBI binds to mitochondria according to the membrane potential [6,7]. In previous studies, serum iPTH levels were significantly higher in patients with 99mTc-MIBI (+) adenomas [15], and 99mTc-MIBI uptake was positively correlated with serum iPTH and calcium levels [7]. Furthermore, Biertho et al. [9] reported that 99mTc-MIBI uptake was associated with iPTH levels. Similar to our results, this finding indicates that the degree of uptake on a parathyroid scan can be used as a functional indicator of parathyroid adenoma. However, PTH levels may have been higher in the MIBI (+) group since the MIBI (+) group had lower 25(OH) vitamin D levels than the MIBI (−) group in this study.
Adenoma volume was positively associated with 99mTc-MIBI radioactivity in this study. Adenomas missed by the scan had smaller volumes than those that were detected. Consistent with our results, several studies have reported an association between the size of adenomas and their detectability by 99mTc-MIBI scans. Some reported that adenomas detected by MIBI scans were significantly larger than those that were not [12,16]. However, a few other reports did not find an association between tumor size and the radioactivity, including a study that showed a minimal correlation between 99mTc-MIBI uptake and the adenomas’ volume, most likely because the findings were interpreted qualitatively [10]. Overall, considering that the volume of an adenoma is proportional to iPTH and calcium levels, the degree of 99mTc-MIBI uptake may represent the metabolic activity of PHPT.
Along with previous results, in clinical practice, parathyroid adenomas detected by MIBI scans are usually large and metabolically active, with high calcium and iPTH levels. Of interest is the finding that the iPTH/volume ratio was not correlated with the degree of 99mTc-MIBI uptake, and that this ratio was lower in patients with MIBI (+) scans than in those with MIBI (−) scans. Since it has been reported that the iPTH per unit weight of the adenoma was significantly lower in larger adenomas [17], it can be inferred that the difference in the iPTH/volume ratio between patients in the MIBI (+) and (−) groups was mainly driven by the fact that patients in the MIBI (+) group had a significantly larger tumor volume than those in the (−) group, instead of the difference in 99mTc-MIBI uptake. This interpretation is supported by the findings of an in vitro study that cells from heavier glands released iPTH at a lower rate than cells from small adenomas [18]. It could be clinically meaningful that the PTH secretory potential of a tumor may not positively indicate MIBI scan sensitivity [17,18]. Although MIBI scan is a functional imaging modality, adenoma volume may be the main factor affecting the scan’s sensitivity. Furthermore, larger adenomas may have a greater portion of cystic spaces or hemorrhage within the gland, and the rate of secretion may vary from cell to cell [17]. Therefore, weight can also be an indicator like volume, especially in tumors with hemorrhagic or cystic portions [19,20]. These factors may explain the insignificant correlation between iPTH/volume and the degree of 99mTc-MIBI uptake. Although an analysis according to weight could not be done due to the lack of data, further studies with a large number of patients with unlocalized 99mTc-MIBI scans will be needed.
As a diagnostic tool for parathyroid adenoma, 99mTc-MIBI scans were useful in detecting parathyroid lesions. The sensitivity of 99mTc-MIBI scans in the study was 84%, similar to previous meta-analyses that reported the sensitivity as 88% [21]. Since SPECT/CT is a fusion imaging modality that combines SPECT and CT, it shows better performance in parathyroid adenoma localization than simple scintigraphy [5]. Several studies have reported that the sensitivity of MIBI SPECT/CT ranged from 80% to 99% [5,21,22]. In this study, 73% of tumors that could not be localized by SPECT/CT were localized by ultrasonography or parathyroid 4D-CT. This finding is similar to that of a previous report, according to which the sensitivity of additional 4D-CT was 72% in patients with negative or inconclusive SPECT/CT [23]. For example, thyroid disease could cause false-negative results on a SPECT/CT scan. In the current study, patients with diffuse thyroiditis or multiple thyroid nodules had negative scans with radioactivity of the parathyroid/thyroid <1, which might have been due to thyroid parenchymal uptake [24]. Therefore, additional ultrasound and 4D-CT imaging could be helpful in patients with negative SPECT/CT results [25].
The study has several strengths. First, this is the first study to compare secretory potential according to the radioactivity of parathyroid adenomas. Although previous studies have investigate associations of tumor volume and iPTH levels with the radioactivity of adenomas, the attenuated trend of iPTH per unit volume has not previously been evaluated. Second, it presents a quantitative analysis of the radioactivity of parathyroid adenomas. Although several qualitative studies have graded radioactivity, only a few studies have presented quantitative analyses. Therefore, it is noteworthy that this study found that the radioactivity of parathyroid adenomas, upon quantitative analysis, was positively correlated with the expected parameters such as iPTH and tumor volume, but not with the iPTH per unit volume, which is a parameter that may represent the PTH secretory ability of an adenoma.
The present study also has some limitations. The number of patients in the MIBI (−) group might have been relatively insufficient for the comparison of major clinical characteristics such as BMD, calcium levels, or phosphorus levels between groups. Additionally, due to the retrospective design of the study, it was not possible to analyze certain factors that could have affected the results, but could not be obtained from electronic medical records, such as the age of menopause, smoking, or drinking. Another limitation is that a single PTH measurement may not adequately reflect the tumor’s secretory potential. A previous study reported PTH diurnal variability of 0.22 ng/mL in PHPT [26] and seasonal variation due to vitamin D status changes [27]. Although we did not have sufficient data to analyze seasonal or diurnal variation in our patients, future studies using the median values of multiple measurements at different diurnal points and 1- to 3-month intervals may more directly reflect secretory potential of parathyroid adenomas [26–28]. Moreover, the volume of the tumor without hemorrhagic or cystic portions could not be calculated because of the lack of exact proportions in the pathology reports.
In conclusion, parathyroid adenomas with positive MIBI scans had larger volumes and higher iPTH levels than those with negative MIBI scans, but had lower iPTH levels per unit volume of the adenoma. In clinical practice, it should be noted that the radioactivity of an adenoma may reflect its size and functionality, but not its PTH secretory potential. Further studies with a larger number of participants would be needed to improve our understanding of the radioactivity of parathyroid adenomas.
Acknowledgements
The study was funded by Seoul National University Hospital (Research No. 2520140120).
Notes
CONFLICTS OF INTEREST
No potential conflict of interest relevant to this article was reported.
AUTHOR CONTRIBUTIONS
Conception or design: S.H.K., J.H.K., C.S.S. Acquisition, analysis, or interpretation of data: S.H.K., J.H.K. Drafting the work or revising: S.H.K., J.H.K., S.W.K., C.S.S. Final approval of the manuscript: S.H.K., J.H.K., S.W.K., C.S.S.