Relationship of Sarcopenia with Microcirculation Measured by Skin Perfusion Pressure in Patients with Type 2 Diabetes
Article information

Abstract
Background
Few studies have examined the relationship of sarcopenia with the microcirculation. The current study investigated the relationship of sarcopenia with microcirculatory function, as assessed by skin perfusion pressure (SPP), in type 2 diabetes mellitus (T2DM) patients.
Methods
In total, 102 T2DM patients who underwent SPP measurements and bioelectrical impedance analysis (BIA) were enrolled in this cross-sectional study. SPP was assessed using the laser Doppler technique. Sarcopenia was defined as low height-adjusted appendicular muscle mass (men, <7 kg/m2; women, <5.7 kg/m2) using BIA. We divided the participants into two groups based on SPP (≤50 and >50 mm Hg), and an SPP below 50 mm Hg was considered to reflect impaired microcirculation.
Results
Fourteen patients (13.7%) were diagnosed with impaired microcirculatory function of the lower limb based on SPP. The prevalence of sarcopenia in all subjects was 11.8%, but the percentage of patients with an SPP ≤50 mm Hg who had sarcopenia was more than triple that of patients with an SPP >50 mm Hg (28.6% vs. 9.1%, P=0.036). A significant positive correlation was found between SPP and appendicular muscle mass adjusted for height (P=0.041 for right-sided SPP). Multiple logistic regression analysis showed that patients with sarcopenia had an odds ratio of 4.1 (95% confidence interval, 1.01 to 24.9) for having an SPP ≤50 mm Hg even after adjustment for confounding factors.
Conclusion
These results suggest that sarcopenia may be significantly associated with impaired microcirculation in patients with T2DM. Nonetheless, the small number of patients and wide CI require cautious interpretation of the results.
INTRODUCTION
Diabetes may affect the microcirculation throughout the body [1]. Chronic vascular complications of diabetes are related to the function of the microcirculation [2]. In addition, an association between dysfunction of the microcirculation and macrovascular disease has been suggested [3,4]. Evidence supports the possibility that microcirculatory dysfunction can eventually lead to more severe microvascular and macrovascular complications; therefore, it is necessary to detect dysfunction of the microcirculation promptly and to identify patients with diabetes at risk of microcirculatory dysfunction [5–7].
Previous studies have used the skin microvasculature as a model to estimate the microvascular complications of diabetes [8,9] and to investigate the relationship between cardiovascular (CV) risk and microcirculatory function [6,7]. Several studies have reported associations of microcirculatory changes in the retinal and renal systems with cardiovascular disease (CVD) events [5,10]. However, studies regarding the relationship of microcirculatory changes in the feet and CVD are limited.
Measuring skin perfusion pressure (SPP) using laser Doppler is a noninvasive, easily performed method that measures the microcirculatory pressure of the artery at the skin level [11]. The SPP is valuable for evaluating microcirculatory function. Most previous studies regarding SPP have focused on limb ischemia. Several studies have revealed that SPP measurements can be used to accurately diagnose peripheral artery disease (PAD) and diabetic foot disease (DFD) compared with other methods such as the ankle-brachial index (ABI). In addition, previous studies have investigated whether SPP can predict wound healing in critical limb ischemia (CLI) after reconstruction or medication, especially in patients with diabetes or end-stage renal disease on hemodialysis [12–14].
Previous studies have suggested that vascular lesions might be associated with sarcopenia. The reported prevalence of sarcopenia was as high as 15% in patients with type 2 diabetes mellitus (T2DM), reflecting a higher prevalence than was observed in controls [15]. Sarcopenia, which has been proposed to be a prognostic factor in diabetes, is associated with poor outcomes such as a higher hospitalization rate, CV events, and mortality in patients with T2DM [16,17]. Until now, only a few studies have shown that sarcopenia in T2DM patients was related with PAD, DFD, CLI, and mortality after leg amputation [18,19]. Moreover, studies regarding sarcopenia as a prognostic factor in patients with impaired microcirculation remain very limited.
If sarcopenia is associated with poor microcirculation, this information could help select a treatment plan, and interventions to modify sarcopenia may improve the prognosis of patients with impaired microcirculation. However, to the best of our knowledge, no study has yet evaluated the association of the microcirculation, as assessed by SPP, with sarcopenia in T2DM patients. Therefore, we aimed to investigate whether sarcopenia is associated with microcirculatory function in patients with T2DM.
METHODS
Study design and subjects
Among 187 participants with T2DM who underwent SPP measurements to evaluate complications of diabetes at the Endocrinology Division of Soonchunhyang University Bucheon Hospital from September 2018 to October 2018, those with a history of PAD or type 1 diabetes, who were older than 80 years of age, and who did not have bioelectrical impedance analysis (BIA) data were excluded. Finally, 102 participants were included for analysis in this cross-sectional study. We reviewed patients’ demographic, biochemical, and clinical data and treatment history in detail using their medical records. Subjects were classified by smoking status as non-smokers or current smokers. All participants were informed of the purpose of the study, and their consent was obtained. The study was approved by the Institutional Review Board of Soonchunhyang University School of Medicine, Bucheon Hospital (IRB number: 2019-08-021-001).
Anthropometric and biochemical measurements
The participants’ weight and height were measured to the nearest 0.1 kg and 0.1 cm. Body mass index (BMI) was calculated as body weight (kg) divided by height (m) squared. Blood samples were collected from all patients after overnight fasting. Glycated hemoglobin (HbA1c) was measured by ion-exchange high performance liquid chromatography (Bio-Rad, Hercules, CA, USA). The methodology was aligned with the Diabetes Control and Complications Trial and National Glycohemoglobin Standardization Program standards. A liquid enzymatic method was used to measure total cholesterol (TC), low-density lipoprotein cholesterol (LDL-C), and triglyceride (TG; 7600-110, Hitachi Inc., Tokyo, Japan) levels. The selective inhibition method was used to measure high-density lipoprotein cholesterol (HDL-C) levels. The estimated glomerular filtration rate (eGFR) was calculated by the Modification of Diet in Renal Disease study equation. Serum fasting insulin was measured using an immunoradiometric assay kit (DIAsource, Ottignies-Louvain-la-Neuve, Belgium). Insulin resistance was evaluated by the homeostasis model assessment of insulin resistance (HOMA-IR) index. The HOMA-IR was calculated by the following formula: [fasting insulin (μIU/mL)×fasting plasma glucose (mmol/L)]/22.5.
Arterial brachial-ankle pulse wave velocity (PWV) and the ABI were measured using an automated device (VP-1000, Colin, Komaki, Japan). Measurements of abdominal fat thickness were made using high-resolution B-mode ultrasonography. Visceral fat thickness (VFT) and subcutaneous fat thickness (SFT) were measured 1 cm above the umbilicus using a 12-MHz linear-array probe and a 3.5-MHz convex-array probe, respectively. VFT was defined as the distance between the anterior wall of the aorta and the posterior aspect of the rectus abdominis muscle perpendicular to the aorta. SFT was defined as the maximal thickness of the fat tissue layer between the skin-fat interface and the linea alba.
SPP measurements
SPP was measured with a laser Doppler probe using a SensiLase PAD-IQ (Vasamed, Eden Prairie, MN, USA) on both the dorsal and plantar sides. According to previously published SPP reference means, we considered that SPP values of less than 50 mm Hg indicated impaired microcirculation. An SPP of 50 mm Hg has been suggested as a cut-off value for PAD in patients with conditions such as diabetes mellitus (DM) and chronic kidney disease who have a high probability of calcification in lower leg arteries [14]. We analyzed the lower of the two SPP values obtained from the plantar and dorsal aspects of each foot as a marker of impaired microcirculation.
Body composition and definition of sarcopenia
We used BIA to assess sarcopenia. Appendicular skeletal muscle mass (ASM) was calculated by summing the lean mass in the arms and legs, which primarily represents skeletal muscle mass in the extremities. We defined sarcopenia, or low muscle mass, as ASM divided by height squared (ASM/Ht2; kg/m2). The ASM/Ht2 cut-off values for low muscle mass were 7 kg/m2 in men and 5.7 kg/m2 in women [20].
Statistical analysis
Data were reported as mean±standard deviation or median (interquartile range) for continuous variables and number (%) for categorical variables. The correlations of ASM/Ht2 with SPP and other clinical variables were assessed by Spearman rank correlation coefficients. The lower of the two SPP values measured at the dorsal and plantar surfaces of each foot was taken as the SPP.
Differences in demographic and clinical characteristics according to whether SPP was below 50 mm Hg on either side and sarcopenia were evaluated using the Student t-test and chi-square test for categorical variables. Odds ratios (ORs) were used as a measure of the association between the SPP and the presence of sarcopenia in multivariate logistic regression analysis. Multiple logistic regression analysis with the presence or absence of an SPP below 50 mm Hg as the dependent variable was performed.
A two-tailed P value less than 0.05 was considered to indicate statistical significance. All statistical analyses were performed using SPSS version 14.0 (SPSS Inc., Chicago, IL, USA).
RESULTS
Baseline clinical characteristics of study subjects
The general characteristics of the study participants are presented in Table 1. The mean age of the participants was 55.9 years, and their mean BMI was 26.0±3.1 kg/m2. Eighty (78.4%) were treated with statins and 53 (52%) were treated with antiplatelet agents. In total, 14 (13.7%) patients had either a dorsal or plantar SPP below 50 mm Hg on either side. The prevalence of sarcopenia in all subjects was 11.8%. Median age was used to create two age groups (<57 years vs. ≥57 years), and patients’ general characteristics were compared between these two groups (Supplemental Table S1). The younger group had a higher ASM/Ht2 and contained a greater percentage of men and current smokers. The prevalence of sarcopenia and right-side SPP below 50 mm Hg were significantly higher in the older group (19.2% vs. 4% and 19.2% vs. 6%, respectively). We also compared patients’ characteristics according to sex (Supplemental Table S2). Men were younger and had a shorter duration of DM, higher right dorsal SPP, higher TG levels, and higher ASM/Ht2 than women. The prevalence of sarcopenia was comparable in both sexes. However, the prevalence of right-side SPP below 50 mm Hg and any-side SPP below 50 mm Hg were significantly higher in women.
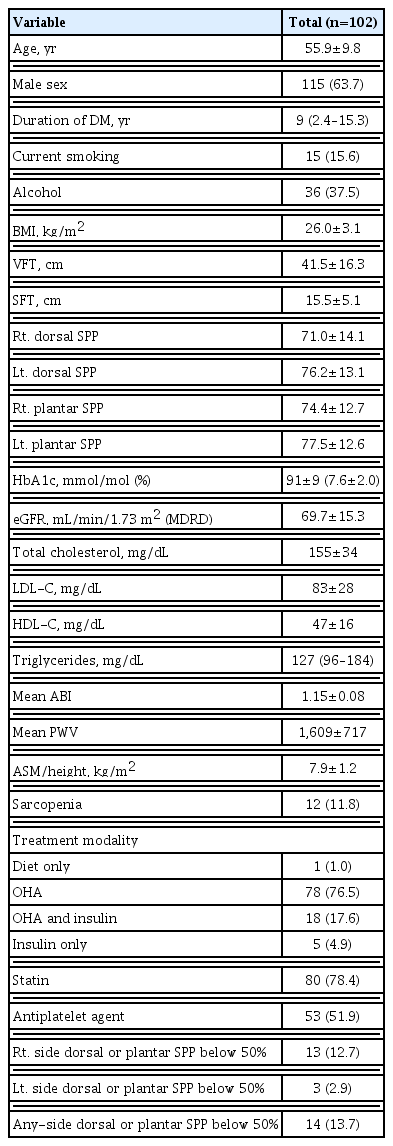
Clinical Characteristics and Laboratory Findings of the Study Population
Bivariate correlations of SPP and ASM/Ht2 with clinical variables
The correlations of SPP and ASM/Ht2 with clinical variables are shown in Table 2. The lower of the two SPP values measured at the dorsal and plantar surfaces of each foot was used as the SPP. Right-side SPP was positively correlated with ASM/Ht2 (r=0.198, P=0.041). Left-side SPP was positively correlated with TC and LDL-C levels (r=0.242, P=0.018 and r=0.241, P=0.043, respectively). Right-side SPP was positively correlated with left-side SPP (r=0.512, P<0.001). ASM/Ht2 was positively correlated with BMI (r=0.458, P<0.001) and negatively correlated with age (r=−0.359, P=0.001) and HDL-C (r=−0.304, P=0.005). ASM/Ht2 showed borderline significant correlations with VFT and SFT. However, SPP was not correlated with HbA1c, ABI, or PWV.
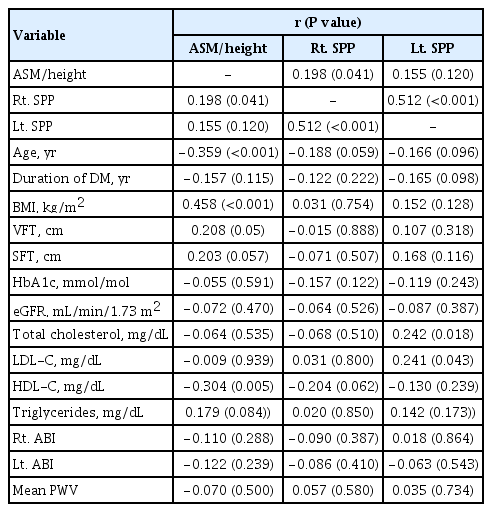
Correlations of Appendicular Skeletal Muscle/Height with SPP and Other Clinical Variables
When we analyzed dorsal and plantar SPP on each side separately, right dorsal SPP and right plantar SPP levels were positively correlated with ASM/Ht2 (r=0.279, P=0.008 and r=0.238, P= 0.016, respectively) and right dorsal SPP and left dorsal SPP were negatively correlated with age (r=−0.208, P=0.037 and r=−0.032, P=0.001, respectively) (data not shown).
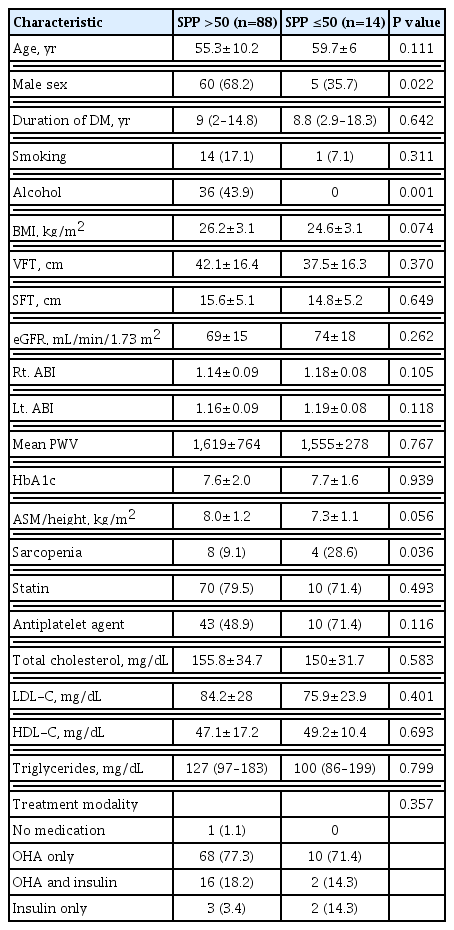
Comparisons of clinical characteristics according to the presence of low SPP
The clinical characteristics and laboratory findings according to the presence of SPP levels below 50 mm Hg on either side are presented in Table 3. Higher SPP was more prevalent in men than women (men, 68%; women, 32%). Patients with higher SPP were more likely to consume alcohol than those with lower SPP (P=0.001). The prevalence of sarcopenia was significantly higher in patients with lower SPP than in those with higher SPP (9% vs. 28.6%, P=0.036). The mean values of ASM/Ht2 were borderline significantly lower in patients with lower SPP than in those with higher SPP (7.3 vs. 8.0, P=0.056). There were no significant differences in age, duration of DM, BMI, fat thickness, HbA1c, lipid profiles, eGFR, ABI on each side, medication history (e.g., statins or anti-platelet agents), and treatment modality according to whether patients’ SPP was above or below 50 mm Hg.
Characteristics According to the Presence of Any-Side SPP below 50 mm Hg
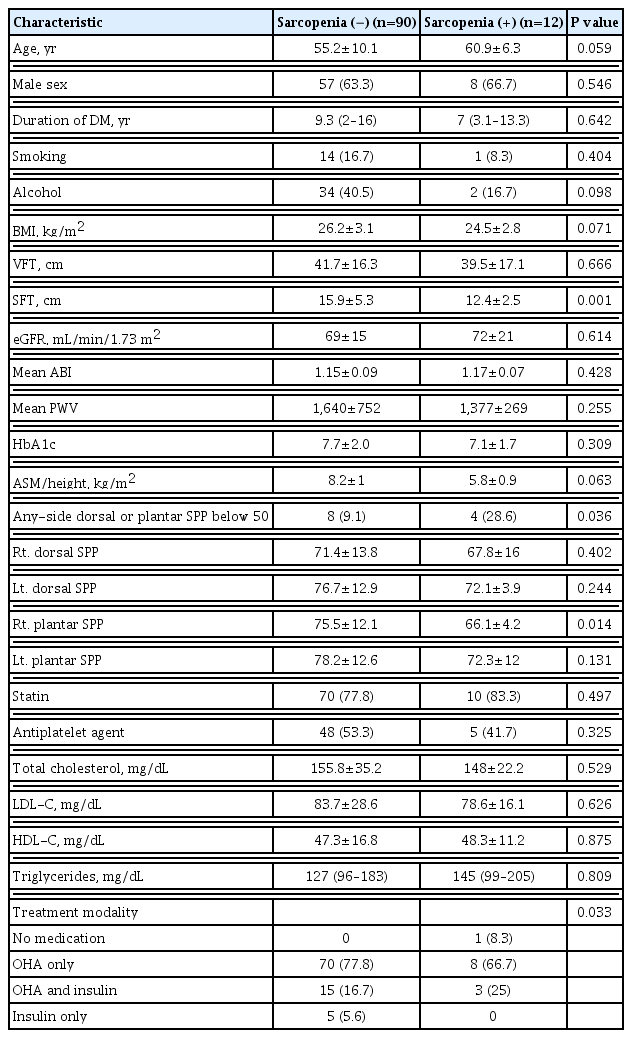
Comparisons of clinical characteristics according to the presence or absence of sarcopenia
Table 4 presents comparisons of clinical characteristics and laboratory findings according to the presence or absence of sarcopenia. The mean right plantar SPP was significantly lower in patients with sarcopenia than in those without sarcopenia (66.1 mm Hg vs. 75.5 mm Hg, P=0.014). The prevalence of an SPP below 50 mm Hg was significantly higher in patients with sarcopenia than in those without sarcopenia (28.6% vs. 9%, P=0.036). SFT was significantly higher in patients with sarcopenia. There were no significant differences in age, duration of DM, BMI, HbA1c, lipid profile, GFR, mean ABI, and taking statins and antiplatelet agents according to the presence of sarcopenia.
Characteristics according to the Presence of Sarcopenia
Multiple logistic regression analysis of the association of low SPP with the presence of sarcopenia
Multivariate logistic regression analysis was used to calculate ORs for SPP below 50 mm Hg as a function of sarcopenia (Table 5). Individuals with sarcopenia had an OR of 4.0 (95% confidence interval [CI], 1.02 to 15.7) for a low SPP (below 50 mm Hg) compared to those without sarcopenia. This significant association remained after adjusting for sex, age, smoking, duration of DM, HbA1c, statin treatment, and antiplatelet agent treatment (OR, 4.1; 95% CI, 1.01 to 24.9).

Multiple Logistic Regression Analysis with the Presence or Absence of SPP Below 50 mm Hg as the Dependent Variable
DISCUSSION
Our study showed that sarcopenia was significantly associated with the presence of impaired microcirculatory function in patients with T2DM after adjustment for confounding factors. The prevalence of sarcopenia was higher in those with an SPP ≤50 mm Hg than in those with an SPP >50 mm Hg, and significant positive correlations were found between SPP and appendicular muscle mass adjusted for height.
The microcirculation is a system of blood vessels less than 150 μm in diameter, comprising arterioles, capillaries, and venules [21]. This system is responsible for the primary function of the vasculature [21]. Diabetes may affect the microcirculation in diverse parts of the body, from the eyes to the kidney and skin [1]. Chronic vascular complications in diabetes are related to the microcirculation [2–4]. Diabetes-related microcirculatory dysfunction can eventually lead to more severe complications; therefore, it is necessary to detect microcirculatory dysfunction promptly and to identify patients at risk.
Skin microcirculation is an accessible model for estimating diabetes-associated vascular complications [9]. SPP utilizes a laser Doppler probe and pressure cuff to evaluate reactive hyperemia in the skin [11]. This technique can be performed easily, noninvasively, and simply, and it only takes a few minutes. This method does not cause any discomfort to the patient, and it can provide precise information about vascular status and potential ischemic areas [22,23].
Previous research investigated whether laser Doppler SPP can be used to evaluate the severity of limb ischemia in diabetes and/or hemodialysis patients [23]. In addition, studies evaluated whether SPP measurements in the foot were comparable to ABI and whether SPP could be used as a screening test for limb ischemia [14,24]. They found that SPP measurements are a valuable method for diagnosing PAD and that SPP can more easily be used to assess the severity of limb ischemia than the ABI. Although the ABI is the most widely recommended initial screening test for diagnosing PAD and assessing the severity of the obstruction in patients with PAD in the legs, the test has limitations in subjects with diabetes, in whom arterial calcification-associated stiffness is highly prevalent and may cause false results due to incompressibility [25].
In contrast, SPP is not affected by arterial wall calcification or skin temperature [23]. Because SPP measures the final pathway of capillary flow through the skin with a laser Doppler probe, it has the potential to determine severe limb ischemia status in the setting of calcification. Moreover, SPP can assess the effectiveness of revascularization or medical therapy and can predict successful wound healing. Studies have shown that SPP can assess microcirculation more effectively than macrocirculatory tests such as the ABI in patients with diabetes [24]. A study suggested that SPP values of 40 mm Hg or higher may be a reasonable treatment target for ischemic wounds [13]. Other studies showed that an SPP <50 mm Hg was associated with the highest sensitivity for detecting PAD and morbidity [14,26]. Okamoto et al. [14] reported the superiority of SPP measurements for detecting PAD in hemodialysis patients with a cutoff value of 50 mm Hg. In this study, we defined normal SPP values as >50 mm Hg, and using this cutoff, 13.7% of patients were diagnosed with impaired microcirculatory function in the lower limb. This prevalence rate is lower than those reported in other studies [18,26]. Our study did not include patients diagnosed with PAD, and the mean ABI of study population was 1.15, representing a lower probability of significant limb ischemia. Differences in the normal reference range and heterogeneity of the participants of each study may explain the different prevalence rates reported for microcirculatory dysfunction in the lower limbs.
In addition, whereas previous studies have reported a positive correlation between the ABI and SPP, no significant correlation was found between the ABI and SPP in the present study. Although we cannot provide a definitive explanation for the lack of a correlation between the ABI and SPP values in this study, we may speculate regarding some possible reasons. Most previous studies analyzed populations with PAD or other serious conditions such as CLI. In contrast, we only included T2DM patients without PAD. It therefore seems likely that differences in study populations (e.g., stable PAD vs. serious PAD vs. CLI vs. no evidence of PAD) may influence this result. Ishioka et al. [27] suggested some possible explanations for discrepancies between ABI and SPP values. In patients with normal or high ABI values (≥0.9) and low SPP values (<50 mm Hg), non-compressible vessels caused by high arterial calcification, as shown in hemodialysis or DM patients, might pseudo-normalize or even elevate the ABI value. Another possibility is the existence of below-ankle arterial lesions. ABI is measured using ankle pressure, but SPP examines the microcirculation of below-ankle locations such as the instep and sole. If a patient has impaired microcirculation only in the arteries below the ankle, normal ABI and abnormally low SPP values might be expected. In patients with a low ABI and normal SPP values, poor microcirculation below the knee and above the ankle might explain the discrepancy between the ABI and SPP.
Previous literature showed that the prevalence of sarcopenia was as high as 15% in Korean patients with T2DM, a proportion three times higher than that of control subjects [15]. Those researchers used the dual-energy X-ray absorptiometry (DXA) skeletal muscle index to diagnose sarcopenia. In another Korean study of 414 T2DM patients aged 65 years and older, the risk for low muscle mass was two to four times higher in patients with diabetes than in the control group [28]. In this study, we used BIA, and the prevalence of sarcopenia in all subjects was about 12%. We defined sarcopenia as a low AMI/Ht2 of less than 7.0 kg/m2 (in men) or 5.7 kg/m2 (in women). The prevalence of sarcopenia varies considerably, even within the same cohort, according to the different instruments and cut-off values that have been applied to define low muscle mass. In 2014, Chen et al. [20] presented a consensus statement from the Asian Working Group for Sarcopenia and proposed instruments and cut-off values for Asian countries. Both BIA and DXA were identified as appropriate for determining the body composition using criteria for Asians.
Sarcopenia occurs earlier in patients with T2DM than in those without T2DM, and is strongly related to increased frailty in patients with DM [16]. Patients with both sarcopenia and diabetes are more likely to be hospitalized and to experience poor clinical outcomes [17]. Although previous studies have suggested that vascular lesions might be associated with sarcopenia, only a few studies have shown that sarcopenia in T2DM patients is related with PAD, CLI, and mortality after leg amputation due to DFD [18,19]. Kim et al. [28] showed that the mortality rate in patients with sarcopenia was higher than that in those without sarcopenia in patients who underwent amputation for diabetic foot. These results imply that preventing sarcopenia in patients with diabetes is important for maintaining high survival rates. The presence of sarcopenia can be a predictor of the outcomes of leg amputation.
Cheng et al. [18] investigated the associations of sarcopenia with DFD in a cross-sectional study. They found that sarcopenia was independently associated with DFD (OR, 2.05; 95% CI, 1.15 to 3.89) after controlling for confounders including age, DM duration, and chronic vascular complications. A worse prognosis was seen in patients with DFD accompanied by sarcopenia. Compared to patients without sarcopenia, patients with sarcopenia exhibited a higher proportion of PAD (8.1% vs. 3.1%). The percentage of sarcopenia in DFD patients was more than double than that in patients without DFD (35.3% vs. 16.4%). The skeletal muscle index was significantly lower in patients with DFD (6.79±1.20 kg/m2 vs. 7.21±1.05 kg/m2).
To the best of our knowledge, this is the first study to investigate the associations of microcirculation, as assessed by SPP, with sarcopenia in patients with T2DM. The present study showed that individuals with sarcopenia had an OR of 4.1 for low SPP compared to those without sarcopenia after adjusting for sex, age, smoking, HbA1c, duration of DM, statin treatment, and antiplatelet agent treatment. If sarcopenia is associated with poor microcirculation, as seen in our results, this information could help select treatment plans to improve sarcopenia at earlier stages in patients with poor microcirculation.
The present study has several limitations that should be mentioned. First, because of the cross-sectional nature of this study, we could not determine the causality of the relationship between impaired microcirculation, as assessed by reduced SPP, and sarcopenia. Second, the sample size was too small to clarify the association of SPP with sarcopenia. The number of patients with sarcopenia in this study was only 12. As a result, the CI was very wide regardless of adjustment. We cannot exclude type 2 error because of the small sample size. A larger patient sample is needed to confirm our results. Third, there was a potential for selection bias because our study population consisted of individuals who underwent assessments for DM complications at a single university hospital; therefore, the present study subjects are not fully representative of all patients with DM. A larger sample size may allow generalization of our results. An additional limitation is that we assessed sarcopenia using only BIA. The definition of sarcopenia includes low muscle mass and low muscle strength. However, we did not evaluate muscle strength or physical performance. Nevertheless, a major strength of the present study is that it is the first study to investigate the potential association between microcirculation, as assessed using SPP, and sarcopenia.
In conclusion, we found that sarcopenia was significantly associated with impaired microcirculation, as assessed by SPP, in patients with T2DM. This is the first study to evaluate SPP and sarcopenia in T2DM patients, making our results meaningful. However, future prospective studies with a larger number of patients are required to establish a direct relationship between impaired microcirculation and sarcopenia in patients with T2DM. Early detection of peripheral hypoperfusion in patients with sarcopenia may be a valuable strategy for detecting and improving complications in patients with T2DM.
Supplementary Information
Notes
CONFLICTS OF INTEREST
No potential conflict of interest relevant to this article was reported.
AUTHOR CONTRIBUTIONS
Conception or design: C.H.J., J.O.M. Acquisition, analysis, or interpretation of data: C.H.J., D.C., B.Y.K. Drafting the work or revising: C.H.J., Y.Y.C., C.H.K., J.O.M. Final approval of the manuscript: J.O.M.
Acknowledgements
This study was funded by a grant from Soonchunhyang University.