Noninvasive Evaluation of Nonalcoholic Fatty Liver Disease
Article information

Abstract
Nonalcoholic fatty liver disease (NAFLD) is the most prevalent liver diseases and can progress to advanced fibrosis and end-stage liver disease. Thus, intensive research has been performed to develop noninvasive methods for the diagnosis of nonalcoholic steatohepatitis (NASH) and fibrosis. Currently, no single noninvasive tool covers all of the stages of pathologies and conditions of NAFLD, and the cost and feasibility of known techniques are also important issues. Blood biomarkers for NAFLD may be useful to select subjects who need ultrasonography (US) screening for NAFLD, and noninvasive tools for assessing fibrosis may be helpful to exclude the probability of significant fibrosis and to predict advanced fibrosis, thus guiding the decision of whether to perform liver biopsy in patients with NAFLD. Among various methods, magnetic resonance-based methods have been shown to perform better than other methods in assessing steatosis as well as in detecting hepatic fibrosis. Many genetic markers are associated with the development and progression of NAFLD. Further well-designed studies are needed to determine which biomarker panels, imaging studies, genetic marker panels, or combinations thereof perform well for diagnosing NAFLD, differentiating NASH and fibrosis, and following-up NAFLD, respectively.
INTRODUCTION
In parallel with increasing prevalence rates of obesity, metabolic syndrome, and diabetes, the prevalence of nonalcoholic fatty liver disease (NAFLD) has been increasing continuously [1]. Between 20% and 40% of the adult population is affected by NAFLD [2]. In patients with type 2 diabetes mellitus (T2DM), the NAFLD prevalence ranges from 70% to 95%, while the rate is extremely high in morbid obesity, at up to 98% [2]. In the general Korean population, the NAFLD prevalence ranges from 16.1% to 25.25% [3,4]. The global prevalence of nonalcoholic steatohepatitis (NASH) is between 1.5% and 6.5% [2]. However, the case definition based on abnormal aminotransferase levels or histological findings can be inaccurate, because a significant proportion of NAFLD subjects have normal liver enzymes and liver biopsy is performed only in selected subjects [1,5]. Thus, the prevalence of NASH could be as high as 12%, depending on the study design and population [6].
THE DEFINITION OF NAFLD
NALFD encompasses a spectrum of diseases ranging from simple steatosis (or nonalcoholic fatty liver [NAFL]) through NASH, to fibrosis and ultimately cirrhosis. Although steatosis can be defined by various clinically available diagnostic tools, it can be numerically and strictly defined by assessing liver fat: ≥5% of fat-containing hepatocytes assessed by light microscopy; proton density fat fraction (PDFF) ≥5% by magnetic resonance imaging (MRI), or >5.5% by proton magnetic resonance spectroscopy (1H-MRS) [7,8]. The histological findings of NAFL demonstrate hepatic steatosis without evidence of hepatocellular injury (e.g., ballooning of hepatocytes), and NAFL usually follows a benign clinical course. Conversely, the histological findings of NASH are characterized by the presence of hepatic steatosis and inflammation with distinctive hepatocyte injury (e.g., ballooning degeneration), and NASH is considered to be a potentially health-threatening disease that may progress to cirrhosis in 9% to 22% of patients and to hepatocellular carcinoma (HCC) as a complication [9,10]. The definitive diagnosis of NASH requires a liver biopsy.
IMPLICATIONS OF INTRAHEPATIC TRIGLYCERIDE CONTENT
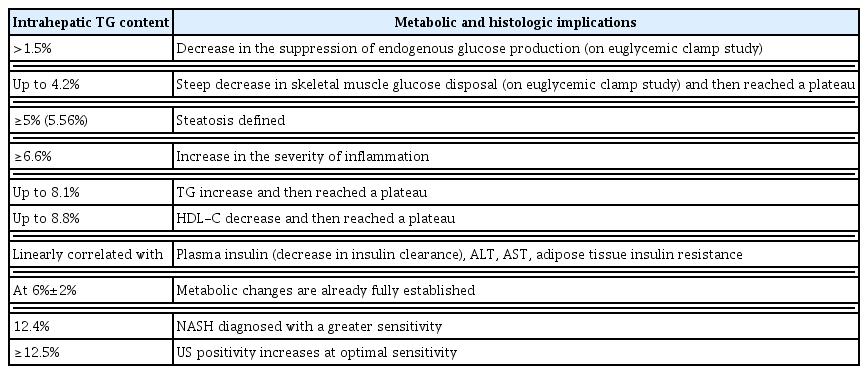
The threshold level of intrahepatic triglyceride (TG) content for the definition of NAFLD was based on a relatively small study [11]. Interestingly, an elegant study evaluated metabolic and histologic implications of intrahepatic TG content in NAFLD [12]. The study found that there was a clear threshold of intrahepatic TG content (6%±2%), after which metabolic changes, such as muscle insulin resistance (IR), hypertriglyceridemia, and decreased plasma high density lipoprotein cholesterol were already fully established (Table 1) [8,12–14]. This suggests that the definition of NAFLD by using MRI may underestimate the prevalence of fatty liver. In line with this view, a study reported that a cutoff value of 3% on MRI-PDFF may identify more subjects with biopsy-proven steatosis [15]. However, currently available and easy-to-perform US-based methods are very insensitive to detect such levels of steatosis [16]. Further, more accurate quantification of hepatic fat content by 1H-MRS or other magnetic resonance (MR)-based techniques does not predict the severity of histology [12,17]. Although liver biopsy provides an accurate diagnosis in approximately 90% of patients with unexplained abnormalities revealed by liver function tests [18], not all subjects with NAFLD could be evaluated by histologic study. Thus, noninvasive tools for screening, diagnosing, and staging steatosis, NASH, and fibrosis in NAFLD and for assessing the progression or regression of the disease are of paramount importance to both patients and their physicians. The evaluation of patients with NAFLD should be performed with consideration of metabolic and cardiovascular (CV) risk profiles as well as liver injuries including, in particular, hepatic fibrosis [19,20].
THE PROGRESSION OF NAFLD AND THE PROGNOSIS IN PATIENTS WITH NAFLD
In two previous studies that followed patients with NAFLD for a median of more than 15 years, the major causes of mortality were CV diseases (approximately 30%), extrahepatic malignancies (approximately 19%), and liver-related complications (15% to 19%) [9,21]. Although liver-related mortality could be higher in patients with NASH compared to those without NASH (simple steatosis with or without nonspecific inflammation) with a longer follow-up [22], there has been a lack of evidence for additional differential risk of all-cause mortality between subgroups of NAFLD patients with simple steatosis or NASH [9, 21–23]. Hepatic fibrosis is a key independent predictor that is associated with all-cause and CV mortality and mortality due to cirrhosis, HCC, and infectious diseases in patients with NAFLD [22–27]. However, the NAFLD activity score (NAS) for NASH was not shown to predict progression of fibrosis or mortality [24,25]. Thus, after the diagnosis of NAFLD, the stage of fibrosis should be assessed appropriately [24]. In addition to fibrosis, diabetes and smoking, and absence of statin use are associated with an increase in mortality, highlighting the need for comprehensive approaches in patients with NAFLD [25]. Collectively, at least 30% to 40% of patients with NAFLD require intensive observation and comprehensive measures to inhibit or regress the disease process [9,28].
LIMITATIONS OF LIVER BIOPSY
Liver biopsy may provide an accurate diagnosis in approximately 90% of patients with unexplained abnormalities revealed by liver function tests [18]. However, liver biopsy represents only approximately 1/50,000 of the organ and has its own inherent limitations, such as sampling errors or bias [29]. In fact, steatosis and fibrosis are not uniformly distributed among the segments of the liver [29,30]. Moreover, the progression of inflammation and fibrosis in NAFLD is a dynamic process for which liver biopsy may have limitations to follow all the stages of progression of this highly prevalent disease [31].
Noninvasive tools for fibrosis staging have not yet been perfected for therapeutic or other decisions but may be helpful for excluding the probability of significant fibrosis and for predicting advanced fibrosis, thus guiding the decision of whether or not to perform liver biopsy in a patient with NAFLD [32].
THE DIAGNOSIS AND EVALUATION OF NAFLD
Earlier studies reported that alanine aminotransferase (ALT) levels were elevated in 2.8% of the general population [33] and that 46.1% of asymptomatic subjects with elevated serum levels of hepatic enzymes were shown to have NAFLD on liver biopsy [21]. For subjects at risk, the major important processes in the diagnosis and assessment of NAFLD are (1) to determine the existence of hepatic steatosis, either by imaging or histology; (2) to exclude secondary causes of fatty liver; and (3) to assess NAFLD severity by establishing the presence of moderate-to-severe fibrosis (fibrosis stage of at least F2) [16]. Before making the diagnosis of NAFLD, secondary causes of hepatic fat accumulation and significant alcohol consumption (≥21 standard drinks/week for men and ≥14 standard drinks/week for women) need to be excluded [7]. Alcohol consumption over a 2-year time frame needs to be surveyed in detail using validated questionnaires [7]. However, it is noteworthy that there is also synergy between alcohol intake and obesity or genetic risk factors of NAFLD progression for any given level of alcohol intake [8]. Even in patients whose alcohol consumption level is low, meeting the diagnostic criteria of NAFLD, small amounts of alcohol intake may affect outcomes in NAFLD, which warrants further study [7,34]. After performing a history and examination, subsequent investigations should establish whether the patient has NAFLD or another liver condition.
A consensus regarding initial blood tests for NAFLD has not been reached among guidelines [35]. The decision on the extent of liver blood tests and interpretation of the results should be determined in a clinical context. In adults, initial screening tests may include abdominal US, hepatitis B surface antigen, hepatitis C antibody (with follow-on polymerase chain reaction if positive), anti-mitochondrial antibody, anti-smooth muscle antibody, antinuclear antibody, serum immunoglobulins, and simultaneous serum ferritin and transferrin saturation [35].
Although ALT levels have been shown to be the best single biochemical correlate of hepatic steatosis, liver enzyme levels can be normal in up to 50% to 79% of patients with NAFLD, fluctuating, or elevated in patients with NAFLD [8,36]. There have been suggestions that the current upper limit of normal (ULN) for ALT may be too high [37,38], and a recent guidance recommended an ALT of >30 U/L as being significant for males and >25 U/L significant for females [39]. A slight elevation of serum ferritin level (e.g., >1.5 ULN) generally reflects hepatic steatosis or secondary hemosiderosis rather than other liver diseases [40]. In many NAFLD patients, elevated ferritin may reflect a subclinical inflammatory state, rather than iron overload [31]. Similar to this observation, an R2* value on MRI (as an indicator of iron content) in its normal or minimally elevated range correlated more strongly with PDFF on MRI than the actual grade of hepatic iron content in patients with NAFLD [41]. Furthermore, low titers of autoimmune antibodies (in the absence of concomitant autoimmune hepatitis) are common and of no apparent clinical consequence [40].
Additionally, further clinical approaches to evaluate the presence of commonly associated comorbidities, such as obesity, diabetes, metabolic syndrome, hypertension, dyslipidemia, polycystic ovary syndrome, and obstructive sleep apnea, should also be performed [40].
NONINVASIVE STUDIES TO ASSESS HEPATIC STEATOSIS AND FIBROSIS
Blood markers of hepatic steatosis
Currently, no single biomarker is definitively diagnostic for NAFLD. Alternatively, noninvasive blood biomarkers for NAFLD may be useful for selecting subjects who need US screening for NAFLD. Clinical scores that have been developed to predict NAFL have included various clinical and laboratory parameters (Table 2) [29,42–48]. A previous study, where US, SteatoTest, and liver biopsy were performed together in 304 patients, showed that concordance between steatosis diagnosed at both US examination and biopsy, was lower (kappa coefficient=0.32±0.05) than the concordance between SteatoTest (at 0.50 cutoff) and biopsy (kappa=0.44±0.06; P=0.02) [45], indicating both US and blood biomarker have low sensitivity in identifying steatosis. Furthermore, many different scoring systems have been constructed based on specific populations or ethnic groups and have not been thoroughly validated across different ethnic populations. Thus, scoring systems may not be used for the diagnosis of NAFLD and decision-making process during the management of NAFLD prior to further validation [46]. Rather, these scoring systems may be useful for initial screening to select subjects who need a specific evaluation and for an epidemiologic prediction for NAFLD and/or cardiometabolic risk in population studies [44]. Further well-designed studies are needed to determine which biomarker panels perform better as an initial noninvasive tool for NAFLD screening. In addition, it has not yet been determined if liver fat scores are acceptable for monitoring patents during interventions aiming to reduce liver fat. A study showed that changes in fatty liver index and NAFLD liver fat score induced by a low-carb diet for 12 months did not correlated with changes of intrahepatic TG content after the dietary intervention [49].

Noninvasive Blood Biomarkers for the Prediction of Steatosis
IMAGING STUDIES
Currently, US, computed tomography (CT), MRI, 1H-MRS, and vibration-controlled transient elastography (VCTE) are relatively familiar imaging tools to study NAFLD depending on the center or clinic.
Ultrasonography and computed tomography
Although US generally has interobserver variability and limited sensitivity to detect mild (<20%) steatosis [16], it is the recommended first line screening method for patients with T2DM by the European NAFLD guidelines [34]. The sensitivity of liver US for the diagnosis of steatosis may be improved by the careful combination of different echographic parameters during the examination; with technical improvements in US equipment, optimum sensitivity could be achieved at a liver fat content of ≥12.5% (sensitivity of approximately 80% to 85%) [13,50]. The effect of liver fat content on examination is more pronounced when small amounts of fat are observed, as a previous study reported that liver US was only 12% sensitive to a 5% to 9% hepatic fat content in contrast to 80% sensitive to a ≥30% liver fat content [51].
The radiodensity of water is 0 Hounsfield unit (HU) by definition and air is defined as −1,000 HUs [16]. In non-contrast CT, normal liver parenchyma and fat are approximately 50 to 60 HUs and −20 to −100 HUs, respectively. Due to inconsistency in HU calibration by external factors, ‘fat-free spleen’ can be used as an internal reference [16]. Hepatic HU less than 40 has been suggested as a cutoff value for steatosis (>30%) [52], and liver HU–spleen HU value less than −9 to −10 can be used as a reference to detect steatosis [16,52–54]. Similar to US, CT has limited sensitivity to detect mild steatosis (<30% liver fat). Radiation exposure is an additional drawback of CT scanning [16,52].
In addition, even though US and CT are fairly reliable in the condition of >30% liver fat, assessment of dynamic changes in liver fat is not reliable [40].
Vibration-controlled transient elastography and other methods
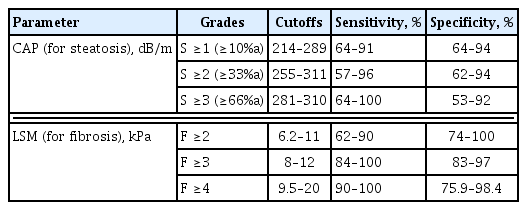
Elastography is a set of techniques by which tissue stiffness is estimated as a physical property termed the Young’s modulus [55]. VCTE measures the speed of a mechanically induced shear wave across the liver using pulse-echo ultrasonic acquisitions to obtain a liver stiffness measurement (LSM), as a marker of hepatic fibrosis, and ultrasonic energy loss as the sound wave passes through the liver to derive the controlled attenuation parameter (CAP), as a marker of hepatic steatosis. VCTE measures approximately a 1 cm diameter to 4 cm length region of tissue, which is 100 times larger than that evaluated with liver biopsy [55]. The velocity of shear wave, which is perpendicular to the direction of pulse wave propagation, is proportional to liver stiffness, with quantitative results available as the algebraically derived Young’s modulus in kPa [55]. VCTE is an easy-to-perform tool to obtain both LSM and CAP values using an M (3.5 MHz, at 2.5 to 6.5 cm-depth), or in case of morbid obesity, XL (2.5 MHz, at 3.5 to 7.5 cm-depth) ultrasound probe. LSM and CAP values range from 1.5 to 75 kPa and from 100 to 400 dB/m, respectively. The result of VCTE is obtained as a median of at least 10 measurements. Although the interquartile range (IQR) of the measurements less than 30% of the median is acceptable, an IQR median ratio ≤10% is the best predictor of accuracy [56]. CAP cutoffs for the diagnosis of steatosis have been variably reported from 248 to 288 dB/m that have wide range of sensitivity and specificity [57,58], as LSM cutoffs (≥8.2 to 9.6 kPa) for advanced fibrosis have also been variably reported [13,57,59]. Very low values of LSM (e.g., <5.6 kPa, or <6.5 kPa combined with a result from other non-invasive tests) suggest an exclusion of moderate fibrosis [60]. A recent excellent review summarized the performance of VCTE for the identification of stages of fibrosis (Table 3) [56].
Although LSM and CAP values are relatively reliable and well-validated, these parameters are affected by various patient factors, especially body mass index (BMI), which may lead to an overestimation [61,62]. With the availability of the XL probe, which has been proven for use in patients with morbid obesity, the failure rate of VCTE for obtaining the LSM and CAP values was reported to be less than 5%, while a significant disagreement was observed between the first and second readings for LSM and CAP when obtained back to back, at 18% and 11%, respectively [63]. However, the assessment of dynamic change with either VCTE-CAP or VCTE-LSM is not reliable [40]. VCTE data are not reliable under conditions in which a rapidly developing mass effect inside the liver will increase the intrahepatic pressure and thereby reduce the liver elasticity: right-sided (global) congestive heart failure, acute inflammation and/or edema of the liver, and extrahepatic cholestasis [56]. In addition, regarding food intake, a minimum 2-hour fast is currently recommended prior to the examination [56]. Because LSM does not represent absolute level of liver fibrosis, the results should also be interpreted with other clinical results (e.g., physical examination, laboratory tests, and imaging methods) [56].
Shear wave elastography (SWE, or supersonic shear imaging) and acoustic radiation force impulse (ARFI) are additional methods that are integrated into conventional US devices to measure LSM, which allows US evaluation of the liver (e.g., screening for HCC) during the same session [29]. Although SWE was shown to perform better than ARFI in differentiating ≥F2 fibrosis in patients with NAFLD, the three methods (VCTE, SWE, and ARFI) showed similar performances in differentiating ≥F3 stage of fibrosis and suffered from significant rate of failures or unreliable results [52,59].
Magnetic resonance-based techniques
1H-MRS has been a gold standard for the MR-based quantification of hepatic TG content in a size of 2×2×2 or 3×3×3 cm3 spectroscopic volume of interest, with high sensitivity and specificity, but it remains primarily a research tool due to its low availability and limited clinical application [11,52]. Compared with liver biopsy (50 to 100 mg of sample size), a much larger volume of liver tissue is assessed using 1H-MRS, minimizing the likelihood of sampling error [11]. In the Dallas Heart Study, where the 1H-MRS method was used to measure hepatic TG content, the reproducibility of the procedure was validated by showing that duplicate hepatic TG measurements were highly correlated (r=0.99, P<0.001) and that the coefficient of variation between measurements was low (8.5%) [11]. Essentially, in 1H-MRS for hepatic TG measurement, signals from protons associated with TG are identified primarily by their resonance frequencies (i.e., their position in the spectrum, x-axis) and are expressed as a shift in frequency (in parts per million relative to signals from protons associated with water) (Fig. 1) [64]. Additionally, the signal intensity of the metabolite (i.e., water or TG) peak (the amplitude measured along the y-axis) and the line width provide the “area” under a particular metabolite peak, which can be used to quantify the amount of observed metabolite within the sampled voxel of tissue (Fig. 1) [64]. The signal fat fraction (FF) is given as the fat signal (F) divided by the sum of the water (W) and fat signals [FF=F/(W+F)] [52].

Diagrams of spectrum obtained by hepatic proton magnetic resonance spectroscopy (1H-MRS). Proton spectra obtained from normal (A) and fatty (B) livers show resonance peaks from water and triglyceride (TG), with boxes highlighting the dominant lipid peaks from the resonance of methyl (−CH3) protons and methylene (−(CH2)n−) in the TG molecule along the frequency domain. ppm, parts per million.
In contrast to the measurement of differences in water and TG peaks on a resonance frequency domain by MRS, MRI uses frequency variation for spatial localization of the signal to a voxel to create a cross-sectional image [64]. Thus, advanced MRI can quantify hepatic steatosis by measuring the PDFF, which is the fraction of MRI-visible protons bound to fat divided by all protons bound to fat and water in the whole liver (Fig. 2). Chemical shift imaging is applied to separate the liver signal into its water and fat signal components by acquiring gradient echoes at appropriately spaced echo times [65,66].
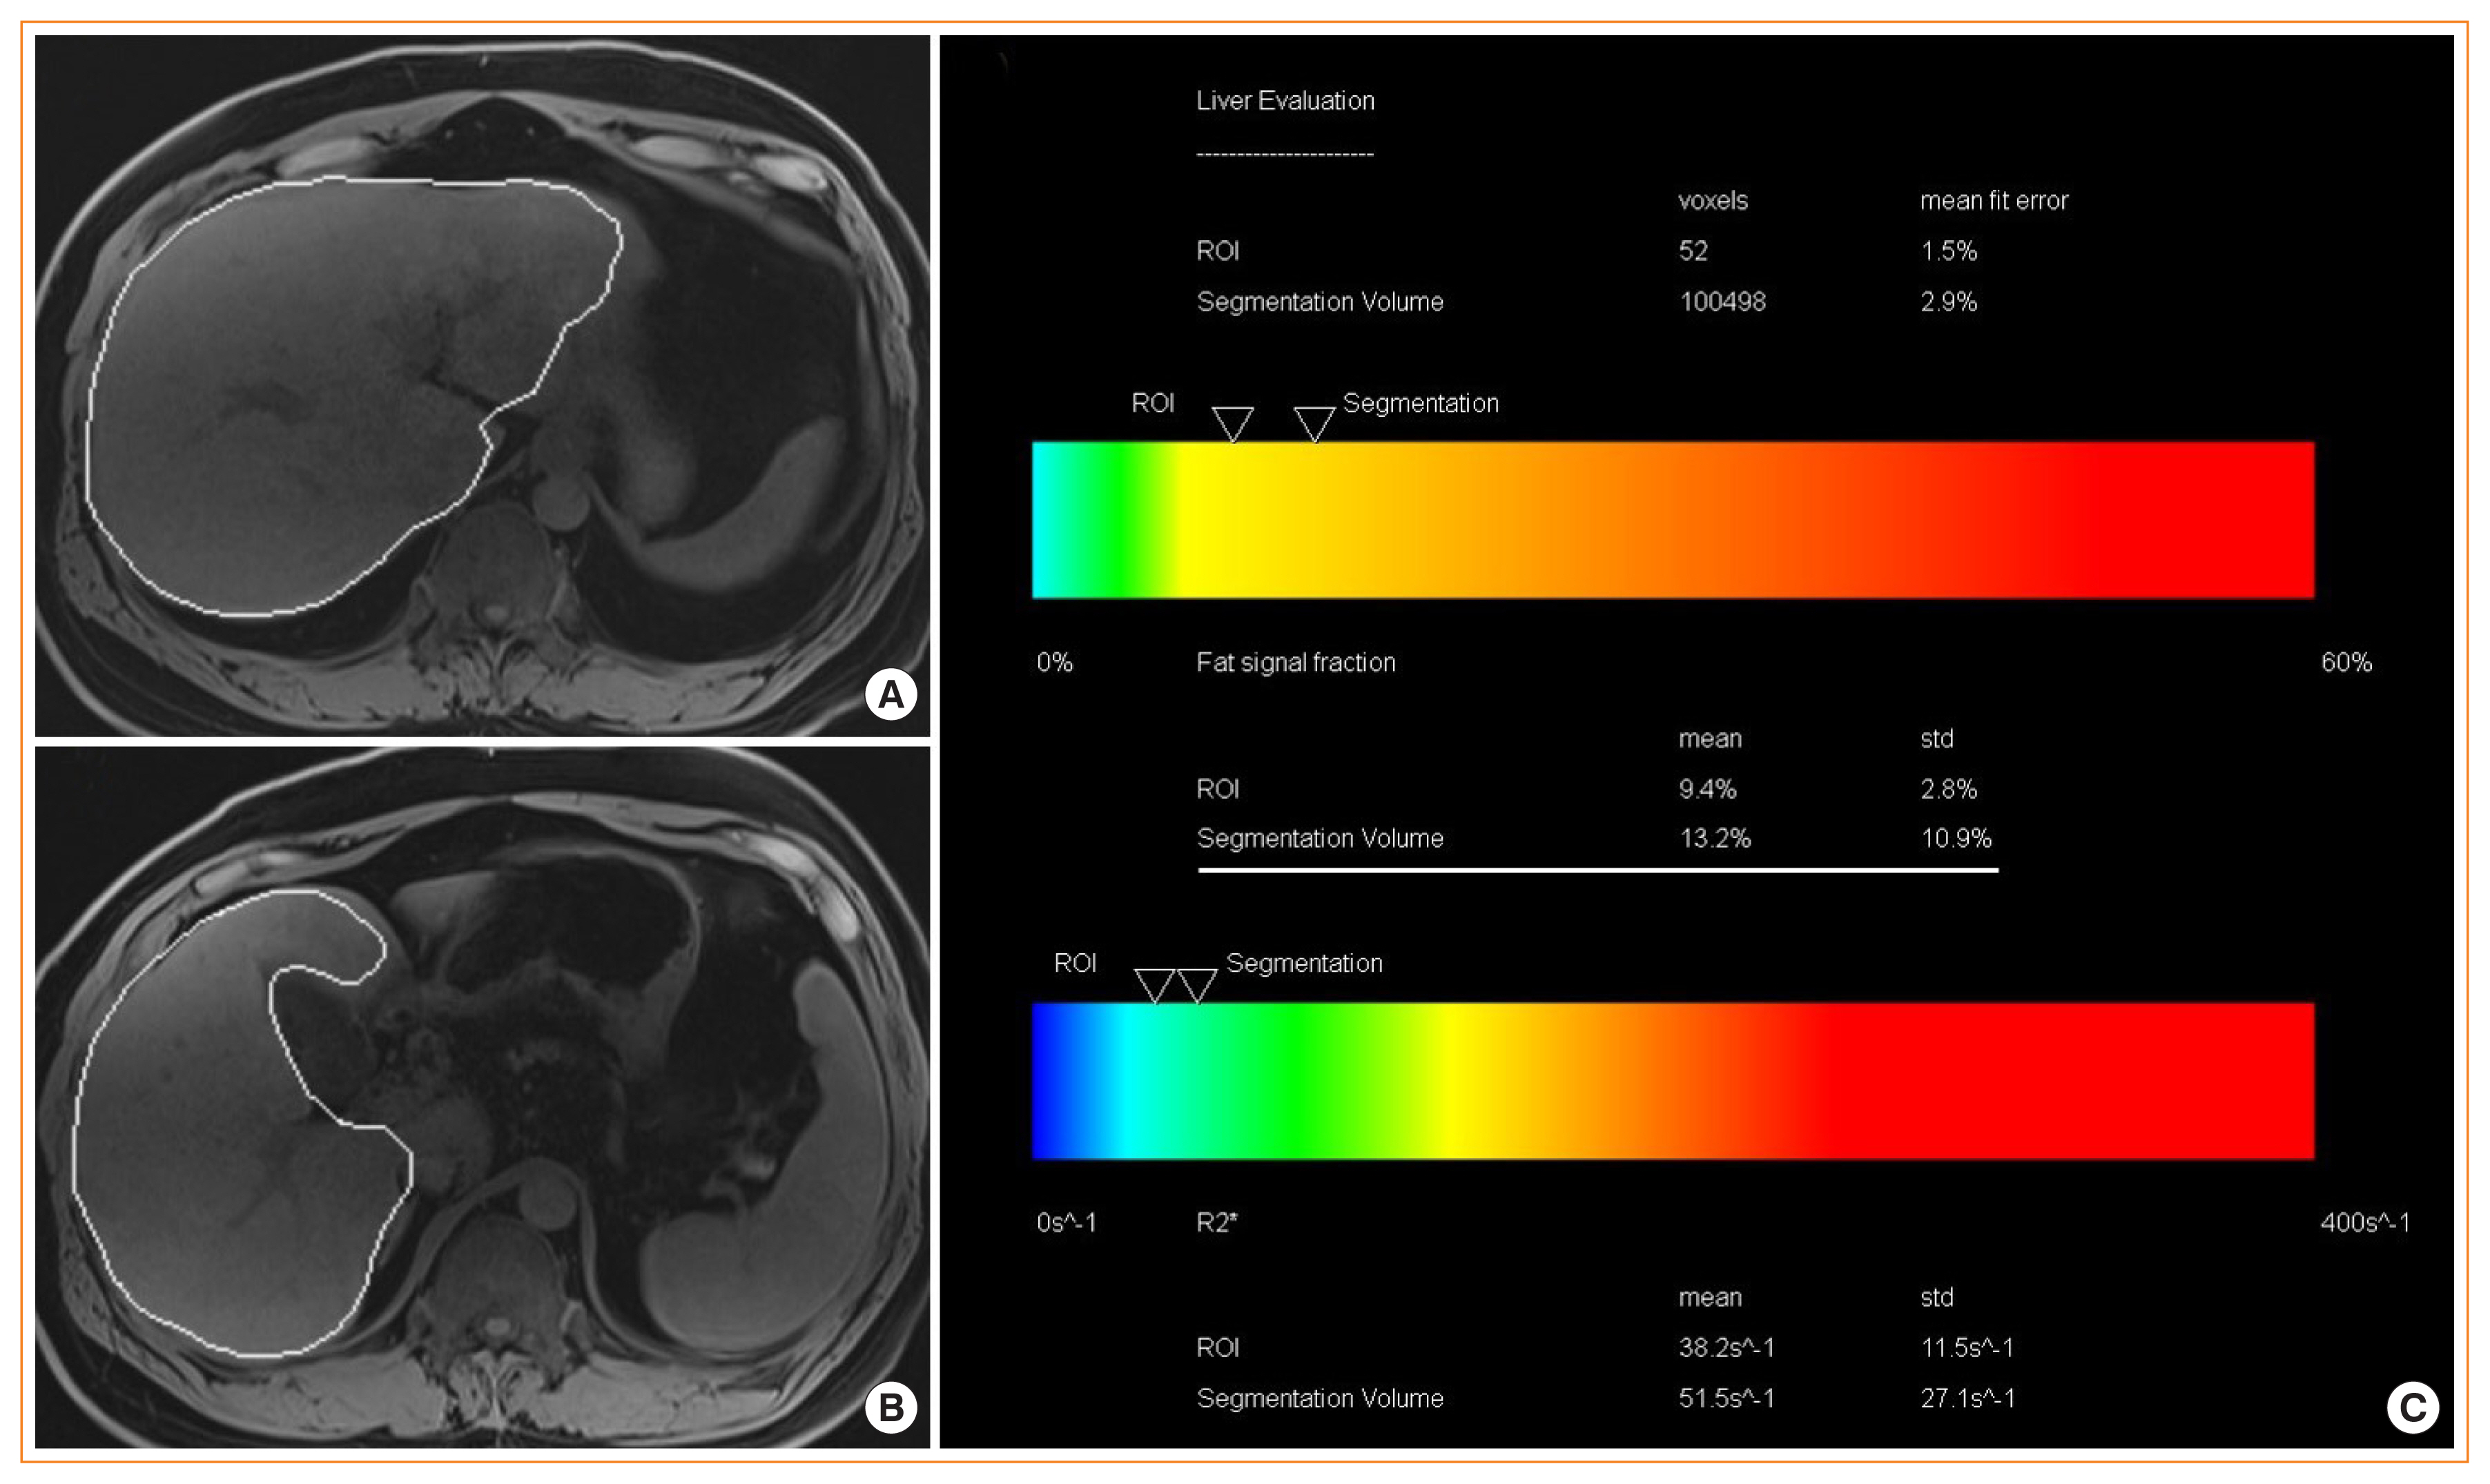
Hepatic magnetic resonance imaging (MRI)-proton density fat fraction (PDFF). Liver MRI-PDFF study in a patient with nonalcoholic fatty liver disease (NAFLD) showing. (A, B) T1-weighted magnetic resonance images showing the automatic capturing of the liver and (C) the summary of results that shows PDFF of the whole liver (13.2%) as well as R2* value (as a marker for liver iron content). R2* values of <126 S−1 are normal at 3T scanner examination [41].
The accuracy of MRI-PDFF was assessed through linear regression with MRS-PDFF, TG extraction, and histology in an elegant study by using ex vivo human livers [30], where MRI-PDFF showed an excellent correlation with MRS-PDFF (r=0.984) and strong correlation with histology (r=0.850) and tissue TG extraction (r=0.871). Furthermore, MRI-PDFF is not significantly affected by body factors, co-existing hepatic conditions, or technical factors [65]. Intraobserver agreement, interobserver agreement, and repeatability showed significantly smaller variance for MRI-PDFF than for histologic steatosis grading [30]. As the standard deviations of repeated MRI-PDFF measures have consistently been far less than 1%, MRI-PDFF can reliably detect longitudinal changes as small as 2 or less percentage points [65]. In line with this view, a clinical study showed that, longitudinally, patients who had a decrease or increase of MRI-PDFF ≥1% (confirmed by MRS-PDFF) showed a significant parallel decrease or increase in their body weight and serum aminotransferase levels at week 24 [67]. Such a small change in liver fat content could not be quantified with histology [67]. In a secondary analysis of a clinical trial involving patients with biopsy-proven NASH, histologic responders (≥2-point reduction in NAS, without any worsening of fibrosis on liver biopsy) had a proportional reduction in the MRI-PDFF of 29.3% from baseline which was statistically significant when compared with histologic nonresponders [68]. In contrast to 1H-MRS and liver biopsy [30,64], MRI-PDFF is therefore a robust, quantitative, non-invasive, MRI-based technique that can be used to diagnose steatosis exactly at whatever the grade of the state for the entire liver; thereby, overcoming the heterogeneity of fat deposition and is useful for clinical trials [52,67,69–71].
As an MR-based technique to measure parenchymal rigidity, after applying low-frequency vibrations to the abdominal wall, magnetic resonance elastography (MRE) tracks propagating shear waves by acquiring images with wave motion-sensitized phase-contrast sequences and processing raw images (i.e., magnitude and phase images) to “wave images” and then to “elastogram.” The cross-sectional elastogram images reflect the stiffness generated from the wave propagation information [72]. Technically, an MRE protocol can be performed with most MR scanners by adding hardware to generate mechanical waves and adding specific software for acquisition and processing (Fig. 3) [65]. Because the waves can be visualized and analyzed deep into the liver, MRE evaluates much larger volumes of total liver (approximately 5%) than liver biopsy and can be performed in conjunction with conventional MRI [73].

Hepatic magnetic resonance elastography (MRE). Liver MRE study in a patient with nonalcoholic fatty liver disease showing: (A) magnitude image, (B) phase contrast, (C) wave image, (D, E) gray and color scale stiffness maps (elastograms), and (F) color stiffness map with overlayed confidence map.
Normal liver parenchyma has shear stiffness values less than 3 kPa [72]. Most studies have demonstrated that MRE has a high diagnostic accuracy, with AUC ≥0.90 for identifying advanced fibrosis (F ≥3) and with MRE cutoff values ranging from 3.64 to 4.15 kPa [65,74–76]. Additionally, diagnostic accuracy is not affected by patient body factors or disease states. Thus, MRE is highly accurate for detecting hepatic fibrosis and the results are not influenced by patient demographics, making assessments reproducible across key sub-populations. In addition, the inter-observer agreement for staging fibrosis is nearly perfect and higher than that seen with histopathology [65,75,76].
A 15% increase in MRE-LSM may be associated with histologic fibrosis progression and progression from early fibrosis to advanced fibrosis [73]. However, the cutoff value for percent change in MRE to define the improvement of fibrosis requires further studies; it seems that more than a 20% to 25% difference is required to be confident considering the repeatability coefficient of MRE-LSM [77,78]. Of note is that acute hepatic inflammation may cause a false elevation of VCTE-LSM and MRE-LSM values without presence of fibrosis [72]. Fatty change in the liver does not affect MRE-LSM, whereas MRE-LSM does increase if simple steatosis progresses to inflammation (NASH), even before the onset of fibrosis [72]. Although MRE may be helpful for the early differentiation of NASH from simple steatosis because significant proportion of patients with NASH have fibrosis or are going to progress to fibrosis, currently MRE is not indicated for the diagnosis of NASH. However, this view should not be rigid, because simple steatosis as well as NASH can progress to liver fibrosis [79,80]. Therefore, after the diagnosis of NAFLD, the ideal approach would be to try to detect and stage liver fibrosis even in the absence of NASH [52].
Many studies have directly compared and demonstrated that the performance of MRE and MRI-PDFF is better than that of VCTE-LSM and VCTE-CAP, respectively, in diagnosing fibrosis and steatosis in NAFLD patients [81]. Furthermore, both MRI-PDFF and MRE as composite biomarkers have been partly validated in clinical trials [68,82].
As in VCTE, MRE needs to be performed in a fasting state, at least for 2 hours, because increased postprandial portal blood flow may cause a dynamic increase in liver stiffness in patients with liver disease, potentially leading to an overestimation of the extent of fibrosis [29,72].
BLOOD MARKERS OR CLINICAL SCORING SYSTEMS FOR HEPATIC FIBROSIS ASSESSMENT
In patients with NAFLD, the severity of hepatic fibrosis is the most powerful determinant of long-term outcomes, including mortality [24]; thus, the assessment of fibrosis is essential to managing patients with NAFLD. Several prediction scores have been developed and validated to identify or exclude advanced fibrosis (≥F3). First-line testing should use either FIB-4 index or the NAFLD fibrosis score (NFS). The AST to platelet ratio index (APRI) has a relatively low sensitivity [29], but in our experience, it has a comparable performance to that of FIB-4 (unpublished observation). Using these scoring systems, a significant proportion of patients at low risk of fibrosis could avoid an unnecessary liver biopsy [29]. Those patients with indeterminate FIB-4 (1.3 to 2.67) or NFS scores (–1.455 to 0.676) may comprise up to 30% of patients with NAFLD [83], requiring one of the second-line tests in a context-dependent manner, such as VCTE, serum enhanced liver fibrosis (ELF) score, or MRE. The ELF score is a surrogate index based on an extracellular matrix panel consisting of plasma concentrations of hyaluronic acid, tissue inhibitor of metalloproteinase 1, and procollagen type III amino-terminal peptide [84] However, the ELF test seems to need further validation, even though European guidelines recommend [34]. Patients with high FIB-4 (>2.67) or NFS (>0.676) values should be considered for referral to a specialist, irrespective of second-line tests [35] (Fig. 4). Thus, the use of these scores in combination with imaging studies seems to be more reasonable. Cytokeratin 18 fragments are created during cell death or apoptosis, and have been suggested as a NASH biomarker. However, the cytokeratin 18 fragment test did not outperform AST measurement in discriminating NASH from simple steatosis [85]. Although the combination of cytokeratin 18 with other parameters may improve the performance, this method requires further validation [29].
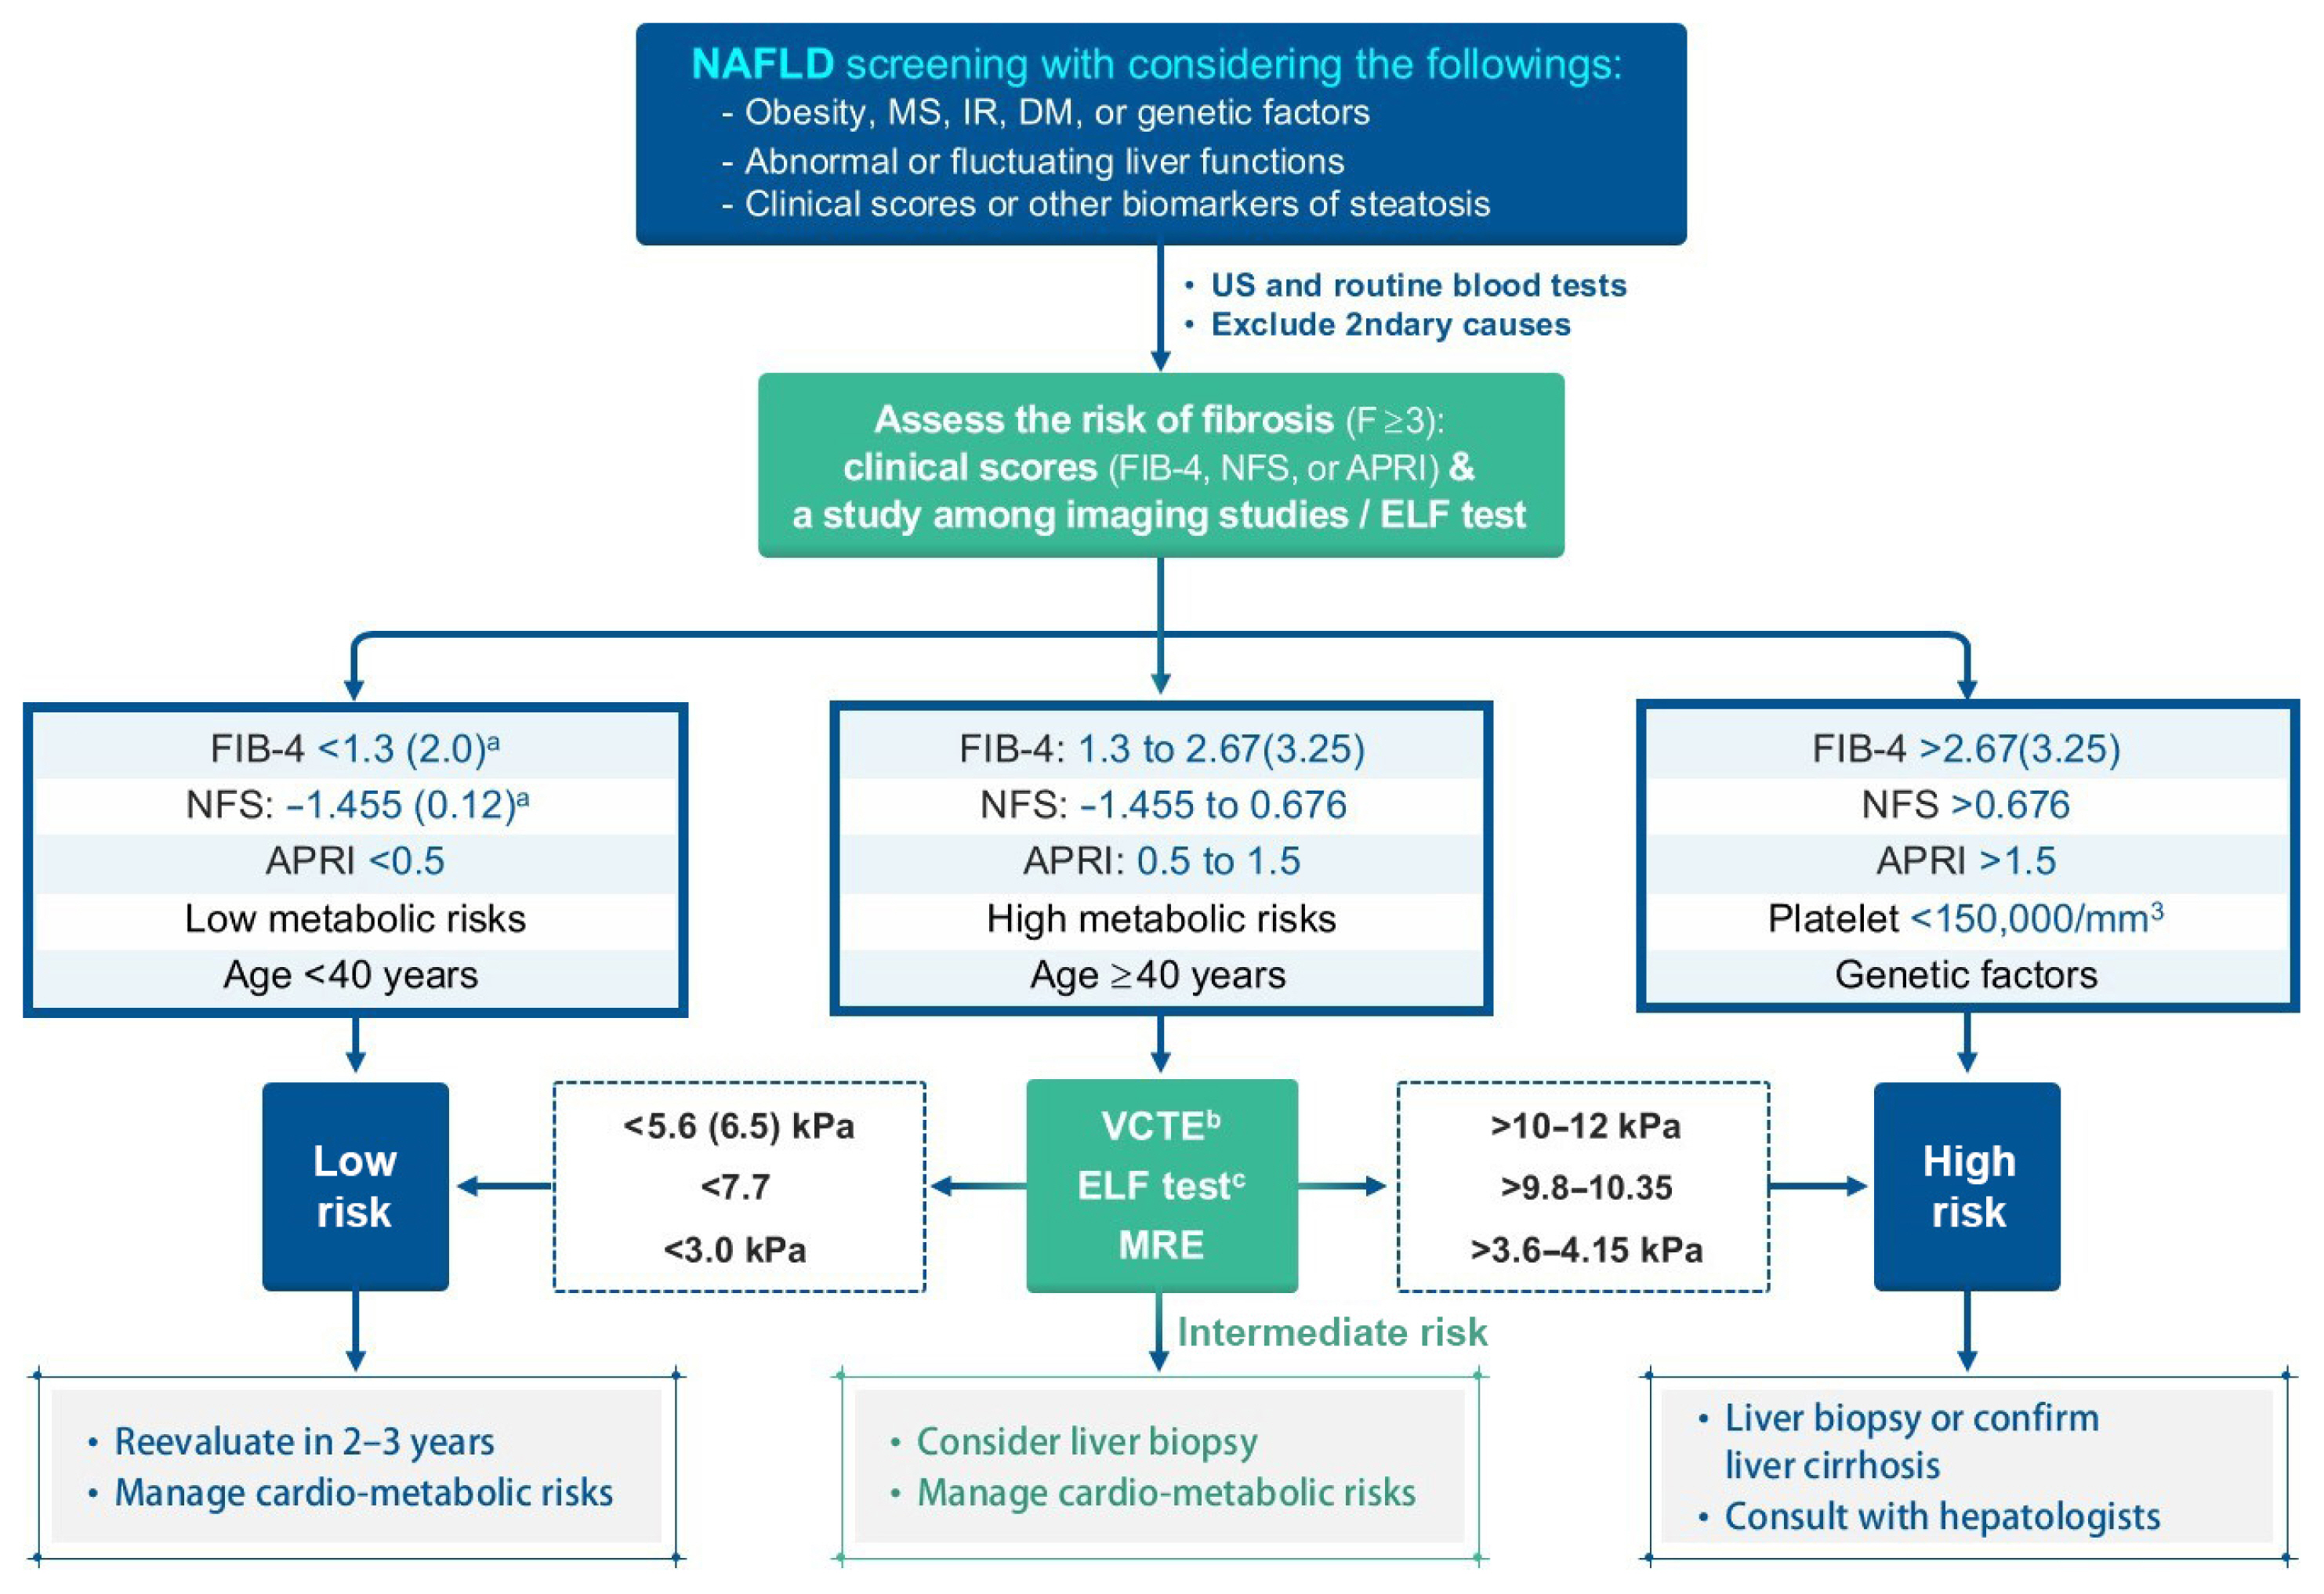
Algorithm for nonalcoholic fatty liver disease (NAFLD) evaluation. Calculations: NFS=−1.675+0.037×age (yr)+0.094×BMI (kg/m2)+1.13×IFG/DM (yes=1, no=0)+0.99×AST/ALT ratio–0.013×platelet (×109/L)–0.66×albumin (g/dL); FIB-4=(age×AST)/[PLT(×109/L)×(√ALT)]; APRI=[AST (IU/L)/ULN/PLT(×109/L)]×100. MS, metabolic syndrome; IR, insulin resistance; DM, diabetes mellitus; US, ultrasonography; FIB-4, fibrosis-4; NFS, NAFLD Fibrosis Score; APRI, AST to platelet ratio index; ELF, enhanced liver fibrosis; VCTE, vibration-controlled transient elastography; MRE, magnetic resonance elastography. aHigher cutoffs for patients aged >65 years; bAffected by body factors and suggested cutoff values have been variable; cFurther validation is required.
GENETIC VARIANTS
Variable prevalence of NAFLD and phenotypic expression of severity among populations, familial clustering, and twin studies indicate that there are genetic factors associated with NAFLD [40,86]. It was reported that genetic factors account for approximately 50% of the interindividual differences in the prevalence of NASH with cirrhosis in a twin study [87].
Genome-wide association studies have revealed many genes associated with NAFLD, and functional studies on those genes have added much knowledge on the pathogenesis of NAFLD and complex pathophysiologic pathways related with the disease, as a recent review provided systematic and detailed information on those genetic markers [86]. Among several genetic risk factors, single nucleotide polymorphisms (SNPs) in patatin-like phospholipase domain–containing 3 (PNPLA3) (rs738409 c.444 C>G, p.I148M), transmembrane 6 superfamily, member 2 (TM6SF2) (rs58542926 c.449 C>T, p.E167K), and membrane bound O-acyltransferase domain containing 7/transmembrane channel-like 4 (MBOAT7/TMC4) (rs641738 C>T) have been relatively well validated to promote the development of NAFLD and its progression (i.e., cirrhosis, HCC, or both) [88–92].
PNPLA3 encodes adiponutrin, a TG lipase that regulates both TG and retinoid metabolism and is mainly expressed in the liver, retina, skin, and adipose tissue [86]. The prevalence of the PNPLA3 I148M variant differs among ethnic groups ranging from 17% to 49%, and is generally correlated with that for NASH and its sequelae [86,90,93]. As such, a relatively high frequency of SNP in PNPLA3 risk allele has been reported in in Mexico, Japan, and Korea [40,94].
The variant is resistant to proteasomal degradation by evading ubiquitylation and accumulates on lipid droplets, which interferes with lipolysis and causes a change in phospholipid remodeling [95]. The PNPLA3 SNP rs738409 is strongly associated with hepatic steatosis, steatohepatitis, fibrosis, and HCC, independent of the presence of T2DM and obesity [92,96]. Rather, obesity increases steatosis, liver cirrhosis, and HCC in carriers of the PNPLA3 I148M variant [86,97]. In patients with non-obese NAFLD, the variant of PNPLA3 is more prevalent and is associated with NAFLD regression [86]. In addition, a recent phenome-wide association study showed that the variant of PNPLA3 is also associated with increased risk of T2DM and decreased risks of acne, gout, and gallstones [98].
TM6SF2 is involved in the secretion of apolipoprotein B-containing lipoproteins from hepatocytes, and TM6SF2 protein expression is markedly decreased in the livers of patients with NAFLD compared to control subjects [86,99]. In contrast to PNPLA3, the expression of which is induced by carbohydrates and free fatty acids via sterol response element binding protein 1c, there is no interaction of TM6SF2 expression and dietary factors [86]. The SNP rs58542926 C>T in TM6SF2 is less prevalent (approximately 7%) than the PNPLA3 variant and results in a loss-of-function mutation. It induces a higher liver TG content and lower circulating lipoproteins, but with preserved insulin sensitivity with regard to lipolysis and hepatic glucose production, and a lack of hypertriglyceridemia despite clearly increased hepatic fat content [86,100]. As with PNPLA3, the TM6SF2 minor (T) allele is associated with greater hepatic steatosis, more severe NASH and greater hepatic fibrosis/cirrhosis; intriguingly, the more common major (C) allele is associated with the promotion of very low-density lipoprotein excretion, conferring an increased risk of dyslipidemia and CV disease [91,101]. In line with this, in a large exome-wide association study of plasma lipids in more than 300,000 individuals, the PNPLA3 I148M and TM6SF2 E167K variants were strongly associated with hepatic steatosis and progression to NASH, cirrhosis, and HCC, but also with lower blood TG and cholesterol concentrations and protection from coronary artery disease [86,92].
The SNP rs641738 C>T near MBOAT7 has been shown to impact inflammation and fibrosis in patients with alcoholic cirrhosis, NAFLD, chronic hepatitis C, and chronic hepatitis B [102–105]. The rs641738 variant, which encodes p.G17E in TMC4, is associated with suppression of MBOAT7 at the mRNA and protein levels [86]. The MBOAT7/TMC4 rs641738 T allele has been shown to be associated with an increased risk of steatosis and histologic liver damage in NAFLD (i.e., higher severity of necro-inflammation and fibrosis) independent of obesity [104]. The variant may also predispose patients to HCC in patients without cirrhosis [91,106]. The MBOAT7 gene encodes lysophosphatidylinositol (LPI) acyltransferase 1, known as LPIAT1 or MBOAT7, which selectively uses LPI and arachidonoyl-CoA to form 2-arachidonoyl phosphatidylinositol (PI) [107,108]. Consistent with this function, lipidome changes in the plasma and liver of patients with NAFLD have been reported: decreases in plasma levels of PI (36:4), PI (38:3), and PI (38:5) and decreases in hepatic concentrations of PI (36:4) and PI (38:3) in proportion to the number of MBOAT7 variant alleles [104,109]. LPIAT1 contributes to the regulation of free arachidonic acid in the cell through the remodeling of phospholipids [110]. MBOAT7 deficiency is thus predicted to increase free polyunsaturated fatty acids and their pro-inflammatory eicosanoid lipids [106,111].
Glucokinase regulatory protein (GKRP), encoded by GCKR, is expressed only in the liver and regulates the partitioning of glucokinase between the cytosol and nucleus; thus it is involved in hepatic glucose uptake [112]. In the nucleus of hepatocyte, GKRP forms an inhibitory complex with glucokinase, the enzyme responsible for regulating the uptake and storage of dietary glucose [112]. Formation of the inhibitory complex is disrupted by glucose or fructose 1-phsophate after meals, resulting in translocation of glucokinase from the hepatocyte nucleus to the cytoplasm where it can drive glucose metabolism to glycogen synthesis and de novo lipogenesis. In contrast, fructose 6-phosphate (F6P), a by-product of gluconeogenesis and glycogenolysis, enhances the formation of an inhibitory complex between the enzyme and the regulatory protein, thus promoting nuclear retention and inactivation of glucokinase during fasting periods [112]. The P446L (rs1260326 C>T) variant of GCKR, encodes a loss-of-function protein that is unable to inhibit glucokinase in response to F6P [86]. Thus, the P446L variant of GCKR is associated with increased hepatic glucose uptake, which in turn may contribute to increased production of malonyl-CoA and de novo lipogenesis, increased glycolytic pathway activity, and concomitantly decreased serum glucose and insulin levels [86,113]. The GCKR P446L variant is also associated with an increased risk of NASH progression, fibrosis, and NASH-HCC in NAFLD patients as well as elevated serum TG levels [114,115].
Nutritional factors are very important even when considering genetic factors, as adiposity has been shown to amplify the effect of the NAFLD risk alleles in PNPLA3, TM6SF2, and GCKR [97,113]. Interestingly, in an Italian cohort study that evaluated the relationship between HCC risk and the total number of risk alleles, including PNPLA3 I148M, TM6SF2 E167K, and MBOAT7 rs641738 T, there was a significant association between the number of risk alleles and HCC [106].
In addition, several protective variants have also been reported [114]. In particular, SNPs (rs72613567, rs62305723, and rs 6834314) in HSD17B13, a gene that encodes the hepatic lipid droplet protein 17β-hydroxysteroid dehydrogenase type 13, were reported to be associated with decreased inflammation, ballooning, fibrosis, and liver enzyme levels in patients with NAFLD [116,117].
Recently, HSD17B13 was identified as a lipid droplet enzyme retinol dehydrogenase, highlighting the importance of retinoid homeostasis in NAFLD and its progression [117]. The splice variant rs72613567:TA produces a truncated, nonfunctional protein that is associated with lower odds of various liver diseases and HCC [116]. It was also found that the isoform encoded by the protective allele is catalytically defective against estradiol [116].
Lean NAFLD may have clinical characteristics and distinct course of progression: low BMI and lower level of IR, but faster fibrosis progression [31]. Although the cost of genotyping single gene variants is decreasing, and the knowledge about the role of genetic impact on the progression and development of NAFLD has been expanded, the use of genetic markers in the diagnosis and follow-up of NAFLD is not recommended in current guidelines. However, whether specific genetic markers are useful for the identification of subgroups with NAFLD at high risk of aggressive progression to cirrhosis and/or HCC needs to be studied.
CONCLUSIONS
Noninvasive biomarker panels are easy to use as initial screening test to rule out or rule in proceeding with imaging studies or liver biopsy. However, limited numbers of such tests have been validated and recommended in guidelines, for example, FIB-4 and NFS. Therefore, an imaging study, favorably US, may be considered under the current guidelines. However, MR-based techniques have more acceptable performance than others, although MRE-based fibrosis assessment and follow-up of the patients with fibrosis need to be further validated in the future. In the meantime, it is recommended to combine noninvasive blood biomarker panels or clinical scoring systems with imaging tools that afford clinics the ability to diagnose and/or follow-up fibrosis to avoid unnecessary liver biopsies.
Acknowledgements
This research was supported by a grant from the Korea Health Technology R&D Project through the Korea Health Industry Development Institute (KHIDI) funded by the Ministry of Health and Welfare, Republic of Korea (grant numbers: HI14C1135).
Notes
CONFLICTS OF INTEREST
No potential conflict of interest relevant to this article was reported.