Triglyceride Glucose Index Is Superior to the Homeostasis Model Assessment of Insulin Resistance for Predicting Nonalcoholic Fatty Liver Disease in Korean Adults
Article information

Abstract
Background
Recently, the triglyceride glucose (TyG) index has been considered a surrogate marker of insulin resistance which is a well-known pathogenic factor in nonalcoholic fatty liver disease (NAFLD). However, few studies have investigated the relationship between the TyG index and NAFLD. Thus, we investigated the relationship between the TyG index and NAFLD and the effectiveness of the TyG index compared with the homeostasis model assessment of insulin resistance (HOMA-IR) in identifying NAFLD in Korean adults.
Methods
Participants of 4,986 who underwent ultrasonography in a health promotion center were enrolled. The TyG index was calculated as ln [fasting triglycerides (mg/dL)×fasting glucose (mg/dL)/2], and HOMA-IR was estimated. NAFLD was diagnosed by ultrasonography.
Results
Significant differences were observed in metabolic parameters among the quartiles of the TyG index. The prevalence of NAFLD significantly increased with increment in the TyG index. After adjusting for multiple risk factors, a logistic regression analysis was performed. When the highest and lowest quartiles of the TyG index and HOMA-IR were compared, the odds ratios for the prevalence of NAFLD were 2.94 and 1.93 (95% confidence interval, 2.32 to 3.72 and 1.43 to 2.61; both P for trend <0.01), respectively. According to the receiver operating characteristic analysis, the TyG index was superior to HOMA-IR in predicting NAFLD.
Conclusion
The TyG index and prevalence of NAFLD were significantly related and the TyG index was superior to HOMA-IR in predicting NAFLD in Korean adults.
INTRODUCTION
Nonalcoholic fatty liver disease (NAFLD) is one of the most frequently occurring disorders of the liver, with the incidence gradually increasing worldwide [12]. NAFLD encompasses a range of liver diseases, including liver fibrosis, simple steatosis and cirrhosis. Histopathologic changes associated with NAFLD may lead to liver failure, hepatocellular carcinoma and ultimately, hepatic mortality [34]. In recent years, the importance of NAFLD as a metabolic disorder has been realized, not only with regards to hepatic manifestation, but several studies have shown that NAFLD is also related to type 2 diabetes mellitus, abdominal obesity, dyslipidemia, hypertension, and cardiovascular disease [56789]. Although the mechanisms associated with the onset of NAFLD remain poorly understood, insulin resistance (IR) has been found to be associated with the development of NAFLD [101112]. The homeostasis model assessment of insulin resistance (HOMA-IR) is a widely used surrogate marker of IR and is one of several methods used for evaluating IR [13]. Numerous studies have found that an independent relationship exists between NAFLD and HOMA-IR [141516]. In addition, other studies have proposed that HOMA-IR diagnostic criteria can be used for predicting NAFLD [1718].
Recently, the triglyceride glucose (TyG) index, which is calculated on the basis of triglycerides (TGs) and fasting glucose levels, has emerged as a reliable surrogate marker of IR. Moreover, the TyG index correlates with the HOMA-IR and hyperinsulinemic-euglycemic clamp test for recognizing IR [192021]. Despite this, few studies have evaluated the TyG index in the context of NAFLD [222324]. Therefore, in this study, we sought to elucidate the relationship between NAFLD and the TyG index and compare the effectiveness of the TyG index and HOMA-IR in identifying NAFLD in Korean adults.
METHODS
Study participants
A total of 5,989 Korean subjects (age ≥20 years) who were participants in an in-depth health checkup program at the Gangnam Severance Hospital Health Promotion Center from January 2008 to February 2015, were included in the study. Subjects with elevated levels of TGs (≥400 mg/dL), an acute inflammation, history of malignancy, renal or infectious disease, viral hepatitis (positive for hepatitis B surface antigen or anti-hepatitis C virus antibody), liver cirrhosis or malignancy observed via ultrasound were excluded from this study. Subjects with history of diabetes mellitus or newly diagnosed diabetes in this exam were also excluded. Furthermore, any subjects taking statins, TG-reducing therapies (e.g., fenofibrate or omega-3), thiazolidinediones, or injecting insulin were also excluded, as were males and females with a history of heavy alcohol consumption that exceeded 30 and 20 g/day, respectively. After the exclusion criteria were applied, 4,986 participants were included in the final analysis. All methods were performed in accordance with the ethical standards of the responsible committee on human experimentation and with the World Medical Association Declaration of Helsinki. Written informed consents were provided by all subjects before data collection. The study protocol was approved by the Institutional Review Board of Yonsei University College of Medicine (approval number: 2018-0077).
Clinical characteristics of the study participants
The height and weight of each participant was measured and the body mass index (BMI, kg/m2) was calculated. The social and medical history of each participant was obtained by administering a self-questionnaire, which included questions regarding smoking, alcohol status, medications, and a history of other diseases. Experienced technicians measured the systolic blood pressure (SBP) and diastolic blood pressure (DBP) respectively, after a 5-minute of rest, with the patient's arm placed at the same level as the heart using an automated blood pressure monitor (HEM-7080IC, Omron Healthcare, Lake Forest, IL, USA). A diagnosis of diabetes mellitus was made on the basis of a prior history of diabetes or the American Diabetes Association's diagnostic standards. Subjects with SBP and/or DBP ≥140/90 mm Hg or those presently using antihypertensive medication were defined as having hypertension. Subjects who had regularly smoked cigarettes over the past 6 months were considered to be current smokers.
Biochemical parameters
After an 8-hour fasting period, blood samples were collected from all subjects. The samples were immediately centrifuged and the serum was subsequently stored at −70℃ until further analysis was required. The levels of fasting plasma glucose (FPG), total cholesterol (TC), high density lipoprotein cholesterol (HDL-C), TG, aspartate aminotransferase (AST), and alanine aminotransferase (ALT) were assessed using enzymatic procedures, with an automated chemistry analyzer (Hitachi 7600-120, Hitachi, Tokyo, Japan). The level of low density lipoprotein cholesterol (LDL-C) was calculated using Friedewald formula. The TyG index was computed using the following formula: ln [fasting TGs (mg/dL)×fasting glucose (mg/dL)/2] [19]. The levels of hepatitis B surface antigen and anti-hepatitis C virus antibodies were measured using a Roche E-170 device (Roche Diagnostics, Mannheim, Germany). The fasting serum insulin level was determined using a radioimmunoassay kit (Daiichi Radioisotope Labs, Tokyo, Japan). IR was approximated using the HOMA-IR index which was calculated using following formula: [fasting insulin (µU/mL)×FPG (mg/dL)/405].
Ultrasonographic analyses
A diagnosis of fatty liver disease was made on the basis of the findings of an abdominal ultrasonography scan performed using a 3.5-MHz transducer (HDI 5000, Philips, Bothell, WA, USA). One of three experienced radiologists, who were blinded to the subjects' clinical information, performed the abdominal ultrasonographic examination. Any degree of fat accumulation in the liver was considered to be NAFLD in the present study. The subjects were classified into four groups on the basis of the existence and severity of NAFLD according to the level of hepatic tissue hyperechogenicity, discrepancy between the liver and right kidney, and visibility of the vascular structures [25].
Statistical analysis
Continuous variables with a normal distribution were presented as the mean±standard deviation. Continuous variables with skewed distributions were presented as the median with the interquartile range and were transformed to a log scale for analysis. Intergroup comparisons were performed using Student's t test or one-way analysis of variance with post hoc analysis. Categorical variables with percentages were compared using chi-square test. After adjusting for any confounding variables, a multivariate logistic regression analysis was used for estimating the odds ratio (OR) and associated 95% confidence interval (CI) for NAFLD on the basis of the TyG index and HOMA-IR. The area under the curve (AUC) of the receiver operating characteristic (ROC) curve was calculated for comparing the predictive power of the TyG index and HOMA-IR for the prevalence of NAFLD. Z test was used for comparing the differences between AUCs. Statistical significance was considered for P values less than 0.05. SPSS for Windows version 23.0 (IBM Co., Armonk, NY, USA) and MedCalc (MedCalc software, Olstead, Belgium) were used for performing all statistical analyses in the present study.
RESULTS
A total of 4,986 subjects were included in the present study, 2,069 of whom were diagnosed with NAFLD using ultrasound data (41.5%). The comparison of the baseline characteristics of the subjects enrolled in this study, with and without NAFLD, is presented in Table 1. The subjects with NAFLD were older; more likely to be male; and had a higher BMI, blood pressure, insulin, HOMA-IR, LDL-C, FPG, TC, TG, AST, ALT, and TyG index but lower HDL-C than the subjects without NAFLD. In addition, the proportion of subjects with hypertension was significantly higher among those with NAFLD than those without.
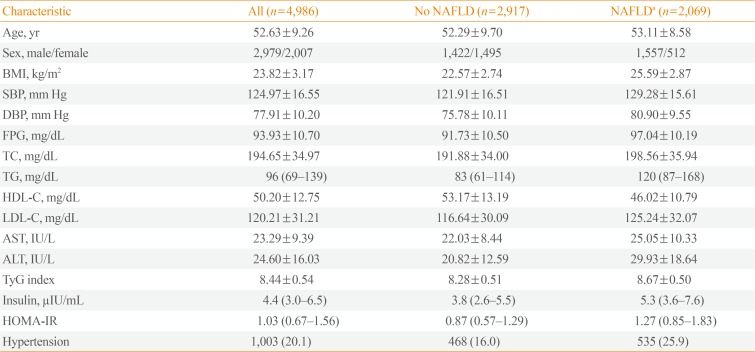
Clinical Characteristics of the Study Subjects Based on NAFLD Status
The subjects were divided into four groups on the basis of their TyG indices (Q1: TyG index≤8.04; Q2: 8.05≤TyG index≤8.42; Q3: 8.43≤TyG index≤8.81; Q4: TyG index≥8.82). Table 2 outlines the demographic, clinical, and laboratory information for each group. The metabolic parameters were associated with significant differences between the groups. There was an increase in the number of males, BMI, SBP, DBP, AST, ALT, insulin, HOMA-IR, FPG levels, the prevalence of hypertension, as well as an increase in the levels of TC, TG, and LDL-C. However, the level of HDL-C was found to decrease with increasing TyG index.
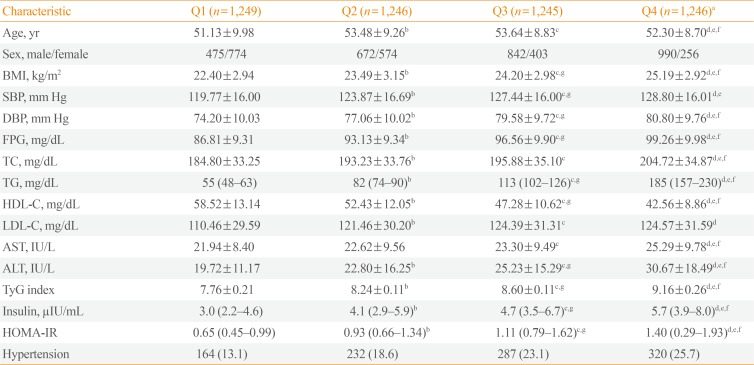
Clinical Characteristics of the Study Participants Based on TyG Index
The subjects were also classified into four groups according to their HOMA-IR (Q1: HOMA-IR≤0.67; Q2: 0.68≤HOMA-IR≤1.03; Q3: 1.04≤HOMA-IR≤1.56; Q4: TyG index≥1.57) and results demonstrated that both the prevalence and severity of NAFLD increased with increasing TyG index and HOMA-IR quartiles (Fig. 1).
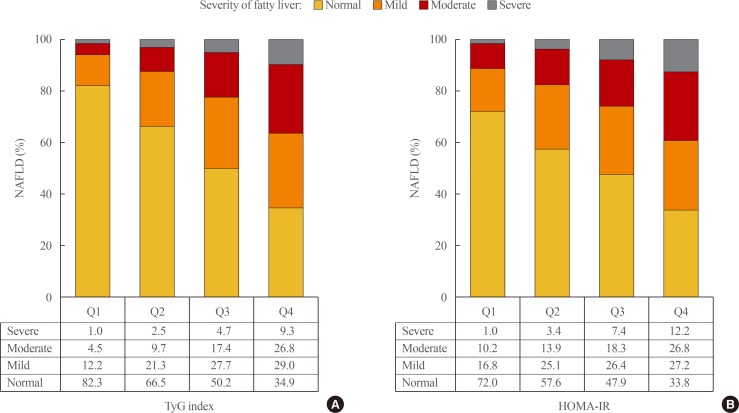
The prevalence and severity of nonalcoholic fatty liver disease (NAFLD) based on the (A) triglyceride glucose (TyG) index and (B) homeostasis model assessment of insulin resistance (HOMA-IR). Ultrasonography was used for diagnosing the severity of fatty liver disease (all P<0.01).
The association between the TyG index and NAFLD was investigated by dividing the TyG index into the following quartiles: the first quartile (Q1) was used as a reference (Table 3). When Q1 was set as a reference, the unadjusted multivariate logistic regression analysis revealed that in all subjects, the TyG indices for Q2, Q3, and Q4 were associated with higher OR for the presence of NAFLD. Moreover, these relationships remained significant (P for trend <0.01) even after adjusting for confounding variables. The association between the HOMA-IR and the presence of NAFLD was further investigated by categorizing the HOMA-IR into quartiles, with the first quartile used as the reference (Table 3). Results showed that there was a significant relationship (P for trend <0.01) between the higher HOMA-IR quartile and the presence of NAFLD, even after adjusting for confounding variables. After adjusting for multiple risk factors, the OR (95% CI) in the highest quartile for NAFLD using HOMA-IR was 1.93 (95% CI, 1.43 to 2.61) compared with 2.94 (95% CI, 2.32 to 3.72) for the TyG index. The AUC (95% CI) of the ROC curve for the TyG index at 0.716 (95% CI, 0.702 to 0.731) was significantly higher than that of the HOMA-IR at 0.672 (95% CI, 0.650 to 0.694) (P<0.01). These results suggest that regarding the prediction of NAFLD, the TyG index is superior to the HOMA-IR.
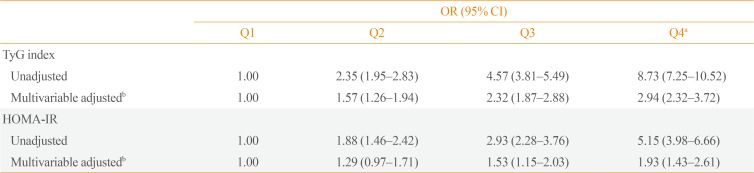
Nonalcoholic Fatty Liver Disease OR and 95% CI Based on the TyG Index and HOMA-IR Quartiles
DISCUSSION
In the present study, following adjustment for conventional risk factors, an independent relationship between the TyG index and NAFLD was observed. Furthermore, results demonstrated that the TyG index was superior in its ability to identify NAFLD compared with HOMA-IR. To the best of our knowledge, this is the first study wherein the diagnostic effectiveness of the TyG index and HOMA-IR for identifying NAFLD has been compared.
NAFLD is related to IR and metabolic syndromes associated with hyperinsulinemia, hypertriglyceridemia, and hyperglycemia [5262728]. Recently, Zheng et al. [29], even demonstrated that TyG index could predict an incidence of NAFLD in longitudinal, prospective cohort study. In agreement with previous studies, most of the metabolic risk factors evaluated by us increased or decreased according to the TyG index and the presence of NAFLD. In addition, unlike previous studies, which reported an association between the presence of NAFLD and the TyG index [222324], we further examined the relationship between the severity of NAFLD and the TyG index. Results demonstrated that the severity of NAFLD was strongly associated with the TyG index.
IR has been shown to have an important pathological association with NAFLD. Furthermore, both the TyG index and HOMA-IR are well-known representative markers of IR. In the present study, Pearson's correlation analysis was performed and confirmed that there was a significant relationship between the TyG index and HOMA-IR (r=0.466, P<0.001) (data not shown). Interestingly, we observed that the TyG index displayed a higher OR and AUC of the ROC curve than the HOMA-IR for predicting NAFLD. These results suggest that the TyG index is a superior surrogate marker for predicting NAFLD. Recent studies have also reported the superiority of the TyG index for identifying IR [213031]. For example, Vasques et al. [21] reported that the TyG index was superior to HOMA-IR in identifying IR in a Brazilian population. Although the reason for this finding remains unknown, the underlying mechanism for the superiority of the TyG index over HOMA-IR in predicting NAFLD can be explained by the crucial roles of glucotoxicity and lipotoxicity play in the modulation of IR, which shows key pathological association with NAFLD [323334]. Our findings are in line with those of recent studies that demonstrate the superiority of the TyG index to HOMA-IR for evaluating metabolic risk factors associated with IR (e.g., diabetes and subclinical atherosclerosis) [353637]. In contrast, other studies have reported that the HOMA-IR primarily reflects IR in the liver [3839]. The mechanisms associated with this relationship should be clarified in prospective large-scale studies.
The present study had the following limitations. (1) Since this was a cross-sectional observational study, a causality cannot be presumed from the results. (2) The participants comprised Korean adults from a single institution and most of subjects were non-obese, healthy population. For these reasons, levels of fasting insulin and HOMA-IR were relatively low compared with other previous studies. Thus, the generalizability of the results may be limited. (3) The TyG index was compared with the HOMA-IR rather than with the hyperinsulinemic-euglycemic clamp test as the gold standard for assessing IR. However, the IR index derived from a euglycemic clamp has been shown to correlate with the TyG index and HOMA-IR. (4) A liver biopsy with a histological examination was not performed, which is the gold standard technique for identifying steatosis. Moreover, ultrasound was used for assessing the presence of NAFLD in this study; however, ultrasonography, a first-line imaging technique, is a highly useful noninvasive technique that is often used in both clinical practice and epidemiological studies [40].
The results of the present study indicate that there is a significant association between the TyG index and the prevalence of NAFLD in Korean subjects. Moreover, the TyG index was superior to HOMA-IR in predicting NAFLD. The TyG index is a simple and cost-effective marker of IR and appears to be a useful marker for predicting NAFLD.
ACKNOWLEDGMENTS
We would like to thank the Gangnam Severance Health Promotion Research team for supporting the construction of the registry of data from the Health Promotion Center of the Gangnam Severance Hospital.
Notes
CONFLICTS OF INTEREST: No potential conflict of interest relevant to this article was reported.
AUTHOR CONTRIBUTIONS:
Conception or design: J.S.P., S.B.L., M.K.K.
Acquisition, analysis, or interpretation of data: S.K., K.P., J.H.K., S.J.B., J.S.N., C.W.A.
Drafting the work or revising: S.B.L., M.K.K., J.S.P.
Final approval of the manuscript: J.S.P.