Association between Bone Mineral Density and Albuminuria: Cross-Sectional Analysis of Data from the 2011 Korea National Health and Nutrition Examination Survey V-2
Article information

Abstract
Background
Albuminuria is known to be independently associated with progression of renal and cardiovascular disease. However, little is known regarding the exact relationship between albuminuria and bone mineral density (BMD). The aim of this population-based study conducted in Korea was to identify the association between albuminuria and BMD.
Methods
We performed a cross-sectional analysis of data from the Korea National Health and Nutrition Examination Survey (KNHANES V-2) 2011. BMD was measured for total hip (TH), femur neck (FN), and lumbar spine (LS). Analysis of covariance was used to compare BMD levels between the groups at the TH, FN, and LS sites, after adjusting for age. Separate analyses were performed according to sex; women were divided into two groups according to menopausal status and each group was subdivided into three according to urine albumin-to-creatinine ratio (level 1, <30 mg/g; level 2, 30 to 299 mg/g; level 3, ≥300 mg/g).
Results
Data on a total of 1,831 adults (857 men and 974 women) were analyzed. In postmenopausal women, after adjusting for age, BMD of TH tended to decrease as levels of albuminuria increased (0.767±0.117, 0.757±0.129, 0.752±0.118, respectively; P=0.040). However, there was no significant difference in BMD according to albuminuria level in premenopausal women and men.
Conclusion
Level of albuminuria was closely related with BMD of TH in postmenopausal women, after adjusting for age, but there was no significant relationship between albuminuria and BMD in premenopausal women and men.
INTRODUCTION
Osteoporosis is one of the most prevalent and important medical concerns due to the high rates of morbidity and mortality from osteoporotic fractures [1]. It has recently been reported that the prevalence of osteoporosis in Korea is 7.3% in men and 38.0% in women aged over 50 years [2], and the number of affected patients is increasing. Nevertheless, patients with osteoporosis have no definitive symptoms until osteoporotic fractures take place. Therefore, early diagnosis and prevention of osteoporosis are important health issues.
Albuminuria, urine albumin-to-creatinine ratio (UACR) equal or more than 30 mg/g in the urine, is a common health condition, affecting up to 5.2% of the general population in Korea [3]. Traditionally, albuminuria has been recognized as a prognostic marker of chronic kidney disease [4]. It has also been suggested that albuminuria is strongly associated with an increased risk of cardiovascular disease (CVD) [5] and increased levels of inflammatory markers [6]. Given the importance of albuminuria, its clinical implications are likely to be wider.
We were interested in ascertaining if there was a relationship between albuminuria and bone mineral density (BMD), which would enable early screening for osteoporosis. We found little previous research on the association between these factors. Therefore, we performed a cross-sectional analysis among a general adult population to determine the relationship between albuminuria and BMD.
METHODS
Study population and design
We conducted this study based on data from the second year of the fifth Korea National Health and Nutrition Examination Survey (KNHANES V-2), conducted in 2011. KNHANES V contains nationally representative statistics on demographics, health status, health-related behavior, actual diet, nutritional status, and blood and urine sampling was conducted by the Chronic Disease Surveillance Division of the Korea Centers for Disease Control and Prevention (KCDC) from 2010 to 2012.
Our study included subjects aged over 30 who had available data of BMD and urine albumin testing. We excluded women who have experienced early menopause (<40 years) or menopause after hysterectomy.
We collected data on age, past history of treatment for hypertension and/or diabetes mellitus, and current smoking and drinking statuses. Heavy drinking was categorized as drinking alcohol four or more times per week. Postmenopausal status was defined as the absence of menses for at least 1 year. We surveyed physical activities using the International Physical Activity Questionnaire [7].
Urine albumin excretion was categorized as one of three levels, according to UACR (level 1, less than 30 mg/g; level 2, between 30 and 299 mg/g; level 3, equal or more than 300 mg/g).
All participants gave informed written consent for KHNANES V-2. The study protocol was approved by the Institutional Review Board of the KCDC, who waived the requirement for further informed written consent (201102CON-06-C). The study was carried out in accordance with the Declaration of Helsinki.
Measurements
Waist circumference (WC) was measured to the nearest 0.1 cm on a horizontal plane at the midpoint level between the iliac crest and the costal margin at the end of normal expiration. The heights and weights of the subjects were measured to the nearest 0.1 cm and 0.1 kg, respectively. Body mass index (BMI) was calculated by dividing weight by the square of height (kg/m2). Systolic blood pressure (BP) and diastolic BP were measured three times using a mercury sphygmomanometer (Baumanometer, W. A. Baum Co. Inc., Copiague, NY, USA). Each participant was seated and rested for at least 5 minutes before BP was measured. The BP value used for statistical analysis was the average of measurements.
Venous blood samples were obtained after overnight fasting. Plasma glucose, total cholesterol, low density lipoprotein cholesterol, high density lipoprotein cholesterol, and triglyceride levels were measured using a Hitachi Automatic Analyzer 7600 (Hitachi, Tokyo, Japan). Glycated hemoglobin (HbA1c) levels were measured using high-performance liquid chromatography (HLC-723G7, Tosoh, Tokyo, Japan). Spot urine albumin concentrations were obtained from a turbidimetric assay (Hitachi Automatic Analyzer 7600), and serum and spot urine creatinine levels from a colorimetric assay using the compensated rate-blanked Jaffe method (Cobas 8000® C702, Roche Diagnostics Korea, Seoul, Korea). The UACR was calculated as the ratio of urine albumin to creatinine (mg/g).
Whole body dual-energy X-ray absorptiometry (DXA) was performed with a Discovery™ QDR fan-beam densitometer (Hologic Inc., Bedford, MA, USA) according to the procedure recommended by the manufacturer. BMD levels were measured at the total hip (TH), femur neck (FN), and lumbar spine (LS). The results of DXA were analyzed according to the standard protocol of the Korean Society of Osteoporosis using Hologic Discovery™ software version 13.1.
Definitions of diabetes mellitus and hypertension
Diabetes mellitus was defined as a fasting glucose equal or more than 126 mg/dL or HbA1c equal or more than 6.5% or self-reported physician's diagnosis or intake of antidiabetic medication. And hypertension was defined as an average systolic BP equal or more than 140 mm Hg or diastolic BP equal or more than 90 mm Hg or self-reported physician's diagnosis or intake of antihypertensive agents.
Statistical analysis
Data were analyzed using SPSS statistics version 21 (IBM Co., Armonk, NY, USA). Continuous variables with normal distributions were presented as mean±standard deviation, whereas continuous variables with non-normal distributions were expressed as median (interquartile range [IQR]). In order to compare baseline characteristics, Pearson chi-square test was used for categorical variables and analysis of variance for continuous variables. Analysis of covariance was used to compare BMD levels between the groups at the TH, FN, and LS sites, after adjusting for age. Separate analyses were performed for premenopausal women, postmenopausal women, and men, and BMD levels were analyzed according to the three UACR levels. All statistical tests were two-tailed, and significance was defined as a P<0.05.
RESULTS
Clinical characteristics of the study participants
A total of 8,518 people participated in KNHANES V-2, and 2,757 of them had available measurement of BMD. Of these, we included 1,831 participants (857 men and 974 women) who had available urine albumin testing and were aged over 30 years old. Among 974 women, 379 were premenopausal and 595 were postmenopausal.
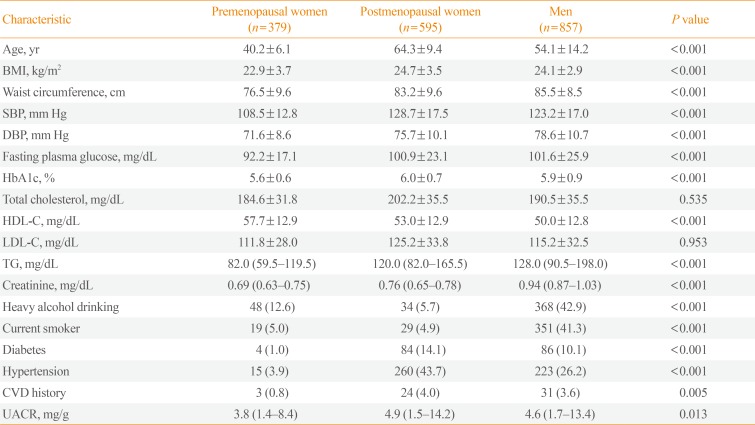
Table 1 shows the baseline clinical and biochemical characteristics of the study population. Mean ages were 40.2±6.1, 64.3±9.4, and 54.1±14.2 years old, and median UACRs were 3.8 mg/g (IQR, 1.4 to 8.4), 4.9 mg/g (IQR, 1.5 to 14.2), and 4.6 mg/g (IQR, 1.7 to 13.4) in premenopausal women, postmenopausal women, and men, respectively.

Baseline Characteristics of the Study Population According to Sex and Menopausal Status Based on the 2011 Korea National Health and Nutrition Examination Survey
Table 2 presents the clinical characteristics and laboratory variables of study participants based on the three albuminuria levels. Premenopausal women with level 2 albuminuria (30 to 299 mg/g) had higher BMI, WC, and total cholesterol levels, and had more prevalence of hypertension than premenopausal women with level 1 albuminuria (<30 mg/g). There were positive relationships between level of albuminuria and age, systolic BP, fasting plasma glucose, and HbA1c in postmenopausal women and men.

Baseline Characteristics of the General Population According to UACR Based on the 2011 Korea National Health and Nutrition Examination Survey
BMD according to level of albuminuria
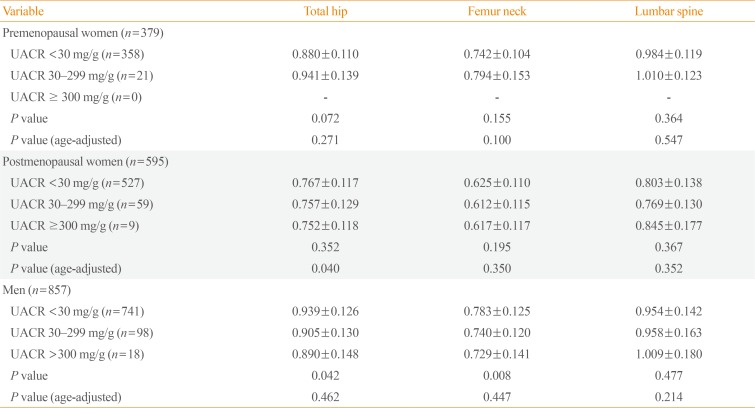
Table 3 shows BMD of TH, FN, and LS according to albuminuria level. In postmenopausal women with higher level of albuminuria had significantly more chance of lower BMD of TH, after adjusting for age (0.767±0.117, 0.757±0.129, and 0.752±0.118, respectively; P=0.040). However, there was no significant difference in BMD of FN or LS according to level of albuminuria in postmenopausal women, after adjusting for age. Similarly, there was no significant difference in BMD according to level of albuminuria among premenopausal women or men.

Bone Mineral Density of Total Femur, Femur Neck, and Lumbar Spine According to Albuminuria Groups
DISCUSSION
In this cross-sectional study, we examined the association between albuminuria and BMD in a general adult population. Our analysis showed that albuminuria is negatively related to BMD of TH in postmenopausal women; however, we found no relationship between albuminuria level and BMD in premenopausal women and men, after adjusting for age.
Previous cross-sectional studies have reported a close relationship between albuminuria and metabolic syndrome [89]. Moreover, the Prevention of Renal and Vascular End Stage Disease study recommended that elevated excretion of albumin in the urine should be included as a component of metabolic syndrome, which was defined by the International Diabetes Federation in order provide consensus diagnostic criteria to more reliably predict the development of type 2 diabetes mellitus, chronic kidney disease, and CVD [10].
The World Health Organization included microalbuminuria as an essential component of metabolic syndrome in 1998 following a consultation on proposed criteria [11]. However, the National Cholesterol Education Program's Adult Treatment Panel III (NCEP-ATP III) and the European Group for the Study of Insulin Resistance formulated definitions which did not include microalbuminuria [1213]. The NCEP-ATP III definition is more widely used, merely because it is simpler for clinical practice [14]. Nevertheless, there is a close relationship between albuminuria and metabolic syndrome.
A relationship between metabolic syndrome and osteoporosis has also been shown in previous studies [15161718]. Though its mechanism still remains unclear, it is worth noting that adipose cells and osteoblasts are derived from the same mesenchymal stem cells [19]. Moreover, the fact that many types of cytokines and peroxisome proliferator-activated receptor γ have effects on the differentiation and growth of the two cell types may explain the relationship [2021]. Furthermore, it has been demonstrated that bone tissue formation is influenced by the fat-derived hormones leptin and adiponectin also via signals generated from adipose tissue [2223], based on the presence of receptors for adipokines on both osteoblasts and osteoclasts [24]. Conversely, it has been found that bone tissue is involved in direct and indirect modulation of adipose tissue [25].
Inflammatory cytokines (i.e., interleukin 1 [IL-1], IL-6, and tumor necrosis factor α) derived from adipose tissue also play a pivotal role in bone reabsorption and in the pathogenesis of osteoporosis [262728]. The levels of these cytokines are positively related to bone loss in healthy women [2930]. Therefore, it is suggested that low-grade inflammation originating from adipose tissue in patients with metabolic syndrome may contribute to bone loss.
The weight of evidence points to a close relationship between albuminuria and metabolic syndrome, although the underlying mechanism that links albuminuria and metabolic syndrome has not yet been elucidated. Moreover, a relationship between metabolic syndrome and osteoporosis has also been found in previous studies. This may explain the link between albuminuria and osteoporosis.
There are a few previous studies on the association between albuminuria and BMD. In one study, albuminuria was negatively associated with BMD of the LS and FN in women, and estimated glomerular filtration rate was negatively associated with BMD of LS in both men and women [31]. Another study demonstrated a relationship between albuminuria and risk of hip and pelvic fractures [32]. However, little is known regarding the exact association between albuminuria and BMD levels, or the mechanisms involved. In another study, metabolic syndrome appeared to have a beneficial effect on bone mass, an effect largely explained by the higher mechanical load of patients with metabolic syndrome [3334].
In this study, albuminuria was negatively related to BMD of TH in postmenopausal women after adjusting for age, but there was no significant difference between albuminuria levels and BMD in premenopausal women. We postulate that, apart from the negative effects of hormonal dysregulation, increased mechanical loading due to being overweight plays a major role on BMD of premenopausal women. After menopause, however, we postulate that this beneficial effect is outweighed by the detrimental effects of hormonal dysregulation. Thus, it is feasible that menopause marks a pivotal turning point in bone metabolism in women. Nevertheless, the mechanism underlying the association between albuminuria and BMD in postmenopausal women remains unclear.
Our study has some limitations. First, given the cross-sectional nature of the study, causality could not be addressed. Therefore, prospective studies are needed. Second, we did not adjust for other associated factors because after adjusting except age, the results have lost the statistical significance. Third, we did not analyze data regarding the duration of menopause in postmenopausal women. Fourth, we did not consider a level of drugs known to affect bone metabolism.
While our hypotheses remain speculative and require further investigation, existing studies support the association between albuminuria and BMD in women. However, more precise prospective studies are needed to confirm these results.
In conclusion, in the present study, albuminuria was closely related to BMD of TH in postmenopausal women, but there was no relationship between albuminuria levels and BMD in premenopausal women and men. Consequently, we suggest that albuminuria levels may be a useful predictor of osteoporosis in postmenopausal women.
ACKNOWLEDGMENTS
This study was supported by the research fund of the Honam Branch of the Korean Endocrine Society (2016).
Notes
CONFLICTS OF INTEREST: No potential conflict of interest relevant to this article was reported.
AUTHOR CONTRIBUTIONS: Conception or design: D.H.L., C.G.C. Acquisition, analysis, or interpretation of data: J.M.L., H.Y.K., T.Y.Y. Drafting the work or revising: T.Y.Y., C.G.C. Final approval of the manuscript: D.H.L., C.G.C.