Utility of the Visceral Adiposity Index and Hypertriglyceridemic Waist Phenotype for Predicting Incident Hypertension
Article information

Abstract
Background
The aim of this study was to assess the utility of the visceral adiposity index (VAI) and the hypertriglyceridemic waist (HTGW) phenotype as possible hypertension (HTN) predictors in a high-risk population without diabetes and HTN.
Methods
Incident HTN over a 7-year follow-up was assessed among 1,375 first-degree non-diabetic and non-hypertensive relatives of consecutive patients with type 2 diabetes who were 30 to 70 years of age. HTN was defined as a blood pressure reading ≥140/90 mm Hg or the use of antihypertensive medications. We examined the incidence of HTN across VAI quintiles and four groups defined according to baseline fasting serum triglyceride (TG) levels and waist circumference (WC).
Results
The VAI and the HTGW phenotype at baseline were related to an increased risk for HTN. In comparison with the lowest VAI quintile, the highest VAI quintile showed a significant associated with HTN in an age- and gender-adjusted model (odds ratio [OR], 1.65; 95% confidence interval [CI], 1.07 to 2.55). Those with HTGW were 2.3 times (OR, 2.27; 95% CI, 1.54 to 3.35) more likely to develop HTN than those with a normal WC and normal TG levels.
Conclusion
Greater VAI values weakly predicted HTN, whereas the HTGW phenotype was a stronger predictor of incident HTN in an Iranian high-risk population.
INTRODUCTION
Hypertension (HTN) is a rapidly growing health problem worldwide [1]. The prevalence of HTN has increased and remains high in Iran, as approximately 27% of Iranian adults have HTN [2]. Therefore, it is important to identify individuals who are at a higher risk of HTN.
Many studies have examined the link between obesity, particularly abdominal obesity, and HTN [34567]. The relationship between abdominal obesity and HTN remains inconclusive [34567]. Nevertheless, because anthropometric measures such as body mass index (BMI), waist circumference (WC), and waist-to-hip ratio (WHR) cannot differentiate between visceral and subcutaneous fat, Amato et al. [8] created a gender-specific index based on WC, BMI, triglycerides (TGs), and high density lipoprotein cholesterol (HDL-C) and termed it the visceral adiposity index (VAI). For similar reasons, Lemieux et al. [9] established a phenotype based on a combination of abdominal obesity and elevated fasting TG levels and termed it the hypertriglyceridemic waist (HTGW) phenotype, in order to distinguish visceral fat from subcutaneous fat. They observed that VAI and HTGW were closely related to visceral adiposity measured by magnetic resonance imaging [10]. Magnetic resonance imaging and computed tomography (CT) are gold standards for the measurement of visceral fat, but they are not appropriate for epidemiological studies and everyday practice for practical, ethical, and economic reasons. Only limited investigations have examined the association between visceral adiposity measured by CT and the risk of HTN [111213141516171819], with inconclusive results. Some studies showed a significant or borderline significant association [111315161718], whereas others reported no association [19] or an association in women but not men [14]. No longitudinal study has inspected the relationships of the VAI and the HTGW phenotype with HTN risk, and the clinical utility of the VAI and the HTGW phenotype in predicting HTN has not been investigated.
Therefore, the objective of this ongoing longitudinal study was to assess the ability of the VAI and/or the HTGW phenotype to predict HTN incidence in a high-risk population without diabetes or HTN.
METHODS
Data were drawn from the Isfahan Diabetes Prevention Study (IDPS), the details of which have been presented elsewhere [20]. In brief, the IDPS, initiated in 2003, is an ongoing longitudinal study carried out in a cohort of first-degree relatives (FDRs) of patients with type 2 diabetes mellitus (T2DM) in central Iran to measure several possible risk factors for diabetes in individuals with a family history of T2DM. At baseline, our sample comprised 3,483 FDRs of consecutive patients with T2DM (919 men and 2,564 women). All participants were seen at the Isfahan Endocrine and Metabolism Research Center, which is part of the Isfahan University of Medical Sciences, Iran.
The study was started between 2003 and 2005. At the time of each examination, subjects underwent anthropometric measurements and laboratory tests, including a standard 75-g 2-hour oral glucose tolerance test (OGTT), and also completed a questionnaire on their health status and several possible risk factors of diabetes. Participants were followed up consistently according to the standard of medical care for diabetes [21], and information was obtained regarding demographic, anthropometric, and lifestyle factors, as well as new diagnoses of diabetes and HTN. If the OGTT was normal at baseline, then repeat testing was carried out at least at 3-year intervals. Otherwise, repeat testing was usually carried out every year.
Ethics statement
The protocols for the IDPS were approved by the Isfahan University of Medical Sciences Ethical Committee. All participants provided written informed consent.
Follow-up and diagnosis of HTN
Of the 3,483 participants who took part at baseline, 2,108 were excluded for one or more of the following reasons at baseline: prevalent T2DM (n=329), prevalent HTN (n=632), and failure to attend follow-up examinations (n=1,009); a further 138 participants who took part in follow-up but had missing data on blood pressure (BP) and the necessary components of the VAI were also excluded, resulting in 1,375 participants who were ultimately included in the study. The mean age±standard deviation (SD) of participants was 42.6±6.4 years (range, 30 to 70), and all participants underwent at least one subsequent additional examination during a mean±SD follow-up period of 7.3±2.1 years (range, 1 to 10). Pregnant women were excluded (Fig. 1).
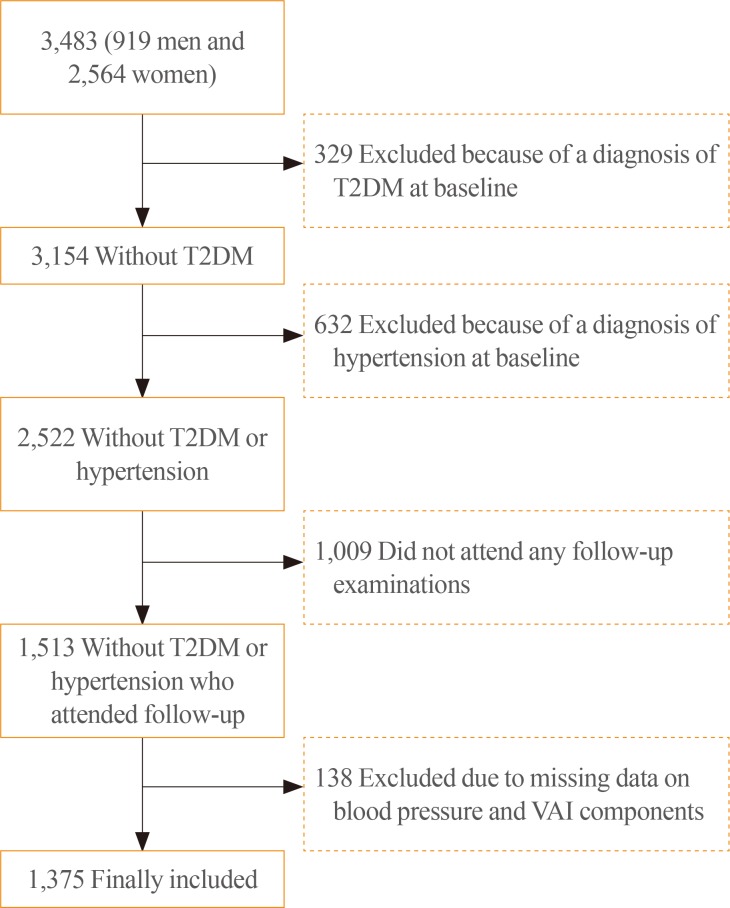
Flow diagram of inclusion and exclusion criteria in the Isfahan Diabetes Prevention Study. A total of 1,375 individuals were included in this study. T2DM, type 2 diabetes mellitus; VAI, visceral adiposity index.
Measurements
At baseline and at follow-up visits, data on age, sex, BMI, hemoglobin A1c (HbA1c), total cholesterol (TC), low density lipoprotein cholesterol (LDL-C), HDL-C, TG, BP, and family and personal medical history were collected. The same methodology was used at baseline and at follow-up visits. The participants were the siblings and children of patients with T2DM. They were requested to refrain from intense exercise the evening before and the morning of their visit when they reported to clinic in the morning after an overnight fast. Smokers were asked to refrain from smoking on the morning of the investigations.
First, after the participants arrived at the clinic, the data provided by the participants in the questionnaire on family history were checked. Then, height, weight, WC, and hip circumference (HC) were assessed without shoes or heavy clothing using standard devices, and recorded to the nearest 0.1 kg and 0.5 cm. The WC was determined midway between the lower rib margin and the iliac-crest at the end of gentle expiration in the upright position. HC was determined over the greater trochanters directly over the underwear. BMI was calculated as weight (kg) divided by height squared (m2). Resting systolic (phase I) and diastolic (phase V) BP were recorded at each examination by a physician with the participants in a sitting position, after they had rested in this position for at least 10 minutes, using a mercury column sphygmomanometer and appropriately sized cuffs. A blood sample was drawn between 7:00 and 9:00 AM. Fasting plasma glucose (FPG) was assessed by the glucose oxidase method. T2DM was defined as a 2-hour plasma glucose (PG) reading of ≥200 mg/dL with pharmacological treatment, or 2 FPG readings of ≥126 mg/dL [22]. Those with a FPG <126 mg/dL underwent a standard OGTT (75-g of glucose, 2 hours) at baseline and follow-up visits. Venous blood was sampled 0, 30, 60, and 120 minutes after oral glucose administration. According to the Eighth Joint National Committee guidelines [23], HTN was defined as a BP reading ≥140/90 mm Hg, or by the use of antihypertensive agents.
HbA1c, TC, TG, HDL-C, and LDL-C were recorded. LDL-C levels were estimated by the Friedewald equation [24]. Non-HDL-C was calculated by subtracting HDL-C from TC. All blood analyses were performed at the central laboratory of the Isfahan Endocrine and Metabolism Research Center on the day of blood collection using the enzyme-linked method.
Definitions
VAI was defined as follows [8]:
Men:VAI=[WC/39.68+(1.88×BMI)]×(TG/1.03)×(1.31/HDL-C)
Women:VAI=[WC/36.58+(1.89×BMI)]×(TG/0.81)×(1.52/HDL-C)
The HTGW phenotype was defined as the concurrent presence of a WC ≥102 or 88 cm in men and women, respectively, and a TG ≥150 mg/dL for both genders. Abdominal obesity was defined as the presence of a WC ≥102 or 88 cm in men and women, respectively.
Analysis
Participants were followed until the occurrence of HTN, the date of the last completed follow-up, death, or end of follow-up on March 21, 2014, whichever event occurred first. We used the date of the examination in which a new case of HTN was recognized as the date of diagnosis. Statistical methods included the following: the Student t test or the Mann-Whitney U test; one way analysis of variance (ANOVA) or the Kruskal-Wallis test for continuous variables; the chi-square test, Pearson correlation or the Spearman rank correlation; and binary logistic regression.
Differences between more than two groups were assessed using one way ANOVA with the Bonferroni post hoc test. Pearson correlation analysis or the Spearman rank correlation was used to examine the linear relationships between the VAI and other variables, holding the effect of age and gender constant. Univariate and multivariate logistic regression were used to identify predictors of new-onset HTN. We did not adjust for WC, TG, or HDL-C, which are components of the VAI and HTGW, because it was not appropriate to adjust for these variables in prediction models that already incorporated the VAI and HTGW. The VAI was re-coded into quintiles, and we compared the risk of developing HTN in each quintile with the lowest category of risk (reference group). To test the significance of HTGW as a predictor of the incidence of HTN, the incidence of HTN was calculated according to the four phenotypic groups, and we compared the risk of developing HTN in each group with the normal-waist and normal-TG group (reference group). A general linear model was used to examine the significance of trends in potential predictors of HTN across VAI quintiles and compared age-adjusted means. SPSS version 18 (SPSS Inc., Chicago, IL, USA) were used for data analysis. The reported P values are 2-tailed, and P values <0.05 were considered to indicate statistical significance.
RESULTS
Characteristics
Most of the baseline characteristics of the individuals who did not return for a follow-up visit (non-respondents), such as age, height, weight, BMI, WC, HC, WHR, waist-to-height ratio, LDL-C, TC, TG, systolic BP, and obesity, were similar to those who attended follow-up visits (data not shown). However, non-respondents had lower baseline values of FPG (95.4 mg/dL vs. 107.5 mg/dL, P<0.001); PG at 30 minutes (143.0 mg/dL vs. 155.9 mg/dL, P<0.001), 60 minutes (148.0 mg/dL vs. 165.1 mg/dL, (P<0.001), and 120 minutes (119.2 mg/dL vs. 136.1 mg/dL, P<0.001); levels of HbA1c (5.0% vs. 5.3%, P<0.001); and diastolic BP (72.0 mm Hg vs. 74.7 mm Hg, P<0.001); and higher HDL-C (46.4 mg/dL vs. 45.4 mg/dL, P<0.05) than respondents.
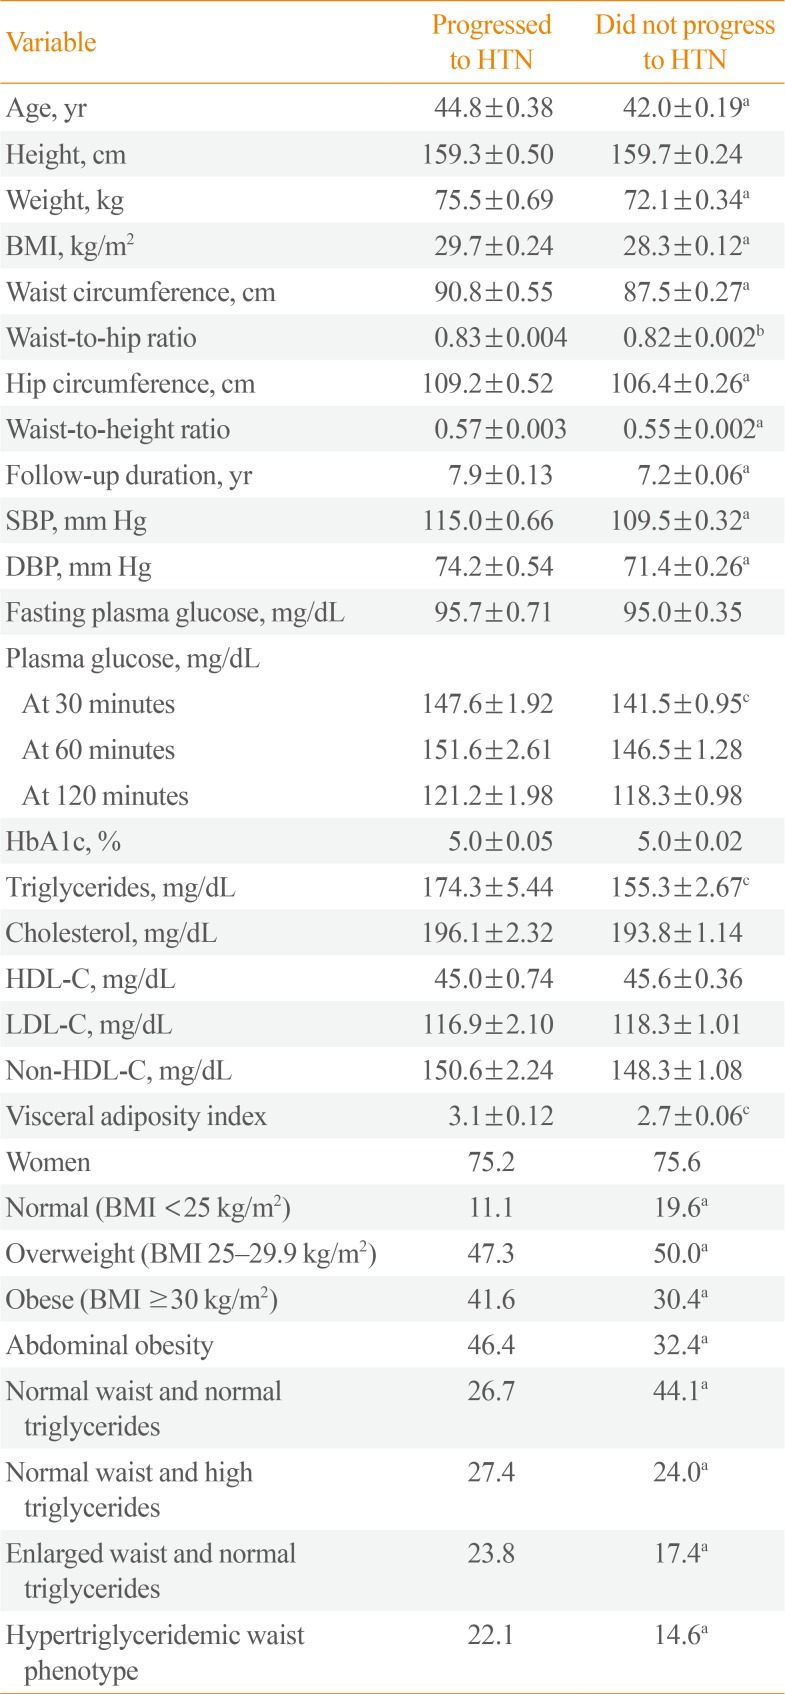
Over 9,954 person-years of follow-up, 281 (19.8%) incident cases of HTN occurred. The mean±SD VAI was 2.8±1.9. Participants on average were overweight with a mean±SD BMI of 28.6±4.1 kg/m2. Table 1 shows the baseline characteristics of the 281 participants (19.8%) who did and the 1,138 (80.2%) who did not progress to HTN. As expected, compared with participants who did not progress to HTN, those who progressed to HTN were older and had higher age-adjusted mean weight, BMI, WC, WHR, waist-to-height ratio, HC, follow-up duration, systolic and diastolic BP, PG at 30 minutes, TG, non-HDL-C, and VAI at baseline, and a higher proportion of obesity and the HTGW phenotype.

Age-Adjusted Mean±SE and Proportions of Selected Baseline Characteristics in 281 Participants Who Did Develop HTN and 1,136 Who Did Not Develop HTN
The mean±SD age was 44.8±6.9 years for those who progressed to HTN and 42.0±6.2 years for those who did not progress to HTN. The mean±SD VAI was 3.1±2.1 for those who progressed to HTN and 2.7±1.9 for those who did not progress to HTN. The HTGW phenotype was present at baseline in 22.1% of those progressed to HTN and 14.6% of those who did not.
Table 2 presents the baseline characteristics of the study participants by VAI quintile. In comparisons of the variables at baseline, all variables, except age and height, were greater in higher VAI quintiles. However, HDL-C was inversely associated with VAI quintiles.

Age and Age-Adjusted Mean±SE and Proportions of the Baseline Characteristics of Participants by Visceral Adiposity Index Quintile
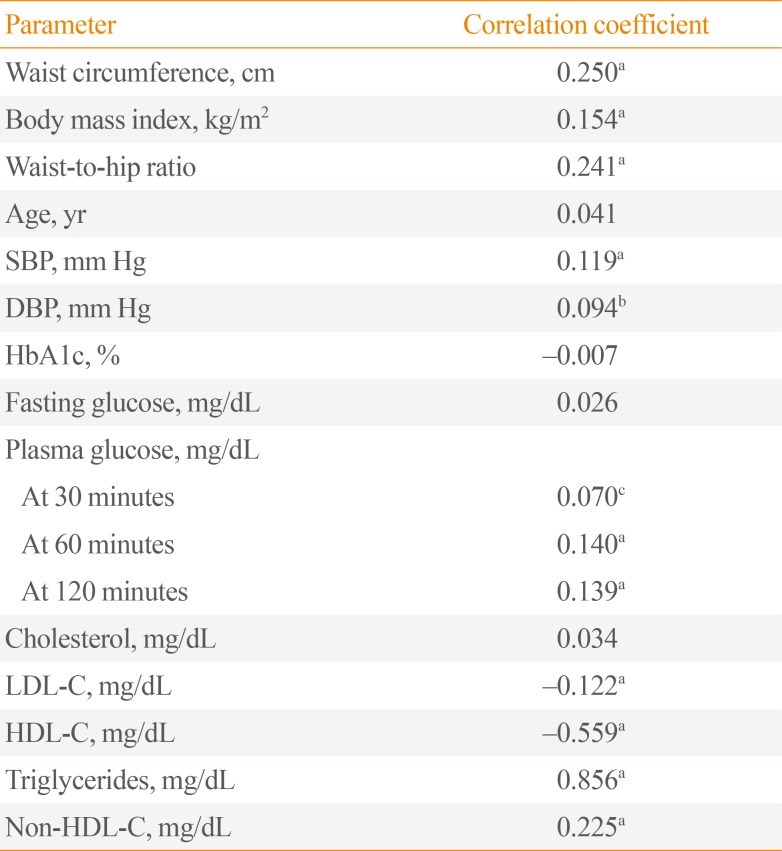
The VAI showed significant positive correlations with WC, BMI, WHR, systolic and diastolic BP, PG, TG, and non-HDL-C, and a negative correlation with LDL-C and HDL-C (Table 3).

Age- and Gender-Adjusted Correlations between the Visceral Adiposity Index and Metabolic Parameters
Incidence of HTN
The total incidence of HTN during the study was 28.2 (95% confidence interval [CI], 25.0 to 31.5) per 1,000 person-years. The incidence was lower in women (27.8; 95% CI, 24.1 to 31.5 per 1,000 person-years) than in men (29.6; 95% CI, 23.1 to 37.3), but the difference was not statistically significant.
The risk for incident HTN according to VAI quintiles
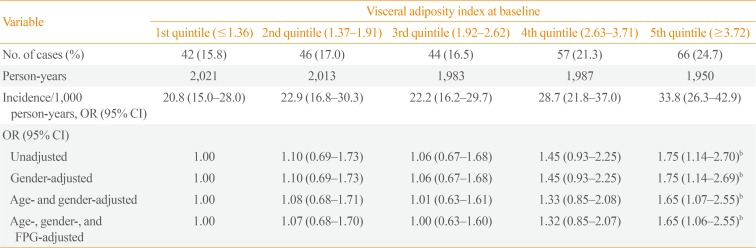
HTN incidence was 20.8 per 1,000 person-years (95% CI, 15.0 to 28.0) for participants in the lowest quintile, and 33.8 per 1,000 person-years (95% CI, 26.3 to 42.9) for those in the highest quintile. The risk of HTN was greater in higher VAI quintiles. Compared with participants in the lowest quintile, the risk of HTN was 75% greater for those in the highest quintile at baseline (odds ratio [OR], 1.75; 95% CI, 1.14 to 2.70), 45% higher for those in the fourth quintile (OR, 1.45; 95% CI, 0.93 to 2.25), 6% higher for those in the third quintile (OR, 1.06; 95% CI, 0.67 to 1.68), and 10% higher for those in the second quintile (OR, 1.10; 95% CI, 0.69 to 1.73) in unadjusted models. Controlling for gender did not alter the ORs compared to the unadjusted model. Further controlling for age and FPG did not appreciably alter the associations (Tables 4, 5).

Incidence Rates and ORa of Hypertension by Visceral Adiposity Index Quintile

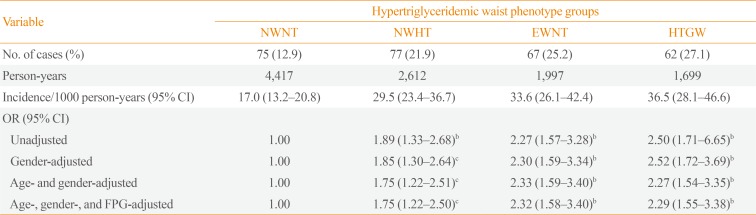
Incidence Rates and ORa of Hypertension by the Four Hypertriglyceridemic Waist Phenotype Groups, the Isfahan Diabetes Prevention Study
The risk for incident HTN according to HTGW
HTN incidence was 17.0 per 1,000 person-years (95% CI, 13.2 to 20.8) for participants in the normal-waist and normal-TG group, and 36.5 per 1,000 person-years (95% CI, 28.1 to 46.6) for those with the HTGW phenotype. Compared with participants in the normal-waist and normal-TG group, the risk of HTN was 75% greater in those in the normal-waist and high-TG group at baseline (OR, 1.75; 95% CI, 1.22 to 2.51), 2.3 times higher in those in the enlarged-waist and normal-TG group (OR, 2.33; 95% CI, 1.59 to 3.40), and 2.3 times higher in those with the HTGW phenotype (OR, 2.27; 95% CI, 1.54 to 3.35) in an age- and gender-adjusted model.
DISCUSSION
This study showed that a high VAI was a weak predictor of HTN independently of age and gender, while the HTGW phenotype was a stronger predictor of incident HTN in a large cohort of non-hypertensive and non-diabetic FDRs of patients with T2DM in Iran, as reflected by multivariate analysis. This result suggests that high VAI levels should be recognized as a weak risk factor for HTN. Although the VAI could be an alternative index to predict HTN, the HTGW phenotype appeared to be a stronger predictor than the VAI. Our findings are consistent with the limited number of cross-sectional studies [1213141516] and a longitudinal study [11] showing that visceral adiposity measured by CT was an independent predictor of HTN. In cross-sectional and cohort studies of Japanese-Americans [111217], visceral adiposity measured by CT, but not the abdominal subcutaneous adipose tissue, was associated with the prevalence and incidence of HTN. Boyko et al. [17], in a cross-sectional study of Japanese-Americans in 1995, demonstrated that, among individuals without T2DM and who did not take antihy-pertensive medication, visceral adiposity as measured by CT was not independently related to systolic or diastolic BP after adjusting for age, fasting plasma insulin, and BMI. In their more recent study in 2003, they reported, based on cross-sectional data from the same population, that greater visceral adiposity increased the odds of HTN independently of other measures of total or regional adiposity, fasting insulin, 2-hour PG, age, and gender [12]. Fox et al. [13] demonstrated that both visceral and subcutaneous fat volume were associated with the prevalence of HTN. In contrast, Foy et al. [14] showed a significant relationship between abdominal subcutaneous fat area, but not intra-abdominal fat area, and the prevalence of HTN among African-American and Hispanic-American men. Oka et al. [15] reported in native Japanese subjects that both visceral and subcutaneous adipose tissue were correlated with systolic and diastolic BP. Kanai et al. [18] showed that, among severely obese women in Japan, the ratio of the intra-abdominal fat area to subcutaneous fat area measured by CT was associated with BP, independently of age and BMI. In contrast, Johnson et al. [19] reported that, among individuals without diabetes or HTN, CT-measured intra-abdominal fat area was not correlated with systolic or diastolic BP. Differences in body composition by ethnicity and/or adjustments for other potentially confounding variables may partially explain these inconclusive findings.
Based on a comparison of ORs, the relationship of HTN incidence with the VAI was weaker than the relationship of incident HTN with the HTGW phenotype. Therefore, the HTGW phenotype appeared to be a stronger predictor of HTN in our study population. In our recent study in the same population, the HTGW phenotype was also associated with an increased risk of T2DM [25].
There are limitations related to this study. While the sample size is believed to have been adequate for the analysis as a whole, the follow-up rate was relatively low. However, the participants who did not complete follow-up did not differ from those who did in terms of major risk factors for the development of HTN, except for FPG. We do not believe that there was a high likelihood for bias due to differential loss to follow-up. Regarding our definition of HTN incidence, some selection bias may have been present, as participants who attended screenings may have been more likely to be tested and consequently diagnosed as having HTN. Thus, participants with HTN who were at a lower risk may have been missed through lack of testing. Because our definition of HTN was based on a BP measurement at a single visit, it is possible that measurement error existed regarding the presence or absence of HTN. We did not consider gender-specific analyses because there were an insufficient number of events in some subgroups to calculate stable risk estimates, although we used gender as an adjustment factor in all analyses. The current findings were drawn from an Iranian population composed of FDRs of patients with T2DM and the results may therefore not be applicable to all populations. Residual confounders could not be eliminated, increasing the possibility that uncontrolled or inadequately measured confounders affected our results. It is thus necessary to validate the associations of the VAI and the HTGW phenotype with incident HTN in other populations and/or with more data.
In conclusion, the VAI and the HTGW phenotypes were found to be predictors of HTN in high-risk individuals in Iran, and the HTGW phenotype showed a stronger predictive power. The role of visceral adiposity in the pathogenesis of HTN requires more investigation.
ACKNOWLEDGMENTS
We thank Mr. M. Abyar for technical and computer assistance and all the participating FDRs. This study was partly funded by the Isfahan Endocrine and Metabolism Research Center, Iran.
Notes
CONFLICTS OF INTEREST: No potential conflict of interest relevant to this article was reported.