Adiposity in the Relationship between Serum Vitamin D Level and Insulin Resistance in Middle-Aged and Elderly Korean Adults: The Korea National Health and Nutrition Examination Survey 2008
Article information
Abstract
Background
The role of adiposity in the relationship between serum vitamin D levels and insulin resistance has not yet been fully studied. This aim of this study is to clarify the role of adiposity in the relationship between serum vitamin D level and insulin resistance among middle-aged and elderly Korean adults.
Methods
We used data from 2,710 individuals aged ≥50 years based on national data from a representative sample of the fourth Korea National Health and Nutrition Examination Survey IV-2 in 2008.
Results
After adjustment for potential confounders, body mass index (BMI) was significantly associated with 25(OH) vitamin D (P=0.008). However, waist circumference was not significantly associated with 25(OH) vitamin D. In the stratified analyses, 25(OH) vitamin D was found to be negatively associated with fasting insulin and homeostasis model assessment estimate of insulin resistance (HOMA-IR) in participants with BMIs ≥25 kg/m2 (P=0.003 for both insulin and HOMR-IR) but was not found to be associated in those with BMIs <23 kg/m2. However, we observed a significant inverse in the association of 25(OH) vitamin D with fasting insulin and HOMA-IR in both the normal (P=0.001 and P<0.001 and the abdominally obese group (P=0.010 and P=0.009) in the stratified analyses according to abdominal obesity.
Conclusion
Our results support that the idea that endogenously-produced vitamin D might be stored in subcutaneous fat deposits. In addition, the association of vitamin D with insulin resistance in middle-aged and elderly Korean adults was stronger when it was stratified by BMI than when abdominal obesity status.
INTRODUCTION
Recently, concerns have been raised regarding vitamin D deficiency, which is now recognized as affecting more than half of the world's population. This problem is especially relevant in South Korea, where the prevalence of vitamin D insufficiency (defined as levels <75 nmol/L or <30 ng/mL) in postmenopausal women has been reported to be approximately 90% [1,2].
Traditionally, vitamin D has been primarily associated with bone and calcium metabolism. However, vitamin D receptors are founded in several tissues, including the gut, adipose tissues, cardiac and skeletal muscles, and β-cells [3]. This discovery has provided new insights into the nonskeletal functions of this vitamin. A number of studies have suggested that vitamin D deficiency may be related to circulating glucose, insulin concentrations, and insulin sensitivity [4-6]. In addition, vitamin D deficiency is suspected to be a risk factor for metabolic syndrome [7].
Although numerous studies have supported an association between 25-hydroxyvitamin D (25[OH] vitamin D) and insulin resistance, this association may differ based on obesity status. In Hypponen and Power's study [8], it was demonstrated that there was a stronger association between 25(OH) vitamin D and glucose homeostasis, as measured by hemoglobin A1c, in British adults with high body mass indexes (BMIs) compared with individuals with lower BMIs. This result may be due to the decreased bioavailability of 25(OH) vitamin D when it is stored in adipose tissue. In a recently published study on the results from the National Health and Nutrition Examination Survey (NHANES) 2001 to 2006, there was a strong interaction between abdominal obesity and insufficient 25(OH) vitamin D with regards to insulin resistance [9].
However, the role of adiposity in the relationship between serum vitamin D levels and insulin resistance has not yet been fully studied. The aim of our study was to clarify the role of adiposity in the relationship between serum vitamin D levels and insulin resistance among middle-aged and elderly Korean adults by analyzing the fourth Korean National Health and Nutrition Examination Survey (KNHANES) IV-2 performed in 2008.
METHODS
Patients
We analyzed the participants of the second year (2008) of KNHANES IV. KNHANES was initiated in 1998 and was designed to assess the health and nutritional status of adults and children over 1 year of age [10]. Specifically, KNHANES targeted the noninstitutionalized civilian Korean population. The KNHANES IV was a cross-sectional and nationally-representative survey conducted by the Division of Chronic Disease Surveillance, Korea Centers for Disease Control and Prevention from 2007 to 2009. The data collected consisted of a health interview survey, a health examination survey, and a nutrition survey. A detailed description of the sampling method used was published in the 2007 KNHANES [11]. In this survey, 12,528 individuals in 4,600 households were sampled, with 9,308 of them participating in the health interviews and health examination surveys, and 8,641 participating in the nutrition surveys. Among those who participated in the survey between February 2008 and December 2008, serum 25(OH) D levels were obtained in 3,047 males and 3,878 females aged 10 years and older from all 16 administrative districts of South Korea. The present study was restricted to participants over 50 years of age who completed the health examination survey and had their serum 25(OH) vitamin D levels measured (n=2,710). This study analyzed publicly available data sets and was therefore exempted from institutional review board approval.
Anthropometric and clinical measurements
In the KNHANES, the patients' body heights, body weights, and waist circumferences (WCs) were measured by a specially trained examiner. We calculated BMI by dividing weight in kilograms by height in square meters (kg/m2). BMI was used to categorize the participants as normal weight (BMI <23.0 kg/m2), overweight (BMI ≥23 and <25 kg/m2), or obese (BMI ≥25 kg/m2). We also categorized patients as abdominally obese if their WC was over 90 cm (in women, the cutoff was 85 cm) [12]. We categorized patients as normal if their WC was under 90 cm for men and under 85 cm for women.
Biochemical measurements
Blood samples were obtained after a minimum fasting time of 8 hours. Blood samples were collected from each participant during the survey and were processed, immediately refrigerated, and transported in cold storage to the Central Testing Institute in Seoul, Korea. Serum 25(OH) D concentration was measured by RIA (DiaSorin Inc., Stillwater, MN, USA) using a γ-counter (1470 Wizard, PerkinElmer, Turku, Finland). The interassay coefficients of variation were 11.7%, 10.5%, 8.6%, and 12.5% at 8.6, 22.7, 33.0, and 49.0 ng/mL, respectively. The serum levels of total cholesterol (TC), triglycerides, high density lipoprotein cholesterol (HDL-C), aspartate aminotransferase, and alanine aminotransferase (ALT) were measured enzymatically using a Hitachi Automatic Analyzer 7600 (Hitachi, Tokyo, Japan). Insulin concentration was measured by immunoradiometry (INS-IRMA, Bio-Source, Nivelles, Belgium). The homeostasis model assessment estimate of insulin resistance (HOMA-IR) was calculated using the following formula: HOMA-IR=fasting plasma glucose (mmol/L)×fasting insulin (mIU/L)/22.5 [13].
Measurement of lifestyle-related and metabolic parameters
The measurement of lifestyle-related and metabolic parameters was conducted via interviews by trained interviewers. Patients were categorized by smoking status as current smokers, past smokers, or nonsmokers. We also categorized participants based on their alcohol consumption as drinkers or nondrinkers based on questions about their drinking behavior. We used the International Diabetes Federation (IDF) criteria for metabolic syndrome [14]. The classification of metabolic syndrome included the presence of central obesity (>90 cm in men, and >85 cm in women, based on the recommendation of the Korean Society for the Study of Obesity [12]), in addition to any two of the following four risk factors: hypertension ≥130/≥85 mm Hg or treatment of previously diagnosed hypertension, triglyceride levels ≥150 mg/dL (1.7 mmol/L), low HDL-C: in men <40 mg/dL (1.03 mmol/L) and in women <50 mg/dL (1.29 mmol/L), and fasting plasma glucose ≥100 mg/dL (5.6 mmol/L), a history of diabetes mellitus, or currently taking antidiabetic medications.
Statistical analysis
Statistical analyses were performed using SPSS version 15.0 (SPSS Inc., Chicago, IL, USA). The data are presented as means±SD unless stated otherwise. Categorical variables are reported as frequencies and proportions. An independent two-sample t test was used to compare two independent groups. The Pearson's chi-squared test was employed to analyze categorical data, as appropriate. The distributions of the continuous variables were examined for skewness and kurtosis, and the logarithm-transformed values of the nonnormally distributed variables were used for comparison between the two groups. We performed multiple regression analysis to investigate the association between serum 25(OH) vitamin D and several variables (BMI, WC, fasting insulin, and HOMA-IR) after adjusting for age, sex, education, physical activity, smoking, alcohol consumption, and history of cardiometabolic disorders. Analyses were also conducted after the subjects were stratified by obesity to identify the association between serum 25(OH) vitamin D and insulin resistance when considering obesity status. All P values were two-tailed and results were considered statistically significant if the P values were <0.05.
RESULTS
Patient characteristics
The cross-sectional analyses included data on 2,710 participants (1,119 men and 1,591 women), aged ≥50 years. The mean age of the study participants was 63.8±9.2. Table 1 shows the characteristics of the study participants according to their obesity status (nonobese, BMI <25 kg/m2; obese, BMI ≥25 kg/m2). In comparison with the nonobese group, the obese group had a higher systolic blood pressure, diastolic blood pressure, TC, triglyceride, and ALT levels. The fasting glucose, insulin, and HOMA-IR of the obese group were all significantly higher than the nonobese group. Metabolic syndrome, as defined by IDF criteria, was more frequently observed in the obese group (59.5% vs. 11.2%, P<0.001). The mean serum 25(OH) Vitamin D level in the obese group was 51.3±18.6 nmol/L, significantly lower than that of the nonobese group (53.3±20.5 nmol/L, P=0.009).

Characteristics of the Participants according to Their Obesity Status
Associations of obesity variables with 25(OH) vitamin D
After adjusting for age and sex, BMI was found to be inversely associated with 25(OH) vitamin D levels (P=0.002) (model 1 in Table 2). However, WC was not significantly associated with 25(OH) vitamin D levels (P=0.123). After adjusting for education, physical activity, smoking, alcohol consumption, and history of cardiometabolic disorders, the associations between 25(OH) vitamin D level and BMI or WC did not change (P=0.008 and P=0.433, respectively) (model 2 in Table 2).

Associations of Obesity Variables with 25(OH) Vitamin D
Associations of 25(OH) vitamin D with insulin resistance according to BMI
In the stratified analyses, we adjusted the regression coefficients of 25(OH) vitamin D with insulin resistance according to BMI (BMI <23 kg/m2 [n=1,043], BMI ≥23 and <25 kg/m2 [n=700], and BMI ≥25 kg/m2 [n=700]). After adjusting for age and sex, serum 25(OH) vitamin D was found to be inversely associated with fasting insulin and HOMA-IR in all of the participants regardless of obesity status. Serum 25(OH) vitamin D was found to be statistically associated with fasting insulin and HOMA-IR in all participants except for the fasting insulin in participants with BMIs <23 kg/m2 (P=0.065) (model 1 in Table 3). After adjusting for education, physical activity, smoking, alcohol consumption, and history of cardiometabolic disorders, serum 25(OH) vitamin D was found to be negatively associated with fasting insulin and HOMA-IR in participants with BMIs ≥25 kg/m2 (P=0.003 for both insulin and HOMR-IR) but not in those with BMI <23 kg/m2 (P=0.158 and P=0.069 for insulin and HOMA-IR, respectively) (model in Table 3).

Adjusted Regression Coefficients of 25(OH) Vitamin D with Insulin Resistance according to BMI
Associations of 25(OH) vitamin D with insulin resistance according to abdominal obesity
We also evaluated the regression analysis between serum 25(OH) vitamin D and insulin resistance, as stratified by abdominal obesity. The participant's abdominal obesity status was categorized as normal (n=1,163) or obese (n=1.047) (WC ≥90 cm for men, ≥85 cm for women). After adjusting for age and sex, 25(OH) vitamin D was statistically associated with fasting insulin and HOMA-IR in both the normal and abdominally obese group (P<0.001 for both fasting insulin and HOMA-IR in the normal group, P=0.002 and P=0.001 for fasting insulin and HOMA-IR in the abdominally obese group) (model in Table 4). After adjusting for education, physical activity, smoking, alcohol consumption, and history of cardiometabolic disorders, the correlations did not change in both groups (P=0.001 and P<0.001 for fasting insulin and HOMA-IR in the normal group, P=0.001 and P=0.009 for fasting insulin and HOMA-IR in the abdominally obese group) (model in Table 4).
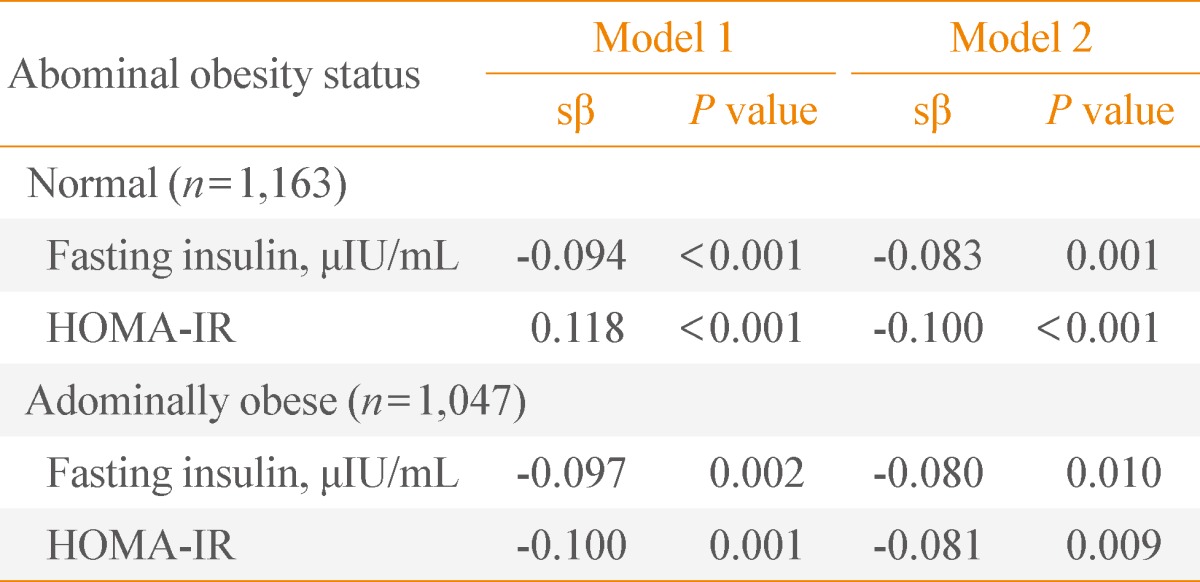
Adjusted Regression Coefficients of 25(OH) Vitamin D with Insulin Resistance according to Abdominal Obesity
DISCUSSION
In our study, we found a statistically significant inverse association between serum 25(OH) vitamin D and BMI, but not between serum 25(OH) vitamin D and WC in middle-aged and elderly Korean adults. In the stratified analyses with BMI, 25(OH) vitamin D was negatively associated with insulin resistance in subjects that were overweight and obese, but not in those with normal weight. The significant inverse associations between 25(OH) vitamin D and insulin resistance were observed in both the normal WC group and the abdominally obese group in the stratified analyses according to abdominal obesity.
Numerous studies have reported an inverse association between 25(OH) vitamin D and insulin resistance [4-6]. A recently published Korean study found that decreasing serum 25(OH) vitamin D levels was associated with increasing insulin resistance [15]. Many previous studies have also shown the association between low 25(OH) vitamin D and obesity [16-21]. However, there have not been many studies that have reported an association between 25(OH) vitamin D and insulin resistance according to obesity status. The role of adiposity in the relationship between serum vitamin D level and insulin resistance has not yet been fully studied.
In one British trial, the authors found that body size was a strong determinant for the association between vitamin D and glucose metabolism [8]. Ou et al. [22] reported that there was a stronger association between serum 25(OH) vitamin D and insulin sensitivity in overweight individuals than in normal weight individuals. Another cross sectional study based on the NHANES 2001 to 2006 showed that overweight and obese participants had a significantly higher risk of insulin resistance compared with the reference group [9]. In addition, obese individuals with insufficient vitamin D had a 32-times higher risk for insulin resistance compared to those who are nonobese, which was much higher than the 20-fold increase in risk among obese individuals with sufficient 25(OH) vitamin D.
These results are comparable with our study on the role of adiposity in the relationship between serum vitamin D level and insulin resistance among middle-aged and elderly Korean adults. Our results comparing 25(OH) vitamin D with fasting insulin and HOMA-IR (a marker of insulin resistance) with respect to BMI showed that 25(OH) vitamin D was inversely associated with insulin resistance in subjects with BMIs ≥25 kg/m2.
The deficiency of vitamin D is thought to be a risk factor in the development of insulin resistance. 25(OH) vitamin D improves both β-cell function and the insulin sensitivity of target cells (liver, skeletal muscle, and adipose tissue). In addition, it protects β-cells from harmful immune attacks [23]. In obese individuals, lower levels of circulating 25(OH) vitamin D could be due to greater sequestration in adipose tissue, reducing its availability [24]. This issue could be particularly prominent in obesity and the lower bioavailability of vitamin D could in turn affect pancreatic β-cell function and the vitamin D receptor.
Our study also showed a significant inverse association between 25(OH) vitamin D and fasting insulin and HOMA-IR in both the normal and the abdominally obese group in the stratified analyses according to abdominal obesity. In our study, the association of 25(OH) vitamin D with insulin resistance was stronger when it was stratified by BMI than when it was stratified by abdominal obesity. This result is not in agreement with previous studies that found that abdominal adiposity, as measured by WC, was a more precise predictor of insulin resistance, with BMI serving as a surrogate measure of total body adiposity [25].
This discrepancy could be explained by several reasons. One recent study by Wortsman et al. [24] suggested that the subcutaneous fat, which is known to store vitamin D, sequestered more of the cutaneous synthesized vitamin D3 in the obese than in the nonobese subjects because there was more fat available for this process. This idea is supported by Snijder et al. [18], who found that leg fat was more strongly related with 25(OH) vitamin D levels than trunk fat. Although BMI and WC independently contribute to the prediction of subcutaneous fat, BMI is more predictive of subcutaneous fat than WC alone [26]. Because obese people have a larger body surface area, they present with a decreased release of endogenously-produced vitamin D in the circulation owing because of the vitamin's increased storage in subcutaneous fat [24]. The calculated BMI is more reflective of subcutaneous fat than WC, and can be a surrogate for visceral fat. One study on the relationship of low serum vitamin D3 with anthropometry in obesity showed a similar relationship between BMI and WC with vitamin D3. The authors explained that the different mechanisms relating hypovitaminosis D3 to obesity occur concurrently [16]. Further investigation is needed on the relationship between 25(OH) vitamin D and adiposity, as measured by both WC and BMI.
Our study has several limitations. First, we did not explore the role of serum parathyroid hormone (PTH), which is an important determinant of serum vitamin D levels. Increased PTH promotes calcium influx into adipocytes, where intracellular calcium enhances lipogenesis [18]. PTH excess may also promote weight gain. Therefore, the association between vitamin D and obesity could change depending on serum PTH. However, the effects of PTH levels on insulin resistance have been controversial. Second, we did not estimate the participant's vitamin D levels at the same point in time. Even after adjusting for physical activity, vitamin D has seasonal variations. We also did not obtain the dietary vitamin D intake.
In conclusion, our results support the idea that endogenously-produced vitamin D might be preferentially stored in subcutaneous fat deposits. In addition, low 25(OH) vitamin D levels was associated with increased insulin resistance in middle-aged and elderly Korean adults, especially among those who were overweight or obese.
ACKNOWLEDGMENTS
This work was supported by a clinical research grant from Pusan National University Hospital (2013).
Notes
No potential conflict of interest relevant to this article was reported.