Articles
- Page Path
- HOME > Endocrinol Metab > Volume 36(6); 2021 > Article
-
Review ArticleMiscellaneous Quality Matters as Much as Quantity of Skeletal Muscle: Clinical Implications of Myosteatosis in Cardiometabolic Health
-
Hong-Kyu Kim1*
 , Chul-Hee Kim2*
 -
Endocrinology and Metabolism 2021;36(6):1161-1174.
DOI: https://doi.org/10.3803/EnM.2021.1348
Published online: December 28, 2021
1Subdivision of Endocrinology and Metabolism, Health Screening and Promotion Center, Asan Medical Center, Seoul, Korea
2Division of Endocrinology and Metabolism, Department of Internal Medicine, Soonchunhyang University Bucheon Hospital, Soonchunhyang University College of Medicine, Bucheon, Korea
- Corresponding authors: Hong-Kyu Kim. Subdivision of Endocrinology and Metabolism, Health Screening and Promotion Center, Asan Medical Center, 88 Olympic-ro 43-gil, Songpa-gu, Seoul 05505, Korea Tel: +82-2-3010-4802, Fax: +82-2-3010-4917, E-mail: hkkim0801@amc.seoul.kr
- Chul-Hee Kim. Division of Endocrinology and Metabolism, Department of Internal Medicine, Soonchunhyang University Bucheon Hospital, Soonchunhyang University College of Medicine, 170 Jomaru-ro, Wonmi-gu, Bucheon 14584, Korea Tel: +82-32-621-5155, Fax: +82-32-621-5018, E-mail: chkimem@sch.ac.kr
- *These authors contributed equally to this work.
• Received: November 29, 2021 • Revised: December 5, 2021 • Accepted: December 13, 2021
Copyright © 2021 Korean Endocrine Society
This is an Open Access article distributed under the terms of the Creative Commons Attribution Non-Commercial License (http://creativecommons.org/licenses/by-nc/4.0/) which permits unrestricted non-commercial use, distribution, and reproduction in any medium, provided the original work is properly cited.
ABSTRACT
- Although age-related changes in skeletal muscles are closely associated with decreases in muscle strength and functional decline, their associations with cardiometabolic diseases in the literature are inconsistent. Such inconsistency could be explained by the fact that muscle quality—which is closely associated with fatty infiltration of the muscle (i.e., myosteatosis)—is as important as muscle quantity in cardiometabolic health. However, muscle quality has been less explored compared with muscle mass. Moreover, the standard definition of myosteatosis and its assessment methods have not been established yet. Recently, some techniques using single axial computed tomography (CT) images have been introduced and utilized in many studies, as the mass and quality of abdominal muscles could be measured opportunistically on abdominal CT scans obtained during routine clinical care. Yet, the mechanisms by which myosteatosis affect metabolic and cardiovascular health remain largely unknown. In this review, we explore the recent advances in the assessment of myosteatosis and its changes associated with aging. We also review the recent literature on the clinical implication of myosteatosis by focusing on metabolic and cardiovascular diseases. Finally, we discuss the challenges and unanswered questions that need addressing to set myosteatosis as a therapeutic target for the prevention or treatment of cardiometabolic diseases.
- Skeletal muscle is the largest organ in our body, comprising 30% to 40% of the total body mass, and thus plays an important role in health and aging. Although the loss of muscle mass is closely associated with the decline in muscle strength in aging, the decline of muscle strength is known to be much more rapid than the concomitant loss of muscle mass [1]. In addition, sarcopenia is now considered a muscle disease (muscle failure), with low muscle strength overtaking the role of low muscle mass as a principal determinant [2]. Meanwhile, there has been much controversy about the associations between skeletal muscle mass and clinical outcomes such as metabolic health, subclinical or clinical cardiovascular disease, and mortality; such dissonance could be explained by the deterioration of skeletal muscle quality associated with myosteatosis, which may induce proinflammatory changes in adipose tissues infiltrating the muscles [3]. Therefore, myosteatosis has emerged as an important concept in the field of sarcopenia in both clinical practice and research. However, there is a lack of international agreements on its standard definition, method for assessment, and clinical outcomes including cardiometabolic diseases.
- In this review, we will discuss the recent development in the assessment methods and clinical implications of myosteatosis. The various assessment methods for myosteatosis will be compared and a novel index of good quality muscle for representing myosteatosis will be introduced. This review also includes age-related changes of muscle components in men and women to gain a better understanding of the aging of skeletal muscles. Then, we will review the clinical studies about the association between muscle quality or myosteatosis and various clinical outcomes including metabolic health, cardiovascular disease, muscular and mobility dysfunction, and mortality. At the end of the review, we will briefly explore the areas that should be investigated in future research including potential mechanisms and intervention methods for myosteatosis.
INTRODUCTION
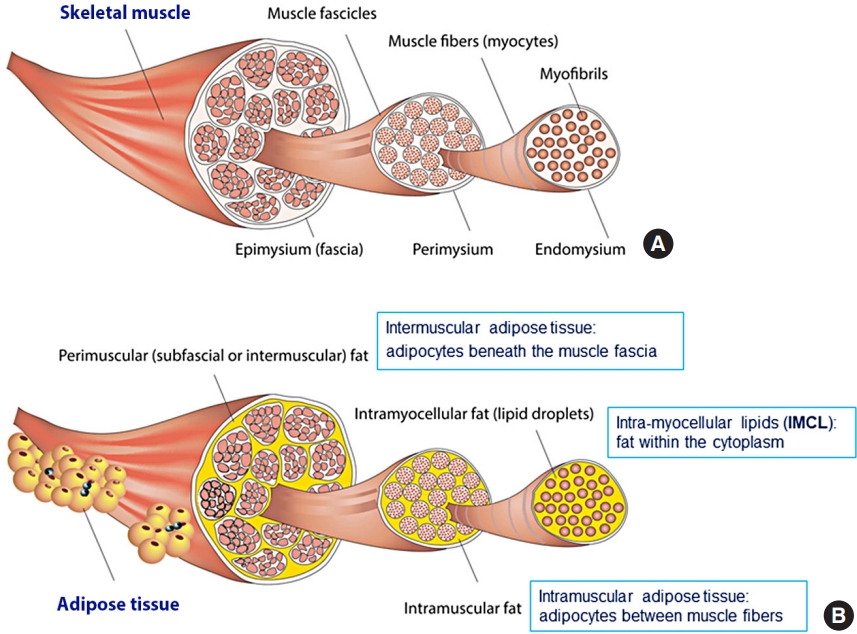
- The term “myosteatosis” has been traditionally used to describe three different adipose depots found in the skeletal muscle including: (1) intermuscular adipose tissue, the extracellular adipose tissue found beneath the fascia and in-between muscle groups; (2) intramuscular adipose tissue, the extracellular adipose tissue found within individual muscle fascicles; and (3) intramyocellular lipids (IMCL) [4]. These are illustrated in detail in Fig. 1 [5].
COMPONENTS OF MYOSTEATOSIS
- Although muscle biopsy is considered to be a standard method for the assessment of myosteatosis, its invasiveness hinders a widespread application in clinical practice [6]. Therefore, imaging techniques such as computed tomography (CT) or magnetic resonance imaging offer several advantages including application in a larger sample and possibility for repeated measurements. CT measurements will be mainly discussed in this review because it is the most commonly used method in current studies.
- Measurement of the mean attenuation density (Hounsfield unit) and intermuscular adipose tissue by CT scan
- Many researchers have sought to develop a proper muscle quality index for the assessment of myosteatosis with CT measurements [7-9], most of which have used the average muscle density (Hounsfield unit [HU]) [6,10-15] and/or inter and intramuscular adipose tissue area (IMAT) [16-20] measured by CT scan. The mean attenuation of muscles measured by non-enhanced CT reflects the lipid content determined by biochemical and histological analysis, such that a lower mean muscle attenuation reflects a higher lipid content [6]. However, many clinical studies used enhanced CT scans or did not disclose CT contrast enhancement, even though muscle attenuation on CT images is influenced by contrast enhancement [7]. Therefore, the average muscle density has some limitations for the comparison of data among different institutions using various different CT protocols.
- IMAT as a muscle quality index has been measured in the mid-thigh [17,18] or abdominal muscles [19,20] in previous studies [16]. This includes the visible storage of lipids in adipocytes located between the muscle fibers (also referred to as intramuscular fat) and between muscle groups (intermuscular fat) [16,21]. IMAT is known to be positively associated with insulin resistance and an increased risk of developing type 2 diabetes [12,13,22], loss of strength and mobility with aging [14,23], and poor oncologic outcomes [9]. However, the proportion of IMAT is only approximately 8% of total muscle area and is thus too small to effectively assess the entire trunk or the thigh muscle [24]. In another study, the proportion of IMAT in men and women was 3.3% and 4.8% of total trunk muscle area, respectively [22]. Thus, IMAT could have led to an underestimation of the differences in myosteatosis between individuals.
- Different qualities of skeletal muscle areas by CT scan on L3 vertebral level
- Several studies showed that a single scan at the level of L3 is the best compromise method for assessing the total tissue volumes of skeletal muscle [25] and has the benefit of being less susceptible to measurement errors that will be averaged out [26]. In addition, the revised European Working Group on Sarcopenia in Older People (EWGSOP) also stated in 2018 that the total abdominal muscle measurement at the level of L3 vertebral body might be the preferred option [2], as it could be measured opportunistically without additional cost or radiation exposure by using the clinical abdominal CT scans obtained during routine care. Maltais et al. [27] reported that the trunk muscle measurements showed good associations with body composition and insulin resistance, similar to the association shown in the mid-thigh muscles; the author also suggested that trunk muscles could offer an alternative for the assessment of muscle quality comparable to additional mid-thigh CT scans.
- The total muscle area measured by CT scan can be divided into the areas of good quality healthy muscle (normal attenuation muscle area [NAMA]) and the areas of poor quality unhealthy muscle (low attenuation muscle area [LAMA]) [8,16, 24]. NAMA represents an area where little fatty infiltration occurs, and LAMA is an area where high levels of adipocytes and intramyocellular fat are found within muscle fibers and myocytes, and thus shows a decreased density on CT scans [8,16,24]. LAMA, which is mainly measured in the mid-thigh level, was shown to be related to deficits in physical functioning, altered metabolism, and poor physical and metabolic prognosis in previous studies [16,24,28]. LAMA and/or NAMA in trunk muscles were associated with glucose tolerance [27] and metabolic syndrome [29].
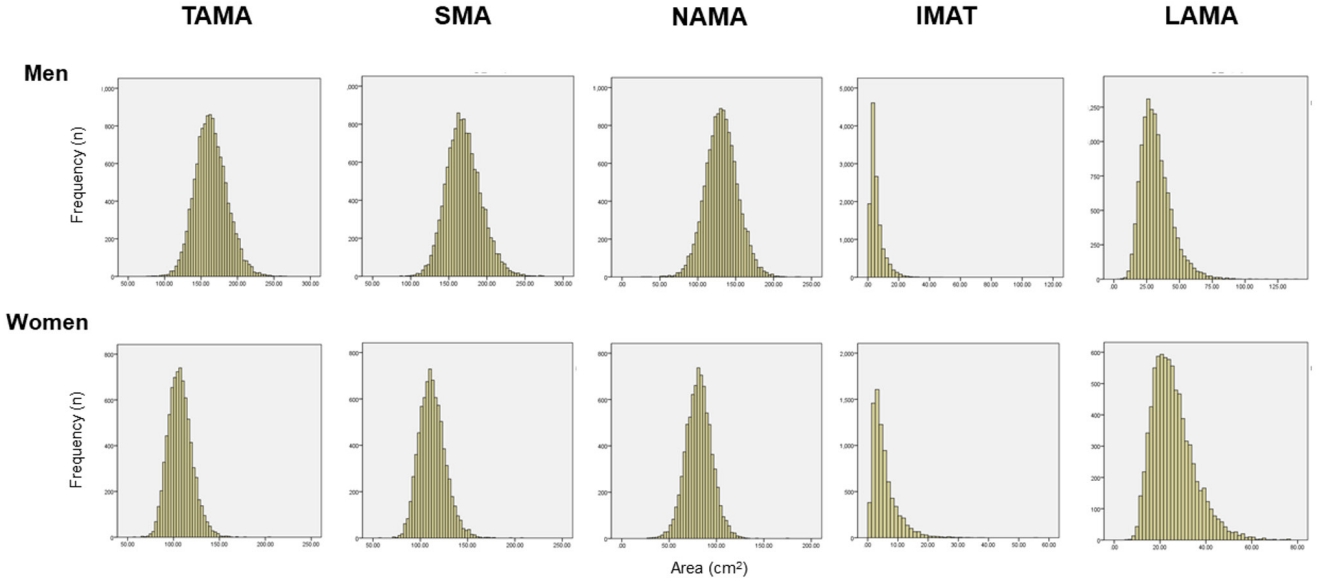
- The total abdominal muscle area (TAMA) in axial CT images can be segmented into three areas according to the CT density [16] and colored differently for clear visual representation (Fig. 2) [22]. Fig. 3 shows the histograms of each variable. While NAMA shows a normal distribution, IMAT and LAMA, which have high fat contents, show a left-side skewed distribution.
- NAMA/TAMA index calculated by CT measurements
- The NAMA/TAMA index, which is calculated by dividing NAMA by TAMA and multiplying by 100, was newly proposed by Kim et al. [22]. It is known that contrast-enhancement affects the skeletal muscle density (HU), but not skeletal muscle mass or area [30,31]. The influence of CT contrast enhancement could be negligible for NAMA/TAMA index, because it is a ratio of two measurements taken in the same condition [22]. Thus, the NAMA/TAMA index might be a stable and representative index of good-quality muscle for the assessment of myosteatosis, which is a critical feature for clinical use.
- Other methods for the assessment of myosteatosis
- 1H Magnetic resonance spectroscopy (MRS) is a spectroscopic technique that identifies the proton resonances of the methylene (CH2) and methyl (CH3) groups of extramyocellular lipid (EMCL) stored in adipocytes and IMCL stored in spherical droplets in the myoplasm [32,33]. MRS may be advantageous over CT because it distinguishes between IMCL and EMCL and does not involve the hazard of radiation. The ability to distinguish the fat storage inside compared with outside the muscle may be an important advantage, because recent MRS studies have suggested that IMCL rather than EMCL influences insulin resistance [33]. One study showed that IMCL stores, rather than EMCL stores, measured by MRS better reflect muscle attenuation as measured by CT especially in the soleus but not in the tibialis anterior muscle [34]. However, while CT scans can be obtained opportunistically in clinical practice, MRS is only suitable for researchers and not for clinical use due to its high cost and time-intensive process.
- Peripheral quantitative computed tomography (pQCT) had been used in several population studies [35,36], and has shown benefits of lower cost, lower radiation dose, and portability; however, pQCT has limitations in terms of the area of measurement such as lower leg or arm, and cannot clearly differentiate the individual muscle groups [4]. Qualitative ultrasound could measure the muscle thickness and echogenicity that reflect myosteatosis [37]. It has many benefits such as low cost, no radiation hazard, and portability, but has limitations such as inter-machinery and inter-operator variability and lack of a standardized approach for assessing myosteatosis [4]. Therefore, further studies are needed to set up the measurement standard for research and clinical use. The comparisons of various modalities for myosteatosis assessment are summarized in Table 1.
- The D3-creatine dilution method has been introduced as a direct and accurate measurement of the total body creatine pool size and skeletal muscle mass [38]. Recent studies reported that in older men, muscle mass assessed by D3-creatine dilution is more strongly related to physical performance and adverse health outcomes than lean mass measured by dual-energy X-ray absorptiometry (DXA) [39,40]. Thus, D3-creatine-measured muscle mass may reflect net muscle mass excluding infiltrating fat.
ASSESSMENT OF MYOSTEATOSIS
- Age-related distributions of different CT measurements
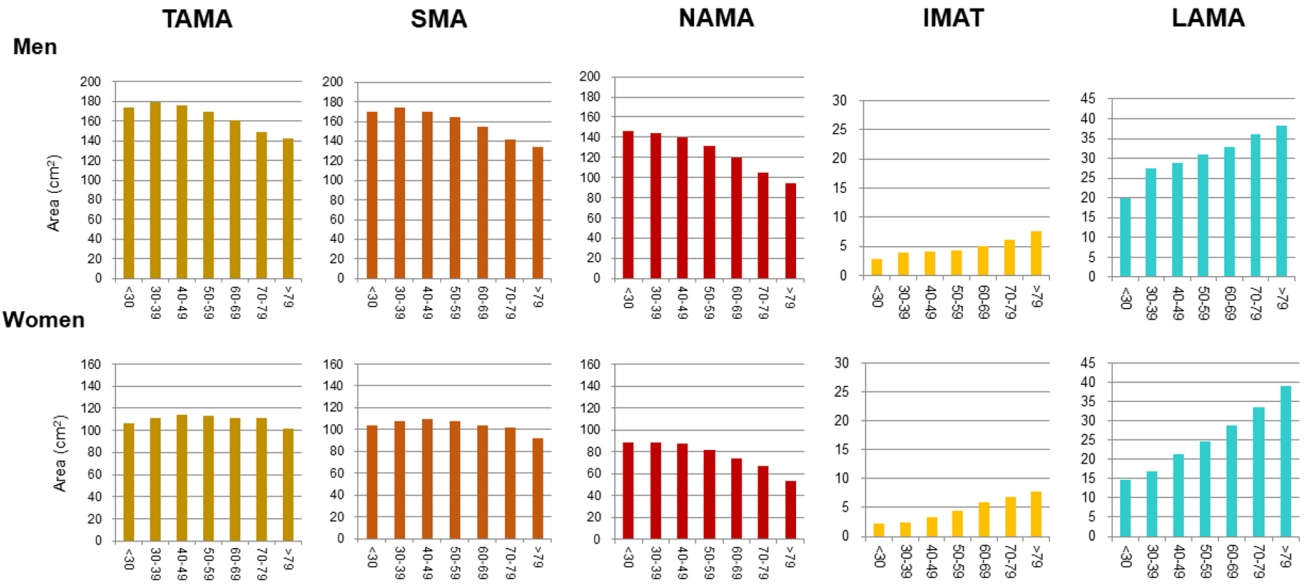
- In addition to the loss of muscle mass and strength, aging also leads to the redistribution of adipose tissue, through which subcutaneous adipose tissue relocates to more detrimental locations (e.g., intramuscular and intermuscular adipose tissues and fatty liver) [16]. Previous longitudinal studies [41,42] have shown that IMAT increases according to age. Especially, Delmonico et al. [42] reported that aging is associated with an increase in IMAT regardless of changes in weight; the authors also reported that in older adults, the degree of the loss of muscle strength is greater than that of muscle mass loss, which suggests a decrease in muscle quality. To date, however, age-related distribution or changes in different quality muscles such as NAMA or LAMA have rarely been reported because most studies focused on the myosteatosis itself. One study showed a negative association between the NAMAs and age [27], and a recent study [22] reported that NAMA decreased and LAMA and IMAT increased according to increasing age in both sexes despite showing different peak age groups in terms of total skeletal muscle area in men and women (Fig. 4).
- Diagnostic cutoff and prevalence of myosteatosis using CT indices
- Unlike the cutoff points for sarcopenia, the cutoff points for myosteatosis were mainly studied in oncologic fields [9], most of which used the cutoff points of muscle attenuation <41 HU with BMI <25 kg/m2 or muscle attenuation <33 HU with BMI ≥25 kg/m2 [7,9]. However, importantly, there is a need for the standardization of CT-derived diagnostic thresholds for muscle mass and myosteatosis for use in various types of patients in addition to cancer patients [7]. Recently, by using data from a large Korean population of healthy individuals, Kim et al. [22] reported the reference values of NAMA, LAMA, IMAT, and their indices, and skeletal muscle area and TAMA attenuation (HU) measured by CT scans and suggested the cutoff points for diagnosing myosteatosis based on T-scores. The suggested cutoff points of the NAMA/TAMA index were 73% for class I myosteatosis (−2.0< T-score <−1.0) and 66% for class II myosteatosis (T-score <−2.0) in both men and women. Further studies in other populations are necessary to establish standardized diagnostic criteria for myosteatosis.
- The overall prevalences of myosteatosis defined by the NAMA/TAMA index in men and women were 16.6% and 21.6% for class I and 8.8% and 20.5% for class II, respectively; notably, the prevalence of class II myosteatosis was increased with age, reaching up to 17.4% in men and 45% in women over 60 years of age [22]. Particularly, women showed a markedly decreased value of the NAMA/TAMA index (Fig. 5) and an increased prevalence of myosteatosis after 50 years of age (Fig. 6) [22]. These findings suggest that myosteatosis progresses rapidly in postmenopausal women.
AGE-RELATED DISTRIBUTION AND PREVALENCE OF MYOSTEATOSIS
- Myosteatosis could explain the controversial effects of skeletal muscle mass on metabolic health and type 2 diabetes
- While many studies showed that high lean body mass or skeletal muscle mass was associated with high levels of insulin sensitivity and/or metabolic health [43,44], many other studies also convincingly reported that high lean body mass was associated with a metabolically unhealthy phenotype [45-49]. Recently, Kim et al. [50] published a cross-sectional study in 23,311 individuals aged 20 years or older who underwent abdominal CT scans during routine health check-ups. In that study, the metabolically unhealthy phenotype was defined as having two or more components of metabolic syndrome or the presence of hypertension or diabetes. They reported that the total muscle mass was not significantly different according to the metabolic phenotype or even lower in metabolically healthy phenotypes than in metabolically unhealthy phenotypes. However, compared with those with metabolically unhealthy phenotype, the individuals with the metabolically healthy phenotype had a significantly higher proportion of good quality muscle as represented by the NAMA/TAMA index.
- In addition, studies on the association between the prevalence or incidence of type 2 diabetes and the quantity of skeletal muscles measured by CT scan at the lumbar vertebrae also showed inconsistent results [43,51,52]. A recent study on myosteatosis of skeletal muscle showed that patients with type 2 diabetes had higher total and low attenuation muscle (fatty muscle) areas but lower values of NAMA (muscle with little fat) and NAMA/TAMA index [53].
- These results suggested that in addition to muscle mass, the degree of myosteatosis should be considered in the comparison of skeletal muscle between metabolically healthy and unhealthy phenotypes as well as the comparison between patients with type 2 diabetes and those without.
- Myosteatosis could explain the controversial effects of skeletal muscle mass on cardiovascular disease
- Although several studies showed that decreased muscle mass is a risk factor for coronary atherosclerosis [54,55], the muscle mass was usually adjusted with BMI or body weight and limited by the use of DXA or bio-impedence analysis in most studies. However, several studies using CT scans have shown inconsistent results according to different CT measurements such as muscle density, IMAT, or skeletal muscle area only. A 7.2-year follow-up longitudinal study showed that greater skeletal muscle fat infiltration measured by the calf muscle density using CT scan was associated with higher all-cause and cardiovascular mortality in older men [35]. The Coronary Artery Risk Development in Young Adults (CARDIA) study showed that higher intermuscular adipose volume (IMAT, –190 to –30 HU) measured by abdominal CT was significantly associated with coronary artery calcification [20]. However, in another study that analyzed participants from the Multi-Ethnic Study of Atherosclerosis (MESA), greater abdominal muscle area (0 to 100 HU) measured by CT was significantly associated with a more harmful coronary artery calcification profile, which was contrary to their hypothesis [56].
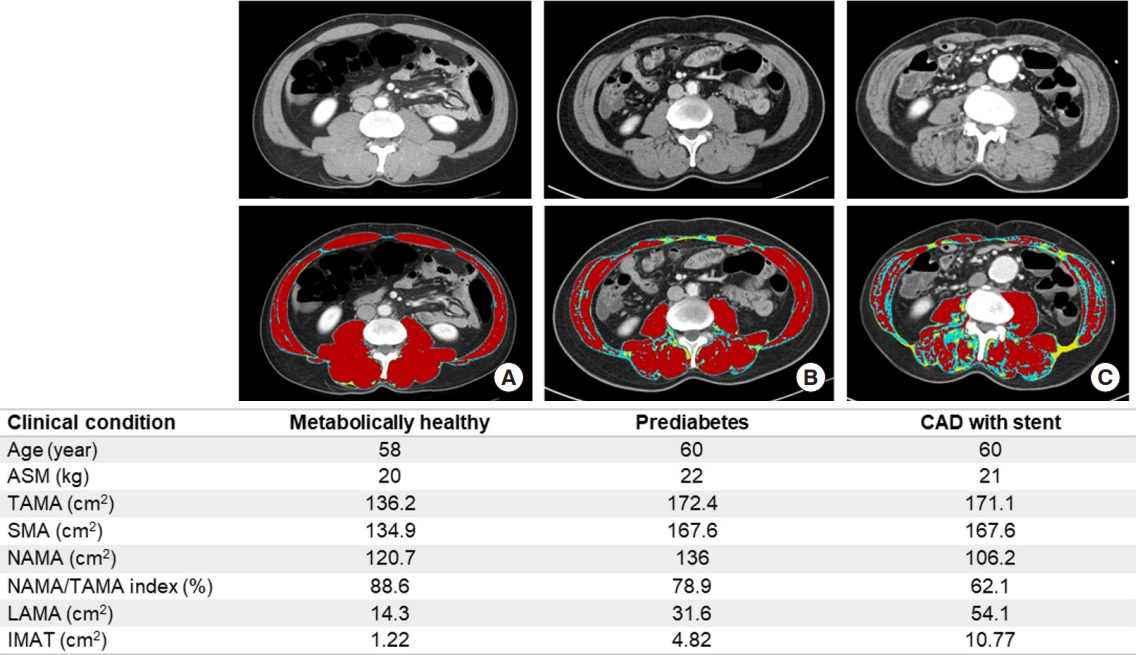
- Recently, a cross-sectional study on 4,068 individuals without cardiovascular disease reported that those with a higher NAMA/TAMA index showed favorable metabolic characteristics including lower blood pressure, glucose, homeostatic model assessment of insulin resistance (HOMA-IR), and visceral fat area as well as a lower prevalence of significant coronary artery calcification score adjusted for these confounding factors [57]. Therefore, the study suggested that good skeletal muscle quality itself is an important protective factor for subclinical coronary atherosclerosis [57]. Fig. 7 shows the clinical profiles of representative cases with different degrees of myosteatosis. Further longitudinal studies on cardiovascular morbidities and mortality are warranted to establish the roles of skeletal muscle quality and skeletal muscle mass.
- Myosteatosis and nonalcoholic fatty liver disease
- In obesity, surplus lipids accumulate in non-adipose tissues, such as the liver and skeletal muscle [58]. Furthermore, the gradual disruption of cellular and molecular mechanisms of the adipose-muscle-liver axis results in tissue injuries in muscles (myosteatosis or sarcopenia) and liver (nonalcoholic fatty liver disease [NAFLD]) [5]. Therefore, the association between NAFLD and skeletal muscle dysfunction is being increasingly recognized. While many studies have focused on the relationship between NAFLD and sarcopenia or sarcopenic obesity, only few studies have analyzed the relationship between myosteatosis and NAFLD. Recently, the UK-Biobank study reported that the amount of muscle fat was significantly elevated in those with NAFLD compared with those without [59]. In addition, when compared with those with low muscle volume alone, NAFLD patients with adverse muscle composition (defined as the presence of low muscle volume and high muscle fat infiltration) had a higher prevalence of type 2 diabetes, coronary heart disease, and poor physical function [59]. In a preliminary cross-sectional analysis including 13,452 individuals from author’s study group, we found that a higher proportion of good quality muscle was strongly associated with lower risks of NAFLD as assessed by ultrasonography and liver fibrosis using the NAFLD fibrosis score and fibrosis-4 index scores. It was also reported that muscle fat content, but not muscle mass, is strongly and independently associated with nonalcoholic steatohepatitis in patients with morbid obesity [60]. Taken together, these reports suggest that myosteatosis could be useful as a diagnostic and prognostic marker in NAFLD, which should be confirmed in prospective studies.
- Myosteatosis and muscular/mobility dysfunction
- The recent EWGSOP2 guideline defined that sarcopenia can only be diagnosed when a patient has a “low muscle strength” and the additional presence of low muscle mass [2]. The guideline emphasized that reduced muscle strength, not muscle mass, is the key characteristic of sarcopenia because strength better predicts adverse outcomes than mass [2]. A major factor that affects muscle strength is myosteatosis because increased myosteatosis leads to changes in muscle fiber orientation and significantly impairs the force generation of muscle fibers [61].
- Reduced muscle attenuation (HU) in trunk muscles is associated with lower back pain [10], reduced physical performance such as walking and standing balance [11], and hyperkyphosis [62]. Further studies including interventional studies are needed to develop a strategy for the prevention of muscular and mobility dysfunction.
- Myosteatosis and oncologic outcomes
- Many oncologic studies have consistently reported that among patients with diverse types of cancer, those with similar trunk muscle mass but larger amounts of intermuscular adipose infiltration had higher degrees of chemotherapy toxicity, tumor progression and other adverse outcomes [9,63,64]. Although there have been many studies in this field, a more detailed description was not included here because it is beyond the scope of this review.
- Myosteatosis and mortality
- Another very important issue for myosteatosis is its association with mortality. One study of 4,824 participants from the Age, Gene/Environment Susceptibility (AGES)-Reykjavik Study measured thigh muscle composition using CT imaging and showed that intramuscular adipose tissue was associated with higher mortality risk after 8.8 years of follow-up [18]. Another study including 1,974 participants from the MESA measured the abdominal muscle area and density from CT scans spanning L2–L4 and followed for approximately 10 years; in that study, greater abdominal muscle density, but not muscle area, was shown to be associated with a markedly lower risk of all-cause mortality, suggesting that muscle quality may be a better predictor of mortality than total muscle mass in community-dwelling adults [15].
ASSOCIATION OF MYOSTEATOSIS WITH CLINICAL OUTCOMES
- Apart from the issues discussed above, there are still gaps in our knowledge about myosteatosis. A profound understanding of the pathophysiological mechanisms of myosteatosis and targeted intervention studies are needed to develop effective therapeutic strategies for the prevention and treatment of myosteatosis to improve clinical outcomes.
- Mechanisms of myosteatosis and its relation to insulin resistance
- The mechanisms of myosteatosis are yet to be fully elucidated. A common explanation is that during weight gain and with aging, adipocytes may meet their capacity for fat storage, which increases the ectopic storage of fat around and within non-adipose tissues and organs such as skeletal muscle, liver, and pancreas [65].
- For intramyocellular fat accumulation, decreased fat oxidation due to mitochondrial dysfunction such as low basal adenosine triphosphate leads to impaired fatty acid metabolism, which subsequently results in increased intramyocelluar fat content [66,67]. The mechanisms linking the accumulation of fat within skeletal muscle with insulin resistance and type 2 diabetes are still unclear, but some have proposed that the accumulation of IMCL may impair the insulin receptor substrate 1/phosphatidylinositol 3-kinase pathway and the growth-factor-regulated protein kinase B pathway of insulin signaling [68]. Others have suggested that increased accumulation of lipid intermediates (e.g., diacylglycerol, long-chain fatty acyl-coenzyme A species, ceramides, and oxidized lipid mediators) due to increased accumulation of fat in the myocytes may be responsible for the suppression of insulin signaling [69].
- For IMAT, there are many unanswered questions regarding the etiology, including its cellular origins and how it accumulates with age. However, several insightful studies [70,71] reported that fibroblast/adipocyte progenitors (FAPs) may be precursor cells considering their presence in muscle tissues and their ability to differentiate into adipocytes in response to sedentary lifestyle, low physical activity, or pathological conditions (e.g., Duchenne muscular dystrophy). During homeostasis, muscle lineage cells interact with FAPs and maintain them in an undifferentiated state. During tissue regeneration, FAPs remain in an undifferentiated state but proliferate and produce signals, possibly those including interleukin 6, that stimulate the differentiation of satellite cells, restoring muscle mass. During degeneration, the inhibition of FAP differentiation is blocked and FAPs differentiate into adipocytes and fibroblasts, which may inhibit the activation of muscle progenitors and block the restoration of muscle mass [70]. Recently, the fibroblast growth factor-2-dependent pathway was reported to be activated in aged skeletal muscle and to promote the differentiation of FAPs and formation of IMAT [72].
- Although IMAT is closely related to insulin resistance, the exact mechanisms explaining this relationship are unclear as well. However, one possible mechanism linking intermuscular fat with type 2 diabetes is the impaired secretion of adipokines [73], as one study showed that increased accumulation of intermuscular fat could induce changes in muscle metabolism and insulin sensitivity via local secretion of inflammatory adipokines from fat cells surrounding muscle fibers [73]. Another theory is that intermuscular fat may modulate the nutritive blood flow to the muscle and thus contribute to insulin resistance by impairing insulin action and insulin diffusion capacity [74].
- Several studies suggested that skeletal muscle metabolism is regulated by the intrinsic circadian clocks [75] and that circadian misalignment results in disturbed energy metabolism and insulin resistance in skeletal muscles [76]. Further research is needed on the role of skeletal muscle circadian rhythms in the pathogenesis of myosteatosis.
- Intervention studies for myosteatosis
- Many previous intervention studies have focused on increasing muscle mass, but fewer studies have addressed issues on improving muscle quality. Recently, a meta-analysis [77] including 12 randomized controlled trials reported that a significant reduction in muscle lipid infiltration and an increase in muscle radiation attenuation were observed in the exercise group compared with the control group. However, the sample size was small in most studies (eight to 51 participants) and the duration of supervised physical exercise intervention (mean, 23 weeks; interquartile range, 12 to 36) and session duration (average, 37 minutes; interquartile range, 23 to 49) were somewhat short. Programs including aerobic [78,79] or resistance training [80] alone seemed to moderately increase the muscle radiation attenuation, and the combination of both exercise training modalities might be an optimal strategy [28,81]. One study reported that exercise showed preferential reductions in IMAT and visceral fat volumes, although both calorie restriction and exercise-induced weight loss decreased these fat depots [78]. Long-term longitudinal studies are needed not only to develop effective interventional protocols for improving myosteatosis but also to establish whether the reversal of myosteatosis can lead to clinically meaningful improvement in health outcomes.
- Pharmacological interventions for delaying or mitigating myosteatosis are still largely unexplored. Pioglitazone with lifestyle weight loss intervention was shown to reduce visceral adipose tissue, but it was not effective in improving myosteatosis [82]. A few intervention studies to date have reported some benefits on body composition using myostatin inhibitors [83] or testosterone [84], but the effects on myosteatosis have not been explored yet.
- There are additional issues that need to be addressed for effective intervention studies. Most of the studies so far have targeted older people and few have involved younger individuals. In order to perform well-designed controlled trials, the development and validation of standardized diagnostic methods and cutoff values of myosteatosis are essential. In addition, the relevant threshold for changes in those measures associated with clinically meaningful outcomes needs to be determined.
SUGGESTED AREAS OF FUTURE RESEARCH
- There is a growing body of evidence showing that myosteatosis is associated with aging, various metabolic diseases, and poor clinical outcomes. Therefore, assessment of myosteatosis in addition to muscle mass is expected to help guide treatment choices and monitor the response to the treatment of sarcopenia. However, there is no universal consensus on the standard definition and assessment methods of myosteatosis for routine clinical practice. Assessment of myosteatosis by CT scan on the lumbar vertebral level and calculation of the NAMA/TAMA index seem to be useful methodologies for evaluating muscle quality related to various clinical outcomes including metabolic and cardiovascular disease. New measurement tools that can be easily used in clinical practice are necessary to identify at-risk individuals and monitor the effectiveness of treatment options.
- Importantly, targeted studies on the mechanisms of the development of myosteatosis and its association with aging or disease state along with intervention strategies for preventing or mitigating myosteatosis are warranted. Furthermore, large prospective intervention trials for improving muscle quality are also needed to provide evidence-based recommendations to promote healthy aging.
CONCLUSIONS
-
Acknowledgements
- We thank our study group (prof. Sung-Jin Bae, Eun Hee Kim, and Min Jung Lee) for their co-works. We also thank Dr. Joon Seo Lim from the Scientific Publications Team at Asan Medical Center for his editorial assistance in preparing this manuscript.
-
CONFLICTS OF INTEREST
No potential conflict of interest relevant to this article was reported.
Article information
Fig. 1.Three different adipose depots in skeletal muscle. (A) Skeletal muscle is made up of intramyocellular myofibrils, muscle fibers, and fascicles bound together by successively thicker connective tissue layers (i.e., endomysium, perimysium, and epimysium). (B) Skeletal muscle fat may be classified into intramyocellular (lipid droplets filling the cytoplasm between the myofibrils of elongated myocytes) and extramyocellular components. Adipocytes may infiltrate between muscle fibers (intramuscular fat) and fascicles (intermuscular fat) or exist around the epimysium as extramuscular fat depots of adipose tissue. Reprinted from Altajar et al. [5].

Fig. 2.Muscle quality map derived from abdominal computed tomography (CT) using an automated artificial intelligence software. The total abdominal muscle area (TAMA) includes all muscles on the selected axial images (i.e., psoas, paraspinal, transversus abdominis, rectus abdominis, quadratus lumborum, and internal and external obliques). The TAMA is segmented into three areas according to the CT density [16]: (1) inter and intramuscular adipose tissue area (IMAT; −190 to −30 Hounsfield unit [HU], yellow), (2) normal attenuation muscle area (NAMA; 30 to 150 HU, red), and (3) low attenuation muscle area (LAMA; −29 to 29 HU, sky blue). The skeletal muscle area (SMA, −29 to 150) refers to the combined area of NAMA and LAMA. Reprinted from Kim et al. [22], with permission from Elsevier.
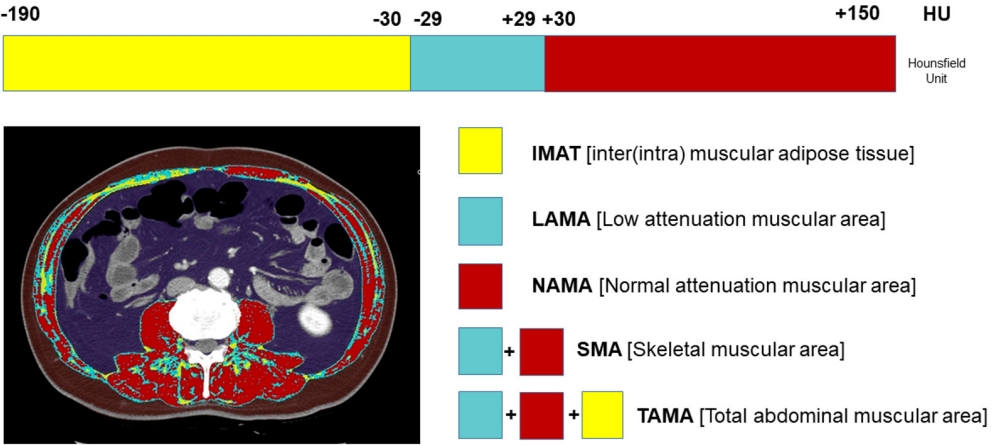
Fig. 3.Histogram of computed tomography measurements in a Korean population of general health check-up participants (n=12,697 men and 7,967 women, age 20 to 88 years). TAMA, total abdominal muscle area; SMA, skeletal muscle area; NAMA, normal attenuation muscle area; IMAT, inter and intramuscular adipose tissue area; LAMA, low attenuation muscle area.

Fig. 4.Distribution of computed tomography measurements according to sex and age group in a Korean population of general health check-up participants (n=12,697 men and 7,967 women, age 20 to 88 years) [22]. TAMA, total abdominal muscle area; SMA, skeletal muscle area; NAMA, normal attenuation muscle area; IMAT, inter and intramuscular adipose tissue area; LAMA, low attenuation muscle area.

Fig. 5.Box-plot distribution of the normal attenuation muscle area (NAMA)/total abdominal muscle area (TAMA) index according to age group in men (blue) and women (red). NAMA/TAMA index=(NAMA/TAMA)×100. Reprinted from Kim et al. [22], with permission from Elsevier.
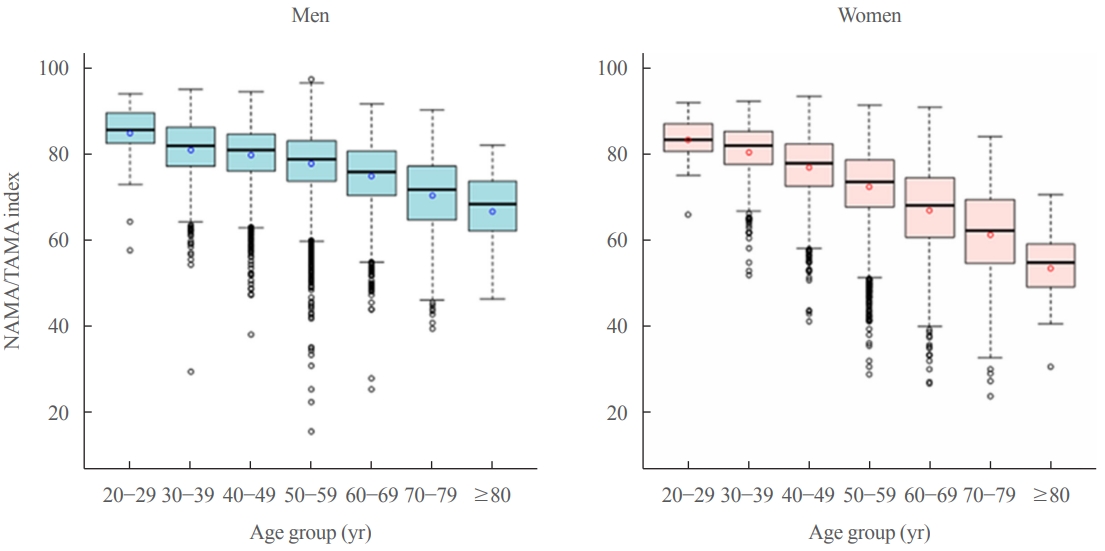
Fig. 6.Prevalence of myosteatosis defined by T-scores (<–2) of normal attenuation muscle area (NAMA)/total abdominal muscle area (TAMA) index according to sex and age group in a Korean population of general health check-up participants (n=12,697 men and 7,967 women, age 20 to 88 years). NAMA/TAMA index=(NAMA/TAMA)×100.
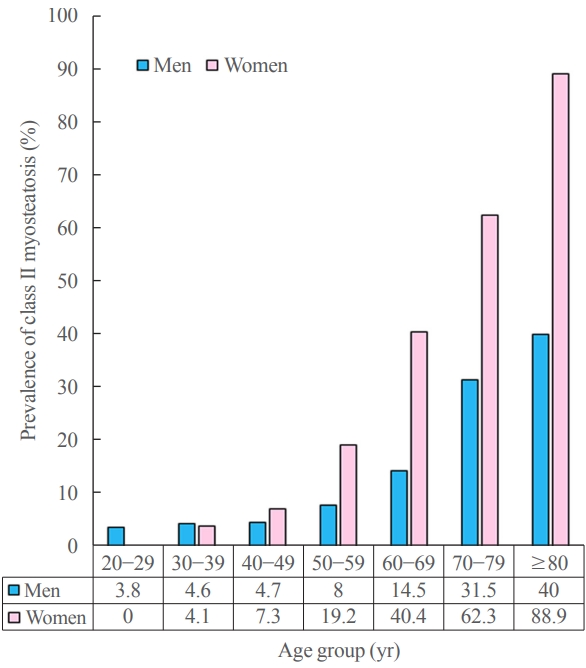
Fig. 7.Representative cases of similar age with different degrees of myosteatosis. Axial computed tomography scan images on L3 vertebral level from (A) a 58-year-old metabolically healthy man shows higher normal attenuation muscle area (NAMA; red)/total abdominal muscle area (TAMA) index and good quality muscles without myosteatosis, (B) a 60-year-old man with prediabetes shows lower NAMA/TAMA index and some fat infiltration of skeletal muscles, and (C) a 60-year-old man with coronary artery disease (CAD) having coronary stent shows lowest NAMA/TAMA index and more severe fat infiltration of skeletal muscles. ASM, appendicular skeletal muscle; SMA, skeletal muscle area; NAMA/TAMA index=(NAMA/TAMA)×100; LAMA, low attenuation muscle area (sky blue); IMAT, inter and intramuscular adipose tissue area (yellow).

Table 1.Modalities for Assessing Myosteatosis
- 1. Goodpaster BH, Park SW, Harris TB, Kritchevsky SB, Nevitt M, Schwartz AV, et al. The loss of skeletal muscle strength, mass, and quality in older adults: the health, aging and body composition study. J Gerontol A Biol Sci Med Sci 2006;61:1059–64.ArticlePubMed
- 2. Cruz-Jentoft AJ, Bahat G, Bauer J, Boirie Y, Bruyere O, Cederholm T, et al. Sarcopenia: revised European consensus on definition and diagnosis. Age Ageing 2019;48:16–31.ArticlePubMed
- 3. Beasley LE, Koster A, Newman AB, Javaid MK, Ferrucci L, Kritchevsky SB, et al. Inflammation and race and gender differences in computerized tomography-measured adipose depots. Obesity (Silver Spring) 2009;17:1062–9.ArticlePubMedPMC
- 4. Correa-de-Araujo R, Addison O, Miljkovic I, Goodpaster BH, Bergman BC, Clark RV, et al. Myosteatosis in the context of skeletal muscle function deficit: an Interdisciplinary Workshop at the National Institute on Aging. Front Physiol 2020;11:963.ArticlePubMedPMC
- 5. Altajar S, Baffy G. Skeletal muscle dysfunction in the development and progression of nonalcoholic fatty liver disease. J Clin Transl Hepatol 2020;8:414–23.ArticlePubMedPMC
- 6. Goodpaster BH, Kelley DE, Thaete FL, He J, Ross R. Skeletal muscle attenuation determined by computed tomography is associated with skeletal muscle lipid content. J Appl Physiol (1985) 2000;89:104–10.ArticlePubMed
- 7. Amini B, Boyle SP, Boutin RD, Lenchik L. Approaches to assessment of muscle mass and myosteatosis on computed tomography: a systematic review. J Gerontol A Biol Sci Med Sci 2019;74:1671–8.ArticlePubMedPMC
- 8. Aubrey J, Esfandiari N, Baracos VE, Buteau FA, Frenette J, Putman CT, et al. Measurement of skeletal muscle radiation attenuation and basis of its biological variation. Acta Physiol (Oxf) 2014;210:489–97.ArticlePubMedPMC
- 9. Aleixo GF, Shachar SS, Nyrop KA, Muss HB, Malpica L, Williams GR. Myosteatosis and prognosis in cancer: systematic review and meta-analysis. Crit Rev Oncol Hematol 2020;145:102839.ArticlePubMed
- 10. Hicks GE, Simonsick EM, Harris TB, Newman AB, Weiner DK, Nevitt MA, et al. Cross-sectional associations between trunk muscle composition, back pain, and physical function in the health, aging and body composition study. J Gerontol A Biol Sci Med Sci 2005;60:882–7.ArticlePubMed
- 11. Hicks GE, Simonsick EM, Harris TB, Newman AB, Weiner DK, Nevitt MA, et al. Trunk muscle composition as a predictor of reduced functional capacity in the health, aging and body composition study: the moderating role of back pain. J Gerontol A Biol Sci Med Sci 2005;60:1420–4.ArticlePubMed
- 12. Goodpaster BH, Krishnaswami S, Resnick H, Kelley DE, Haggerty C, Harris TB, et al. Association between regional adipose tissue distribution and both type 2 diabetes and impaired glucose tolerance in elderly men and women. Diabetes Care 2003;26:372–9.ArticlePubMed
- 13. Goodpaster BH, Thaete FL, Kelley DE. Thigh adipose tissue distribution is associated with insulin resistance in obesity and in type 2 diabetes mellitus. Am J Clin Nutr 2000;71:885–92.ArticlePubMed
- 14. Goodpaster BH, Carlson CL, Visser M, Kelley DE, Scherzinger A, Harris TB, et al. Attenuation of skeletal muscle and strength in the elderly: the Health ABC Study. J Appl Physiol (1985) 2001;90:2157–65.ArticlePubMed
- 15. Larsen B, Bellettiere J, Allison M, McClelland RL, Miljkovic I, Vella CA, et al. Muscle area and density and risk of allcause mortality: the Multi-Ethnic Study of Atherosclerosis. Metabolism 2020;111:154321.ArticlePubMedPMC
- 16. Addison O, Marcus RL, Lastayo PC, Ryan AS. Intermuscular fat: a review of the consequences and causes. Int J Endocrinol 2014;2014:309570.ArticlePubMedPMC
- 17. Brooks N, Cloutier GJ, Cadena SM, Layne JE, Nelsen CA, Freed AM, et al. Resistance training and timed essential amino acids protect against the loss of muscle mass and strength during 28 days of bed rest and energy deficit. J Appl Physiol (1985) 2008;105:241–8.ArticlePubMedPMC
- 18. Reinders I, Murphy RA, Brouwer IA, Visser M, Launer L, Siggeirsdottir K, et al. Muscle quality and myosteatosis: novel associations with mortality risk: the Age, Gene/Environment Susceptibility (AGES)-Reykjavik Study. Am J Epidemiol 2016;183:53–60.ArticlePubMed
- 19. Ryan AS, Harduarsingh-Permaul AS. Effects of weight loss and exercise on trunk muscle composition in older women. Clin Interv Aging 2014;9:395–402.ArticlePubMedPMC
- 20. Terry JG, Shay CM, Schreiner PJ, Jacobs DR Jr, Sanchez OA, Reis JP, et al. Intermuscular adipose tissue and subclinical coronary artery calcification in midlife: the CARDIA Study (Coronary Artery Risk Development in Young Adults). Arterioscler Thromb Vasc Biol 2017;37:2370–8.PubMedPMC
- 21. Hausman GJ, Basu U, Du M, Fernyhough-Culver M, Dodson MV. Intermuscular and intramuscular adipose tissues: bad vs. good adipose tissues. Adipocyte 2014;3:242–55.ArticlePubMedPMC
- 22. Kim HK, Kim KW, Kim EH, Lee MJ, Bae SJ, Ko Y, et al. Age-related changes in muscle quality and development of diagnostic cutoff points for myosteatosis in lumbar skeletal muscles measured by CT scan. Clin Nutr 2021;40:4022–8.ArticlePubMed
- 23. Tuttle LJ, Sinacore DR, Mueller MJ. Intermuscular adipose tissue is muscle specific and associated with poor functional performance. J Aging Res 2012;2012:172957.ArticlePubMedPMC
- 24. Goodpaster BH, Thaete FL, Kelley DE. Composition of skeletal muscle evaluated with computed tomography. Ann N Y Acad Sci 2000;904:18–24.ArticlePubMed
- 25. Mourtzakis M, Prado CM, Lieffers JR, Reiman T, McCargar LJ, Baracos VE. A practical and precise approach to quantification of body composition in cancer patients using computed tomography images acquired during routine care. Appl Physiol Nutr Metab 2008;33:997–1006.ArticlePubMed
- 26. van Dijk DP, Bakens MJ, Coolsen MM, Rensen SS, van Dam RM, Bours MJ, et al. Low skeletal muscle radiation attenuation and visceral adiposity are associated with overall survival and surgical site infections in patients with pancreatic cancer. J Cachexia Sarcopenia Muscle 2017;8:317–26.ArticlePubMed
- 27. Maltais A, Almeras N, Lemieux I, Tremblay A, Bergeron J, Poirier P, et al. Trunk muscle quality assessed by computed tomography: association with adiposity indices and glucose tolerance in men. Metabolism 2018;85:205–12.ArticlePubMed
- 28. Cuff DJ, Meneilly GS, Martin A, Ignaszewski A, Tildesley HD, Frohlich JJ. Effective exercise modality to reduce insulin resistance in women with type 2 diabetes. Diabetes Care 2003;26:2977–82.ArticlePubMed
- 29. Tanaka M, Okada H, Hashimoto Y, Kumagai M, Nishimura H, Oda Y, et al. Relationship between metabolic syndrome and trunk muscle quality as well as quantity evaluated by computed tomography. Clin Nutr 2020;39:1818–25.ArticlePubMed
- 30. Derstine BA, Holcombe SA, Goulson RL, Ross BE, Wang NC, Sullivan JA, et al. Quantifying sarcopenia reference values using lumbar and thoracic muscle areas in a healthy population. J Nutr Health Aging 2017;21:180–5.Article
- 31. van Vugt JL, Coebergh van den Braak RR, Schippers HJ, Veen KM, Levolger S, de Bruin RW, et al. Contrast-enhancement influences skeletal muscle density, but not skeletal muscle mass, measurements on computed tomography. Clin Nutr 2018;37:1707–14.ArticlePubMed
- 32. Szczepaniak LS, Babcock EE, Schick F, Dobbins RL, Garg A, Burns DK, et al. Measurement of intracellular triglyceride stores by H spectroscopy: validation in vivo. Am J Physiol 1999;276:E977–89.ArticlePubMed
- 33. Jacob S, Machann J, Rett K, Brechtel K, Volk A, Renn W, et al. Association of increased intramyocellular lipid content with insulin resistance in lean nondiabetic offspring of type 2 diabetic subjects. Diabetes 1999;48:1113–9.ArticlePubMed
- 34. Larson-Meyer DE, Smith SR, Heilbronn LK, Kelley DE, Ravussin E, Newcomer BR, et al. Muscle-associated triglyceride measured by computed tomography and magnetic resonance spectroscopy. Obesity (Silver Spring) 2006;14:73–87.ArticlePubMedPMC
- 35. Miljkovic I, Kuipers AL, Cauley JA, Prasad T, Lee CG, Ensrud KE, et al. Greater skeletal muscle fat infiltration is associated with higher all-cause and cardiovascular mortality in older men. J Gerontol A Biol Sci Med Sci 2015;70:1133–40.ArticlePubMedPMC
- 36. Miljkovic I, Kuipers AL, Cvejkus R, Bunker CH, Patrick AL, Gordon CL, et al. Myosteatosis increases with aging and is associated with incident diabetes in African ancestry men. Obesity (Silver Spring) 2016;24:476–82.ArticlePubMed
- 37. Harris-Love MO, Avila NA, Adams B, Zhou J, Seamon B, Ismail C, et al. The comparative associations of ultrasound and computed tomography estimates of muscle quality with physical performance and metabolic parameters in older men. J Clin Med 2018;7:340.ArticlePubMedPMC
- 38. Clark RV, Walker AC, O’Connor-Semmes RL, Leonard MS, Miller RR, Stimpson SA, et al. Total body skeletal muscle mass: estimation by creatine (methyl-d3) dilution in humans. J Appl Physiol (1985) 2014;116:1605–13.ArticlePubMedPMC
- 39. Cawthon PM, Orwoll ES, Peters KE, Ensrud KE, Cauley JA, Kado DM, et al. Strong relation between muscle mass determined by d3-creatine dilution, physical performance, and incidence of falls and mobility limitations in a prospective cohort of older men. J Gerontol A Biol Sci Med Sci 2019;74:844–52.ArticlePubMed
- 40. Orwoll ES, Peters KE, Hellerstein M, Cummings SR, Evans WJ, Cawthon PM. The importance of muscle versus fat mass in sarcopenic obesity: a re-evaluation using D3-creatine muscle mass versus DXA lean mass measurements. J Gerontol A Biol Sci Med Sci 2020;75:1362–8.ArticlePubMedPMC
- 41. Song MY, Ruts E, Kim J, Janumala I, Heymsfield S, Gallagher D. Sarcopenia and increased adipose tissue infiltration of muscle in elderly African American women. Am J Clin Nutr 2004;79:874–80.ArticlePubMed
- 42. Delmonico MJ, Harris TB, Visser M, Park SW, Conroy MB, Velasquez-Mieyer P, et al. Longitudinal study of muscle strength, quality, and adipose tissue infiltration. Am J Clin Nutr 2009;90:1579–85.ArticlePubMedPMC
- 43. Srikanthan P, Karlamangla AS. Relative muscle mass is inversely associated with insulin resistance and prediabetes: findings from the third National Health and Nutrition Examination Survey. J Clin Endocrinol Metab 2011;96:2898–903.ArticlePubMed
- 44. Kim TN, Park MS, Yang SJ, Yoo HJ, Kang HJ, Song W, et al. Body size phenotypes and low muscle mass: the Korean sarcopenic obesity study (KSOS). J Clin Endocrinol Metab 2013;98:811–7.ArticlePubMed
- 45. Brochu M, Tchernof A, Dionne IJ, Sites CK, Eltabbakh GH, Sims EA, et al. What are the physical characteristics associated with a normal metabolic profile despite a high level of obesity in postmenopausal women? J Clin Endocrinol Metab 2001;86:1020–5.ArticlePubMed
- 46. Karelis AD, Faraj M, Bastard JP, St-Pierre DH, Brochu M, Prud’homme D, et al. The metabolically healthy but obese individual presents a favorable inflammation profile. J Clin Endocrinol Metab 2005;90:4145–50.ArticlePubMed
- 47. Peppa M, Koliaki C, Papaefstathiou A, Garoflos E, Katsilambros N, Raptis SA, et al. Body composition determinants of metabolic phenotypes of obesity in nonobese and obese postmenopausal women. Obesity (Silver Spring) 2013;21:1807–14.ArticlePubMed
- 48. Camhi SM, Katzmarzyk PT. Differences in body composition between metabolically healthy obese and metabolically abnormal obese adults. Int J Obes (Lond) 2014;38:1142–5.ArticlePubMed
- 49. Estrella ML, Pirzada A, Durazo-Arvizu RA, Cai J, Giachello AL, Espinoza Gacinto R, et al. Correlates of and body composition measures associated with metabolically healthy obesity phenotype in hispanic/latino women and men: the Hispanic Community Health Study/Study of Latinos (HCHS/SOL). J Obes 2019;2019:1251456.ArticlePubMedPMC
- 50. Kim HK, Lee MJ, Kim EH, Bae SJ, Kim KW, Kim CH. Comparison of muscle mass and quality between metabolically healthy and unhealthy phenotypes. Obesity (Silver Spring) 2021;29:1375–86.ArticlePubMed
- 51. Granados A, Gebremariam A, Gidding SS, Terry JG, Carr JJ, Steffen LM, et al. Association of abdominal muscle composition with prediabetes and diabetes: the CARDIA study. Diabetes Obes Metab 2019;21:267–75.ArticlePubMed
- 52. Larsen BA, Wassel CL, Kritchevsky SB, Strotmeyer ES, Criqui MH, Kanaya AM, et al. Association of muscle mass, area, and strength with incident diabetes in older adults: the Health ABC Study. J Clin Endocrinol Metab 2016;101:1847–55.ArticlePubMedPMC
- 53. Kim EH, Kim HK, Lee MJ, Bae SJ, Kim KW, Choe J. Association between type 2 diabetes and skeletal muscle quality assessed by abdominal computed tomography scan. Diabetes Metab Res Rev 2021;e3513.ArticlePubMed
- 54. Srikanthan P, Horwich TB, Tseng CH. Relation of muscle mass and fat mass to cardiovascular disease mortality. Am J Cardiol 2016;117:1355–60.ArticlePubMed
- 55. Ko BJ, Chang Y, Jung HS, Yun KE, Kim CW, Park HS, et al. Relationship between low relative muscle mass and coronary artery calcification in healthy adults. Arterioscler Thromb Vasc Biol 2016;36:1016–21.ArticlePubMed
- 56. Crawford MA, Criqui MH, Forbang N, Unkart JT, Allison MA, Larsen BA. Associations of abdominal muscle area and density with coronary artery calcium volume and density: the multi-ethnic study of atherosclerosis. Metabolism 2020;107:154230.ArticlePubMedPMC
- 57. Lee MJ, Kim HK, Kim EH, Bae SJ, Kim KW, Kim MJ, et al. Association between muscle quality measured by abdominal computed tomography and subclinical coronary atherosclerosis. Arterioscler Thromb Vasc Biol 2021;41:e128–40.ArticlePubMed
- 58. Sam S, Mazzone T. Adipose tissue changes in obesity and the impact on metabolic function. Transl Res 2014;164:284–92.ArticlePubMed
- 59. Linge J, Ekstedt M, Dahlqvist Leinhard O. Adverse muscle composition is linked to poor functional performance and metabolic comorbidities in NAFLD. JHEP Rep 2020;3:100197.ArticlePubMedPMC
- 60. Nachit M, Kwanten WJ, Thissen JP, Op De Beeck B, Van Gaal L, Vonghia L, et al. Muscle fat content is strongly associated with NASH: a longitudinal study in patients with morbid obesity. J Hepatol 2021;75:292–301.ArticlePubMed
- 61. Miljkovic N, Lim JY, Miljkovic I, Frontera WR. Aging of skeletal muscle fibers. Ann Rehabil Med 2015;39:155–62.ArticlePubMedPMC
- 62. Katzman W, Cawthon P, Hicks GE, Vittinghoff E, Shepherd J, Cauley JA, et al. Association of spinal muscle composition and prevalence of hyperkyphosis in healthy community-dwelling older men and women. J Gerontol A Biol Sci Med Sci 2012;67:191–5.ArticlePubMed
- 63. Aleixo GF, Williams GR, Nyrop KA, Muss HB, Shachar SS. Muscle composition and outcomes in patients with breast cancer: meta-analysis and systematic review. Breast Cancer Res Treat 2019;177:569–79.ArticlePubMed
- 64. Kroenke CH, Prado CM, Meyerhardt JA, Weltzien EK, Xiao J, Cespedes Feliciano EM, et al. Muscle radiodensity and mortality in patients with colorectal cancer. Cancer 2018;124:3008–15.ArticlePubMed
- 65. Despres JP. Body fat distribution and risk of cardiovascular disease: an update. Circulation 2012;126:1301–13.ArticlePubMed
- 66. Lowell BB, Shulman GI. Mitochondrial dysfunction and type 2 diabetes. Science 2005;307:384–7.ArticlePubMed
- 67. Roden M. Muscle triglycerides and mitochondrial function: possible mechanisms for the development of type 2 diabetes. Int J Obes (Lond) 2005;29 Suppl 2:S111–5.ArticlePubMed
- 68. Petersen KF, Shulman GI. Etiology of insulin resistance. Am J Med 2006;119(5 Suppl 1):S10–6.ArticlePubMedPMC
- 69. Timmers S, Schrauwen P, de Vogel J. Muscular diacylglycerol metabolism and insulin resistance. Physiol Behav 2008;94:242–51.ArticlePubMed
- 70. Rodeheffer MS. Tipping the scale: muscle versus fat. Nat Cell Biol 2010;12:102–4.ArticlePubMed
- 71. Joe AW, Yi L, Natarajan A, Le Grand F, So L, Wang J, et al. Muscle injury activates resident fibro/adipogenic progenitors that facilitate myogenesis. Nat Cell Biol 2010;12:153–63.ArticlePubMedPMC
- 72. Mathes S, Fahrner A, Ghoshdastider U, Rudiger HA, Leunig M, Wolfrum C, et al. FGF-2-dependent signaling activated in aged human skeletal muscle promotes intramuscular adipogenesis. Proc Natl Acad Sci U S A 2021;118:e2021013118.ArticlePubMedPMC
- 73. Vettor R, Milan G, Franzin C, Sanna M, De Coppi P, Rizzuto R, et al. The origin of intermuscular adipose tissue and its pathophysiologicalm implications. Am J Physiol Endocrinol Metab 2009;297:E987–98.PubMed
- 74. Lee DE, Kehlenbrink S, Lee H, Hawkins M, Yudkin JS. Getting the message across: mechanisms of physiological cross talk by adipose tissue. Am J Physiol Endocrinol Metab 2009;296:E1210–29.ArticlePubMed
- 75. Hodge BA, Wen Y, Riley LA, Zhang X, England JH, Harfmann BD, et al. The endogenous molecular clock orchestrates the temporal separation of substrate metabolism in skeletal muscle. Skelet Muscle 2015;5:17.ArticlePubMedPMC
- 76. Gutierrez-Monreal MA, Harmsen JF, Schrauwen P, Esser KA. Ticking for metabolic health: the skeletal-muscle clocks. Obesity (Silver Spring) 2020;28 Suppl 1:S46–54.PubMed
- 77. Ramirez-Velez R, Ezzatvar Y, Izquierdo M, Garcia-Hermoso A. Effect of exercise on myosteatosis in adults: a systematic review and meta-analysis. J Appl Physiol (1985) 2021;130:245–55.ArticlePubMed
- 78. Murphy JC, McDaniel JL, Mora K, Villareal DT, Fontana L, Weiss EP. Preferential reductions in intermuscular and visceral adipose tissue with exercise-induced weight loss compared with calorie restriction. J Appl Physiol (1985) 2012;112:79–85.ArticlePubMed
- 79. Ikenaga M, Yamada Y, Kose Y, Morimura K, Higaki Y, Kiyonaga A, et al. Effects of a 12-week, short-interval, intermittent, low-intensity, slow-jogging program on skeletal muscle, fat infiltration, and fitness in older adults: randomized controlled trial. Eur J Appl Physiol 2017;117:7–15.ArticlePubMed
- 80. Avila JJ, Gutierres JA, Sheehy ME, Lofgren IE, Delmonico MJ. Effect of moderate intensity resistance training during weight loss on body composition and physical performance in overweight older adults. Eur J Appl Physiol 2010;109:517–25.ArticlePubMed
- 81. Goodpaster BH, Chomentowski P, Ward BK, Rossi A, Glynn NW, Delmonico MJ, et al. Effects of physical activity on strength and skeletal muscle fat infiltration in older adults: a randomized controlled trial. J Appl Physiol (1985) 2008;105:1498–503.ArticlePubMedPMC
- 82. Shea MK, Nicklas BJ, Marsh AP, Houston DK, Miller GD, Isom S, et al. The effect of pioglitazone and resistance training on body composition in older men and women undergoing hypocaloric weight loss. Obesity (Silver Spring) 2011;19:1636–46.ArticlePubMedPMC
- 83. Becker C, Lord SR, Studenski SA, Warden SJ, Fielding RA, Recknor CP, et al. Myostatin antibody (LY2495655) in older weak fallers: a proof-of-concept, randomised, phase 2 trial. Lancet Diabetes Endocrinol 2015;3:948–57.ArticlePubMed
- 84. Ng Tang Fui M, Prendergast LA, Dupuis P, Raval M, Strauss BJ, Zajac JD, et al. Effects of testosterone treatment on body fat and lean mass in obese men on a hypocaloric diet: a randomised controlled trial. BMC Med 2016;14:153.ArticlePubMedPMC
References
Figure & Data
References
Citations
Citations to this article as recorded by 
- A CT-based Deep Learning Model for Predicting Subsequent Fracture Risk in Patients with Hip Fracture
Yisak Kim, Young-Gon Kim, Jung-Wee Park, Byung Woo Kim, Youmin Shin, Sung Hye Kong, Jung Hee Kim, Young-Kyun Lee, Sang Wan Kim, Chan Soo Shin
Radiology.2024;[Epub] CrossRef - Myosteatosis is associated with poor survival after kidney transplantation: a large retrospective cohort validation
Jie Chen, Yue Li, Chengjie Li, Turun Song
Abdominal Radiology.2024; 49(4): 1210. CrossRef - Fatty infiltration of gastrocnemius–soleus muscle complex: Considerations for myosteatosis rehabilitation
Catherine Hatzantonis, Lalith Satkunam, Karyne N. Rabey, Jennifer C. Hocking, Anne M. R. Agur
Journal of Anatomy.2024;[Epub] CrossRef - Muscle attenuation, not skeletal muscle index, is an independent prognostic factor for survival in gastric cancer patients with overweight and obesity
Cheng-Le Zhuang, Hao-Fan Wu, Hao-Jie Jiang, Feng-Min Zhang, Han-Ping Shi, Zhen Yu, Xian Shen, Xiao-Lei Chen, Su-Lin Wang
Nutrition.2024; 122: 112391. CrossRef - Myosteatosis is associated with coronary artery calcification in patients with type 2 diabetes
Fu-Peng Liu, Mu-Jie Guo, Qing Yang, Yan-Ying Li, Yan-Gang Wang, Mei Zhang
World Journal of Diabetes.2024; 15(3): 429. CrossRef - Unlocking liver health: Can tackling myosteatosis spark remission in metabolic dysfunction‐associated steatotic liver disease?
Guillaume Henin, Audrey Loumaye, Louise Deldicque, Isabelle A. Leclercq, Nicolas Lanthier
Liver International.2024;[Epub] CrossRef - Association of serum gamma-glutamyl transferase with myosteatosis assessed by muscle quality mapping using abdominal computed tomography
Han Na Jung, Yun Kyung Cho, Hwi Seung Kim, Eun Hee Kim, Min Jung Lee, Joong-Yeol Park, Woo Je Lee, Hong-Kyu Kim, Chang Hee Jung
Clinical Imaging.2023; 93: 4. CrossRef - Increased visceral fat area to skeletal muscle mass ratio is positively associated with the risk of cardiometabolic diseases in a Chinese natural population: A cross‐sectional study
Shi Zhang, Yaping Huang, Jing Li, Xincheng Wang, Xiaohe Wang, Minying Zhang, Yanju Zhang, Meiyang Du, Jingna Lin, Chunjun Li
Diabetes/Metabolism Research and Reviews.2023;[Epub] CrossRef - Association between hypertension and myosteatosis evaluated by abdominal computed tomography
Han Na Jung, Yun Kyung Cho, Hwi Seung Kim, Eun Hee Kim, Min Jung Lee, Woo Je Lee, Hong-Kyu Kim, Chang Hee Jung
Hypertension Research.2023; 46(4): 845. CrossRef - Epidemiological, mechanistic, and practical bases for assessment of cardiorespiratory fitness and muscle status in adults in healthcare settings
Jaime A. Gallo-Villegas, Juan C. Calderón
European Journal of Applied Physiology.2023; 123(5): 945. CrossRef - Muscle fat infiltration in chronic kidney disease: a marker related to muscle quality, muscle strength and sarcopenia
Carla Maria Avesani, Aline Miroski de Abreu, Heitor S. Ribeiro, Torkel B. Brismar, Peter Stenvinkel, Alice Sabatino, Bengt Lindholm
Journal of Nephrology.2023; 36(3): 895. CrossRef - IDF2022-1139 Association Between Dyslipidemia And Myosteatosis Using Visual Muscular Quality Map In Computed Tomography
H.S. Kim, H.N. Jung, Y.K. Cho, E.H. Kim, M.J. Lee, W.J. Lee, J.Y. Park, H.K. Kim, C.H. Jung
Diabetes Research and Clinical Practice.2023; 197: 110467. CrossRef - The role of skeletal muscle mass on cardiovascular disease risk: an emerging role on modulating lipid profile
Evangelia Damigou, Matina Kouvari, Demosthenes Panagiotakos
Current Opinion in Cardiology.2023; 38(4): 352. CrossRef - Reference values for low muscle mass and myosteatosis using tomographic muscle measurements in living kidney donors
Lisa B. Westenberg, Marcel Zorgdrager, Tim D. A. Swaab, Marco van Londen, Stephan J. L. Bakker, Henri G. D. Leuvenink, Alain R. Viddeleer, Robert A. Pol
Scientific Reports.2023;[Epub] CrossRef - Association between sarcopenic obesity and poor muscle quality based on muscle quality map and abdominal computed tomography
Yun Kyung Cho, Han Na Jung, Eun Hee Kim, Min Jung Lee, Joong‐Yeol Park, Woo Je Lee, Hong‐Kyu Kim, Chang Hee Jung
Obesity.2023; 31(6): 1547. CrossRef - Increase in skeletal muscular adiposity and cognitive decline in a biracial cohort of older men and women
Caterina Rosano, Anne Newman, Adam Santanasto, Xiaonan Zhu, Bret Goodpaster, Iva Miljkovic
Journal of the American Geriatrics Society.2023; 71(9): 2759. CrossRef - Evaluation of Paraspinal Muscle Degeneration on Pain Relief after Percutaneous Epidural Adhesiolysis in Patients with Degenerative Lumbar Spinal Disease
Misun Kang, Shin Hyung Kim, Minju Jo, Hyun Eom Jung, Jungbin Bae, Hee Jung Kim
Medicina.2023; 59(6): 1118. CrossRef - Sarcopenic obesity and its relation with muscle quality and mortality in patients on chronic hemodialysis
Alice Sabatino, Carla Maria Avesani, Giuseppe Regolisti, Marianna Adinolfi, Giuseppe Benigno, Marco Delsante, Enrico Fiaccadori, Ilaria Gandolfini
Clinical Nutrition.2023; 42(8): 1359. CrossRef - Association between computed tomography‐assessed sarcopenia and mortality in patients with anti‐neutrophil cytoplasmic antibody‐associated vasculitis
Sung Soo Ahn, Yong‐Beom Park, Sang‐Won Lee
International Journal of Rheumatic Diseases.2023; 26(9): 1704. CrossRef - Association Between Insulin Resistance and Myosteatosis Measured by Abdominal Computed Tomography
Myung Jin Kim, Yun Kyung Cho, Han Na Jung, Eun Hee Kim, Min Jung Lee, Chang Hee Jung, Joong-Yeol Park, Hong-Kyu Kim, Woo Je Lee
The Journal of Clinical Endocrinology & Metabolism.2023; 108(12): 3100. CrossRef - Association of Visceral Fat Obesity, Sarcopenia, and Myosteatosis with Non-Alcoholic Fatty Liver Disease without Obesity
Hong-Kyu Kim, Sung-Jin Bae, Min Jung Lee, Eun Hee Kim, Hana Park, Hwi Seung Kim, Yun Kyung Cho, Chang Hee Jung, Woo Je Lee, Jaewon Choe
Clinical and Molecular Hepatology.2023; 29(4): 987. CrossRef - Different computed tomography parameters for defining myosteatosis in patients with advanced non-small cell lung cancer
Wenyi Zhang, Jing Tang, Huiyu Tang, Lingling Xie, Jing Wang, Jinhui Wu, Ming Yang
Clinical Nutrition.2023; 42(12): 2414. CrossRef - All you need to know about sarcopenia: a short guide for an internal medicine physician in questions and answers
G. R. Bikbavova, M. A. Livzan, D. V. Tikhonravova
Bulletin of Siberian Medicine.2023; 22(3): 88. CrossRef - Muscle Fat Content Is Associated with Nonalcoholic Fatty Liver Disease and Liver Fibrosis in Chinese Adults
W. Guo, X. Zhao, D. Cheng, X. Liang, M. Miao, X. Li, J. Lu, N. Xu, Shuang Hu, Qun Zhang
The Journal of nutrition, health and aging.2023; 27(11): 960. CrossRef - Body Composition Evaluation and Clinical Markers of Cardiometabolic Risk in Patients with Phenylketonuria
Luis M. Luengo-Pérez, Mercedes Fernández-Bueso, Ana Ambrojo, Marta Guijarro, Ana Cristina Ferreira, Luís Pereira-da-Silva, André Moreira-Rosário, Ana Faria, Conceição Calhau, Anne Daly, Anita MacDonald, Júlio César Rocha
Nutrients.2023; 15(24): 5133. CrossRef - Assessment of Muscle Quantity, Quality and Function
Bo Kyung Koo
Journal of Obesity & Metabolic Syndrome.2022; 31(1): 9. CrossRef - Influence of cross‐sectional area and fat infiltration of paraspinal muscles on analgesic efficacy of epidural steroid injection in elderly patients
Hee Jung Kim, Miribi Rho, Kyung Bong Yoon, Minju Jo, Dong Woo Lee, Shin Hyung Kim
Pain Practice.2022; 22(7): 621. CrossRef - Sarcopenia, Obesity, Sarcopenic Obesity and Risk of Poor Nutritional Status in Polish Community-Dwelling Older People Aged 60 Years and Over
Marika Murawiak, Roma Krzymińska-Siemaszko, Aleksandra Kaluźniak-Szymanowska, Marta Lewandowicz, Sławomir Tobis, Katarzyna Wieczorowska-Tobis, Ewa Deskur-Śmielecka
Nutrients.2022; 14(14): 2889. CrossRef - Metabolic mechanisms for and treatment of NAFLD or NASH occurring after liver transplantation
Amedeo Lonardo, Alessandro Mantovani, Salvatore Petta, Amedeo Carraro, Christopher D. Byrne, Giovanni Targher
Nature Reviews Endocrinology.2022; 18(10): 638. CrossRef
 PubReader
 ePub Link
 Cite
Cite