Development of a Non-Invasive Liver Fibrosis Score Based on Transient Elastography for Risk Stratification in Patients with Type 2 Diabetes
Article information

Abstract
Background
In non-alcoholic fatty liver disease (NAFLD), transient elastography (TE) is an accurate non-invasive method to identify patients at risk of advanced fibrosis (AF). We developed a diabetes-specific, non-invasive liver fibrosis score based on TE to facilitate AF risk stratification, especially for use in diabetes clinics where TE is not readily available.
Methods
Seven hundred sixty-six adults with type 2 diabetes and NAFLD were recruited and randomly divided into a training set (n=534) for the development of diabetes fibrosis score (DFS), and a testing set (n=232) for internal validation. DFS identified patients with AF on TE, defined as liver stiffness (LS) ≥9.6 kPa, based on a clinical model comprising significant determinants of LS with the lowest Akaike information criteria. The performance of DFS was compared with conventional liver fibrosis scores (NFS, FIB-4, and APRI), using area under the receiver operating characteristic curve (AUROC), sensitivity, specificity, positive and negative predictive values (NPV).
Results
DFS comprised body mass index, platelet, aspartate aminotransferase, high-density lipoprotein cholesterol, and albuminuria, five routine measurements in standard diabetes care. Derived low and high DFS cut-offs were 0.1 and 0.3, with 90% sensitivity and 90% specificity, respectively. Both cut-offs provided better NPVs of >90% than conventional fibrosis scores. The AUROC of DFS for AF on TE was also higher (P<0.01) than the conventional fibrosis scores, being 0.85 and 0.81 in the training and testing sets, respectively.
Conclusion
Compared to conventional fibrosis scores, DFS, with a high NPV, more accurately identified diabetes patients at-risk of AF, who need further evaluation by hepatologists.
INTRODUCTION
Non-alcoholic fatty liver disease (NAFLD) is highly prevalent among patients with type 2 diabetes [1,2]. Type 2 diabetes, on the other hand, is a risk factor for NAFLD progression to cirrhosis, hepatocellular carcinoma, and liver mortality [3–5]. In NAFLD, liver fibrosis is the major determinant of adverse liver outcomes, and the risk of liver mortality increases exponentially with higher stages of hepatic fibrosis [6–8]. Therefore, early identification of those at risk of significant fibrosis is important in the management of patients comorbid with NAFLD and type 2 diabetes [9].
Although liver biopsy is still considered the gold standard for evaluation of NAFLD severity, its limitations and the need for alternatives such as elastography techniques are being increasingly recognized. In the real-world setting, it is not feasible, both technically and ethically, to perform liver biopsy in the large number of stable and asymptomatic patients comorbid with type 2 diabetes and NAFLD. A recently proposed algorithm advocated that all patients with type 2 diabetes should undergo transient elastography (TE) for assessment of liver fibrosis, and those with advanced fibrosis (AF) then be referred to hepatologists for further investigations [10]. This is based on the high accuracy of TE in the diagnosis of AF in NAFLD, with the area under the receiver operating characteristic curve (AUROC) of up to 0.93 [11]. However, the availability of TE in healthcare institutions is a major limitation of this approach. Although TE is quite accessible worldwide in liver clinics, it is not readily available in most clinics that provide follow-up for the large number of patients with type 2 diabetes in both primary and secondary care. Thus, we developed a convenient clinical fibrosis score based on TE, specifically for risk stratification in people with type 2 diabetes, especially in the setting where TE is not readily accessible, to identify those most likely to have AF on TE for referral to hepatologist or prioritization for early TE.
METHODS
Study participants
In this study, all participants were recruited from the diabetes clinic of Queen Mary Hospital, Hong Kong. Type 2 diabetes was diagnosed by physicians based on clinical history, biochemical and/or immunological findings. Consecutive patients who attended diabetes complications screening between January 2017 and December 2019 were invited to come back for a second visit for TE assessments if they fulfilled all inclusion and exclusion criteria. Eligible patients were Chinese and aged between 21 and 80 years. Exclusion criteria consisted of the presence of active malignancy, concomitant chronic hepatitis B or C, or documented history of any other liver disease including alpha-1 anti-trypsin deficiency, Wilson’s disease, autoimmune hepatitis, drug-induced liver injury, primary biliary cholangitis, or chronic use of steatogenic medications such as amiodarone, methotrexate, or tamoxifen. Furthermore, patients with daily alcoholic consumption of more than 30 g in men or 20 g in women were also excluded [12]. In total, 1,121 participants with type 2 diabetes fulfilled all inclusion and exclusion criteria, and consented to come back on a separate day for TE assessments. Since this study aimed to develop a non-invasive fibrosis score for patients comorbid with type 2 diabetes and NAFLD, only participants who had hepatic steatosis as defined by controlled attenuation parameter (CAP) measurements (see below) during TE were included. After further excluding 355 participants who did not have hepatic steatosis on TE, 766 participants comorbid with type 2 diabetes and NAFLD were eventually included in this study. The study protocol was approved by the Institutional Review Board of the University of Hong Kong/Hospital Authority Hong Kong West Cluster (reference number: UW 16-272). Written informed consent was obtained from all participants prior to any study related procedures.
Clinical and biochemical assessments
As part of the standard clinical management, all patients from the diabetes clinic had regular complications assessment to ascertain their glycaemic control, and detect the presence of cardiovascular risk factors and diabetic complications. Anthropometric parameters, including body weight, height, body mass index (BMI), waist circumference (WC), and blood pressure (BP) were measured. Fasting blood was drawn for plasma glucose, lipids, glycated hemoglobin (HbA1c), complete blood count, liver and renal function tests. Albuminuria status was assessed with a random urine sample, and categorized according to their urine albumin to creatinine ratio (A1 <3 mg/mmol, A2 3–30 mg/mmol, and A3 >30 mg/mmol). All patients had regular fundi examination with retinal photographs and/or assessments by ophthalmologists. For those who consented to participate in this study, smoking status, alcohol consumption, detailed medical, drug, and family histories were obtained using a standardized questionnaire. Their prothrombin time was also checked.
Conventional fibrosis scores currently in use, including NAFLD fibrosis score (NFS), fibrosis-4 (FIB-4) and aspartate aminotransferase-to-platelet ratio index (APRI), were calculated using published formula and categorized based on recommended cut-offs [13].
Definitions of clinical variables and outcomes
Hypertension was defined as BP ≥140/90 mm Hg or if the participant was on anti-hypertensive medications [14]. Dyslipidaemia was defined as fasting triglycerides of ≥1.7 mmol/L, high-density lipoprotein cholesterol (HDL-C) <1.0 mmol/L in men or <1.3 mmol/L in women, and low-density lipoprotein cholesterol ≥2.6 mmol/L, or if the participant was on lipid lowering medications [15]. The diagnoses of coronary heart disease (CHD) and stroke were based on diagnostic codes from the 9th edition of the International Classification of Diseases (410, 36.01-10 for CHD and 430–438 for stroke) [16].
Transient elastography
All participants underwent the procedure after fasting for at least 8 hours. CAP and liver stiffness (LS) were measured using Fibroscan (Echosens, Paris, France) by two operators with experience in performing over 500 measurements. The inter-observer reliability was satisfactory, as reflected by an intra-class correlation of 0.98 for CAP and 0.97 for LS measurements. Both CAP and LS measurements were represented by the median of 10 reliable measurements, defined when the interquartile range (IQR) was less than 30% and the success rate was more than 60%. Only CAP values with IQR of more than 40 dB/m were used to ensure validity of the results [17]. All examinations were done using the M probe in the first attempt. The XL probe was used if the BMI was more than 30 kg/m2.
Hepatic steatosis was graded by published CAP cut-offs: mild steatosis 248 to 267 dB/m, moderate steatosis 268 to 279 dB/m, and severe steatosis ≥280 dB/m [18]. AF (F3) and cirrhosis (F4) were graded by LS cut-offs: F3 9.6 to 11.4 kPa and F4 ≥11.5 kPa (M Probe); F3 9.3 to 10.9 kPa and F4 ≥11.0 kPa (XL Probe) [19].
Statistical analysis
All data were analysed using the R version 3.6.0 (R Foundation for Statistical Computing, Vienna, Austria) and IBM SPSS Statistics version 25.0 (IBM Corp., Armonk, NY, USA). In all statistical tests, two-sided P values <0.05 were considered significant. Data not normally distributed (as determined using Kolmogorov-Smirnov test) such as triglyceride levels were logarithmically transformed to obtain near normality before analysis. Values were reported as mean±standard deviation, medians with IQR (for variables with skewed data), or percentages, as appropriate. Chi-square test was used for comparisons of categorical variables, while independent t test or analysis of variance was used for comparisons of continuous variables where appropriate. Pearson correlation analysis was used to determine the correlation between LS and other clinical variables.
The study population was randomized 7:3 into training and testing sets using the R sampling package. The elements sampled were allocated across the four strata of LS so that the proportion of elements in each stratum was identical between the training and testing sets. The training set was used to develop a diabetes-specific non-invasive fibrosis score, diabetes fibrosis score (DFS), while the testing set was used for internal validation. In the training set, multivariable logistic regression analysis was performed to evaluate the independent determinants of LS ≥F3 with their respective odds ratio (OR) and 95% confidence interval. Variables that were statistically significant in univariate analysis were included in the multivariable logistic regression, and DFS was developed based on a clinical model with the lowest Akaike information criteria (AIC), indicating the most parsimonious model in the multivariable logistic regression analysis. By employing repeated five-fold cross-validation in the training set, data were split into five subsets with 100 repeats to estimate the cross-validated AUROC. Three diagnostic cut-offs of DFS for ≥F3 on TE were derived, which included an optimal cut-off based on the point with maximum Youden j index (y) on ROC curve with y=[sensitivity–(1-specificity)], a low cut-off with 90% sensitivity, and a high cut-off with 90% specificity. The AUROC of DFS, as well as the sensitivity, specificity, positive (PPV) and negative predictive values (NPV) using the three cut-offs were validated in the testing set. Dominance analysis was performed to determine the relative importance of each variable in the logistic regression model, based on the average of coefficient of determination R2 [20].
In both training and testing sets, the diagnostic performance of each conventional non-invasive fibrosis score, including their AUROC, sensitivity, specificity, PPV, and NPV values, was determined. The AUROCs of DFS and conventional non-invasive fibrosis tests were compared using DeLong method.
RESULTS
A total of 766 participants comorbid with type 2 diabetes and NAFLD were included in this study to develop a non-invasive fibrosis score for type 2 diabetes. They were randomly divided into 534 in the training set, and 232 in the testing set.
Of these 766 participants, 62.4% and 19.5% of them had severe hepatic steatosis and ≥F3 fibrosis (AF or cirrhosis) on TE, respectively. There were no significant differences in the demographics, clinical, biochemical and TE findings between the training and testing sets of participants (Table 1).
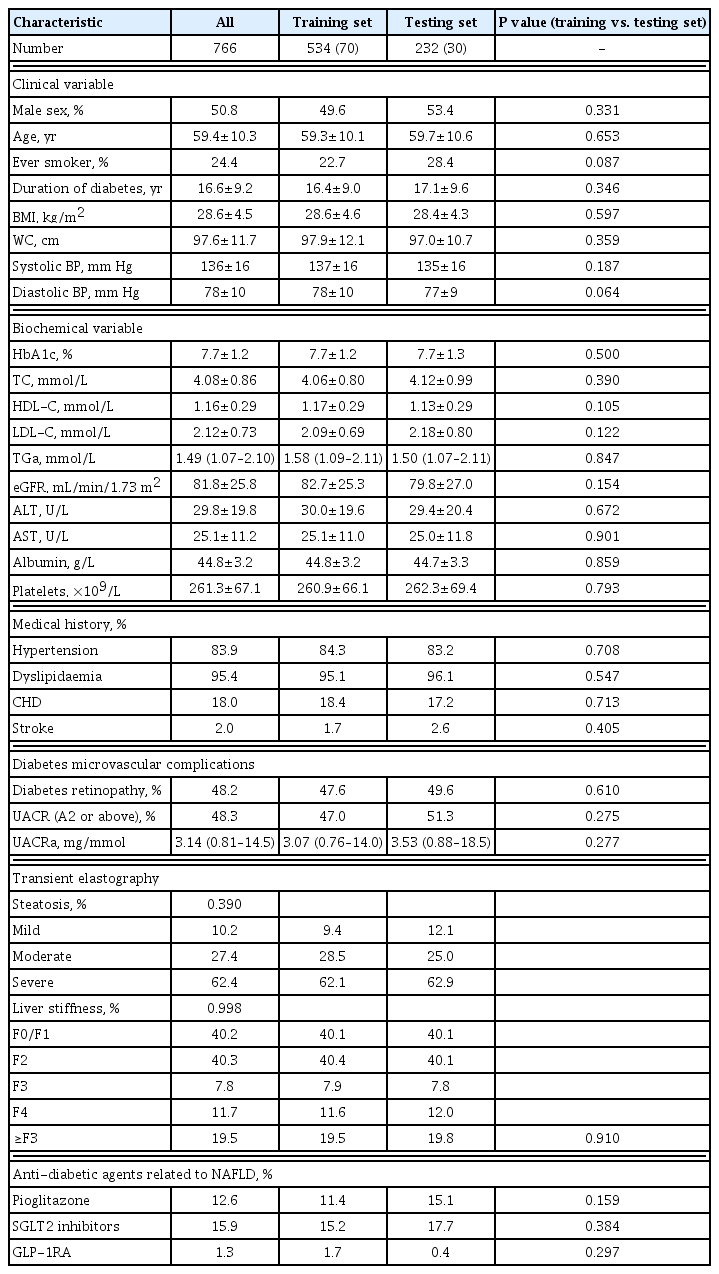
Clinical Characteristics of the Study Participants in Training and Testing Sets
Clinical characteristics were significantly different between participants with ≥F3 fibrosis and those without
In the training set of 534 participants, 104 (19.5%) had ≥F3 fibrosis. Those with ≥F3 fibrosis were more likely to be ever-smokers (P=0.028), had significantly higher BMI (P<0.001), WC (P<0.001), serum triglyceride (P=0.032), alanine aminotransferase (ALT) and aspartate aminotransferase (AST) levels (both P<0.001), degree of albuminuria (P<0.001), and CAP measurements (P<0.001), compared to those with <F3 fibrosis. On the other hand, their serum HDL-C and platelet count were significantly lower (P=0.001 and P<0.001, respectively) (Table 2).
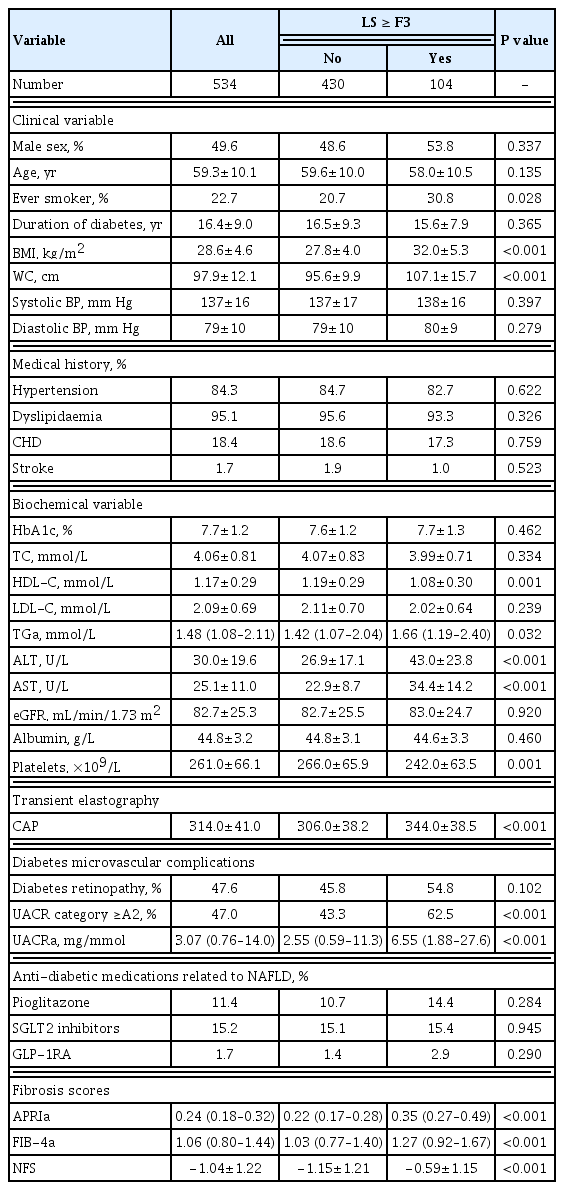
Clinical Characteristics of the Study Participants in the Training Set (n=534)
Conventional non-invasive fibrosis scores had overall suboptimal correlation with LS measurements
Participants with ≥F3 fibrosis had significantly higher APRI, FIB-4, and NFS than those without (0.35 vs. 0.22, 1.27 vs. 1.03, −0.59 vs. −1.15, respectively; All P<0.001) (Table 2).
The Pearson correlation analysis of LS measurements in the training set of participants is summarised in Table 3. Although all the conventional non-invasive fibrosis scores showed significantly positive correlation with LS, the correlation was greater with APRI (r=0.43, P<0.001) than FIB-4 (r=0.17, P<0.001) or NFS (r=0.15, P<0.001).

Pearson Correlation Analysis of Liver Stiffness Measurements with Clinical Variables and Conventional Fibrosis Scores of the Participants in the Training Set (n=534)
DFS to identify those who would have AF or cirrhosis on TE
Repeated five-fold cross-validated logistic regression analysis of the training set was performed and included age, ever smoker, BMI, AST, ALT, HDL-C, triglyceride, platelet count, and albuminuria category, the variables with significant difference between participants with and without ≥F3 fibrosis on univariate analysis (Table 2). The variables that were independently associated with ≥F3 fibrosis on TE were BMI (OR, 1.21; P<0.001), AST levels (OR, 1.09; P<0.001), platelet count (OR, 0.99; P=0.023), as well as albuminuria category A2 or above (OR, 1.80; P=0.029) (Tables 4, 5). Variables were selected in DFS based on the model with the best performance, as reflected by the lowest AIC values, which included BMI, platelet count, AST, albuminuria and HDL-C levels in the following equation: DFS=exp(−7.6575+0.1889×BMI+0.0867×AST−0.7167×HDL-C−0.0057×PLT+0.5880 if UACR ≥A2)/(1+[−7.6575+ 0.1889×BMI+0.0867×AST−0.7167×HDL-C−0.0050×PLT+0.5881 if UACR ≥A2]).
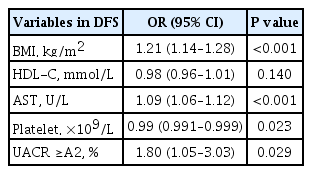
DFS for ≥F3 Fibrosis in Study Participants Derived from Repeated Fivefold Cross-Validated Logistic Regression Analysis in the Training Set (n=543)

Performance of DFS to Identify ≥F3 Fibrosis in Study Participants in the Training Set Using Different Cut-off Values (n=543)
In dominance analysis, the relative importance of each variable in DFS, in descending order, was AST (R2=0.138), BMI (R2=0.108), albuminuria (R2=0.018), platelet count (R2=0.016), and HDL-C levels (R2=0.011). DFS identified ≥F3 fibrosis on TE with an AUROC of 0.85. We derived three DFS cut-off values based on a prevalence of 17.7% for ≥F3 fibrosis on TE, a rate that was previously reported in a study of NAFLD with type 2 diabetes in Hong Kong [19]. These included a low DFS cut-off of 0.1 with 90% sensitivity, 58.1% specificity, 35.1% PPV, and 96.8% NPV; a high DFS cut-off of 0.3 with 90% specificity, 56.7% sensitivity, 54.9% PPV, and 90.6% NPV, as well as an optimal cut-off based on Youden index of 0.2, which yielded 80.8% sensitivity, 78.8% specificity, 45% PPV, and 90.6% NPV (Tables 4, 5). Using the optimal DFS cut-off of 0.2, 31.3%, and 30.6% of the participants had ≥F3 fibrosis in the training and testing sets, respectively.
DFS was more accurate than conventional scores for identifying the risk of AF on TE in patients with type 2 diabetes
In both training and testing sets, the AUROCs of DFS were significantly higher than any of the conventional fibrosis scores (Fig. 1). In the testing set of 232 participants, the AUROC of DFS to identify ≥F3 fibrosis on TE was 0.81, which was better than that of APRI (0.73, P=0.03), FIB-4 (0.56, P<0.001), or NFS (0.54, P<0.001). Application of the low, optimal and high DFS-cut-offs of 0.1, 0.2, and 0.3 to the testing sample yielded similar performance as observed in the training set. DFS, irrespective of the cut-off used, provided superior NPVs (more than 90%) than any of the conventional fibrosis scores with similar PPV (Table 6). In a subgroup analysis with participants stratified by the median HbA1c cut-off of 7.5%, the diagnostic performance of DFS was also similar among those with HbA1c above and below 7.5% in both training and testing sets (Table 7).
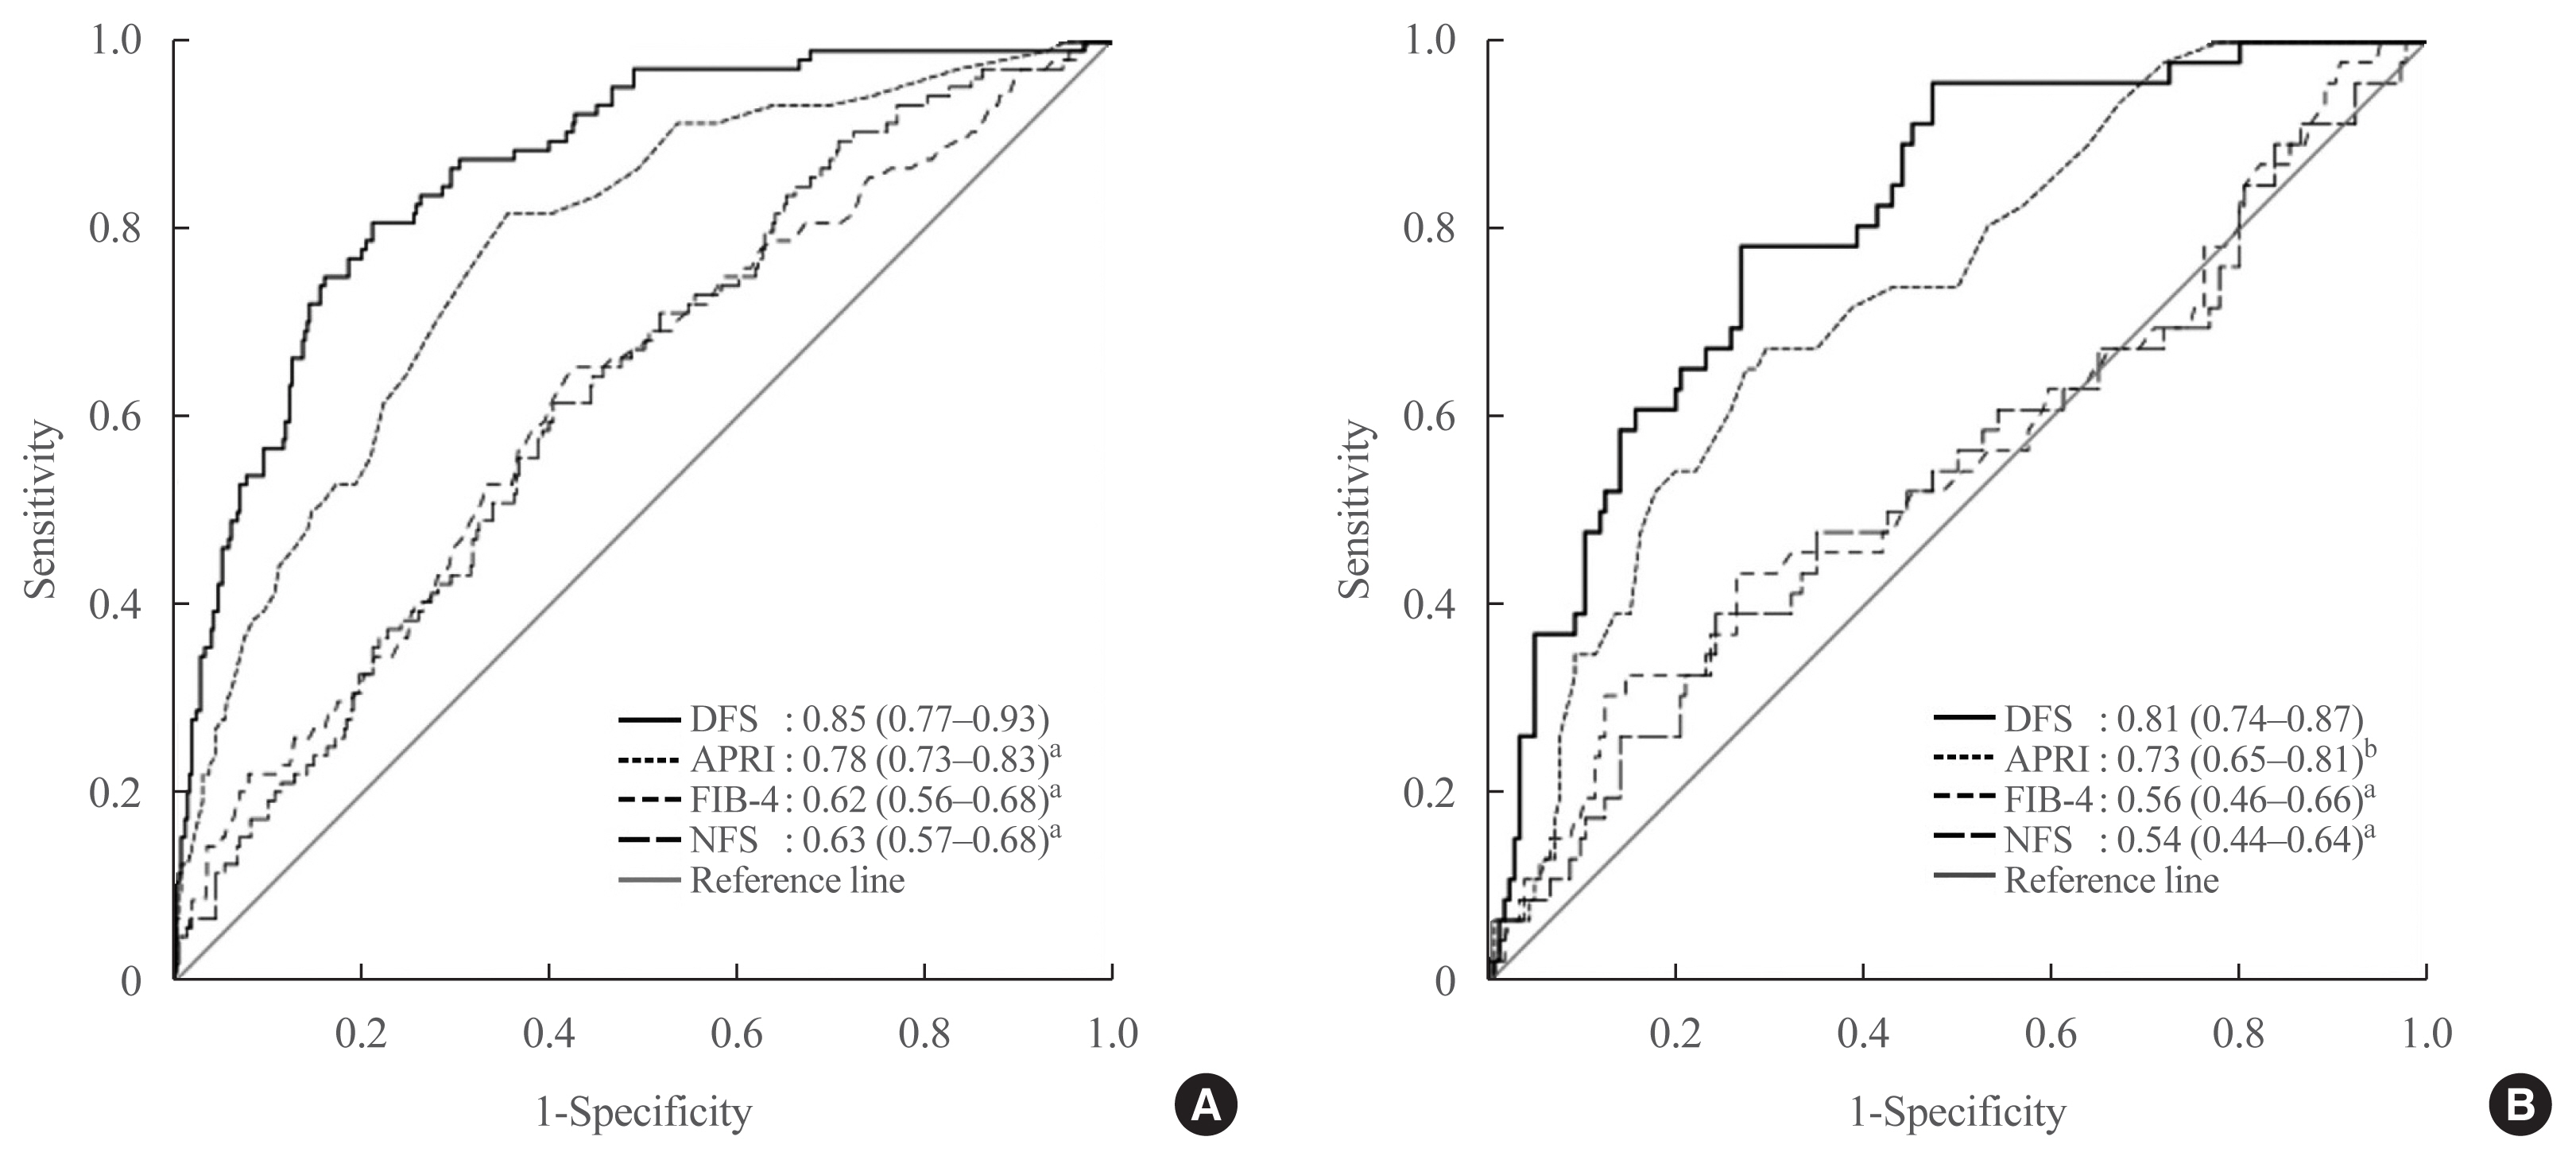
Receiver operating characteristic curves of diabetes fibrosis score and conventional fibrosis scores for the identification of ≥F3 fibrosis on transient elastography in study participants of the (A) training and (B) testing sets. Data shown were area under the receiver operating characteristic curve of each non-invasive fibrosis score with 95% confidence interval in parentheses. DFS was used as referent for comparison with each conventional non-invasive fibrosis score. DFS, diabetes fibrosis score; APRI, aspartate aminotransferase-to-platelet ratio index; FIB-4, fibrosis-4; NFS, non-alcoholic fatty liver disease (NAFLD) fibrosis score. aP<0.001; bP<0.05.
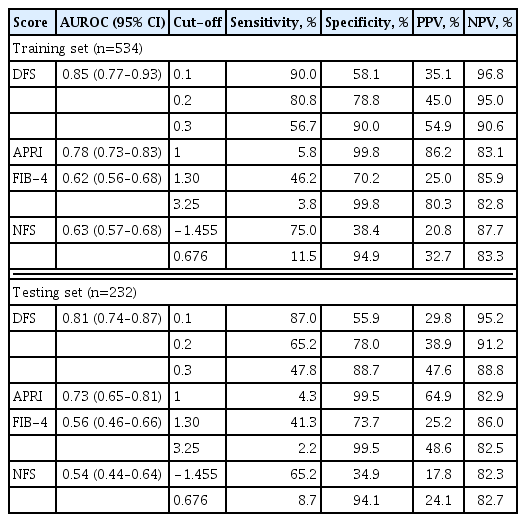
Diagnostic Performance of Diabetes Fibrosis Score and Conventional Fibrosis Scores to Identify ≥F3 Fibrosis on Transient Elastography in Training and Testing Sets

Subgroup Analysis Showing the Diagnostic Performance of DFS to Identify ≥F3 Fibrosis, with Participants Stratified by the Median HbA1c Cut-off in Training and Testing Sets
We also performed further analyses that defined ≥F3 fibrosis at a lower LS cut-off of ≥8.0 kPa (M Probe) and ≥5.8 kPa (XL Probe), or included only participants with more severe steatosis defined as CAP ≥288 dB/m [19,21,22]. The AUROC of DFS in both analyses, although attenuated, remained superior to most conventional fibrosis scores, with NPVs more than 90% regardless of the cut-off used (Supplemental Tables S1, S2).
DISCUSSION
Although TE is advocated as a reliable and accurate surrogate of liver biopsy, it is not readily available in most diabetes clinics [23,24]. In this study, we have developed DFS based on TE, a non-invasive fibrosis score specifically for use in patients comorbid with type 2 diabetes and NAFLD. We demonstrated that DFS was superior to conventional fibrosis scores in identifying those, among the large number of patients with type 2 diabetes, who would have ≥F3 fibrosis on TE and therefore indicated for referral to hepatologists for further investigations. In addition, the high NPV of DFS was particularly useful to screen out those without AF in type 2 diabetes.
In this study, DFS performed better than three commonly used non-invasive fibrosis scores, APRI, FIB-4, and NFS, in identifying AF in patients comorbid with type 2 diabetes and NAFLD. One possible explanation was that DFS, unlike the other three fibrosis scores, was developed on data obtained from patients with type 2 diabetes. Furthermore, DFS, but not the others, included albuminuria, another chronic diabetic complication. It should be noted that a close relationship exists between NAFLD and chronic kidney disease in type 2 diabetes [25–27]. In this study, we further demonstrated that albuminuria was an independent determinant of LS measurements in patients with type 2 diabetes. Indeed, albuminuria was the third most important variable in DFS based on dominance analysis.
To our knowledge, DFS is among the very few non-invasive fibrosis scores specifically developed for patients with type 2 diabetes [28–30]. In 2015, Bazick et al. [28] developed a clinical model using 446 patients with type 2 diabetes and biopsy-proven NAFLD from the NASH Clinical Research Network studies. The model identified AF on liver histology with an AUROC of 0.803, 57% sensitivity, 80.2% PPV, and 75.1% NPV, with a fixed 90% specificity. That model, however, required a total of 13 clinical parameters for calculation, including age, BMI, waist-to-hip ratio, albumin, globulin, alkaline phosphatase, AST, ALT, direct and total bilirubin levels, haematocrit and platelet counts, as well as serum insulin, a parameter not routinely measured in clinical practice [28]. A subsequent French study involving a community-based population of 669 participants with type 2 diabetes developed a predictive score for significant fibrosis (i.e., ≥F2), based on age, BMI and serum gamma-glutamyl transpeptidase (GGT) levels and yielded an AUROC of 0.712 [29]. Recently, a clinical prediction model with AUROC of 0.86, similarly for AF on liver histology in type 2 diabetes, was reported by Bril et al. [30]. This model, though much simpler, consisted of the measurement of cytokeratin-18 (CK-18) levels, which is also not readily available in routine clinical settings. Moreover, DFS, with an AUROC of 0.85 and 0.81 in the training and testing sets, respectively, was developed as a first-line tool to optimize risk stratification among patients with type 2 diabetes for further hepatic investigations, especially in clinics where even TE is not available. Most importantly, DFS only required BMI, AST and HDL-C levels, platelet count and albuminuria category, five clinical parameters commonly measured as part of the standard of care in diabetes management [31,32]. Therefore, the use of DFS could facilitate a convenient and potentially more cost-effective risk stratification strategy, given the large volume of patients comorbid with type 2 diabetes and NAFLD.
Previous studies have shown that high serum triglyceride and low HDL-C levels were associated with NAFLD [33]. Indeed, in our study, participants with ≥F3 fibrosis had significantly higher serum triglyceride and lower HDL-C levels than those without. However, statistically, we found that the inclusion of HDL-C, but not triglyceride levels, into the clinical model resulted in the best performance, as reflected by the lowest AIC values, and was therefore included in DFS.
The strengths of the current study include the wide spectrum of NAFLD severity represented in our study population, well characterized diabetic complications profile in all study participants. It also takes into consideration anti-diabetic agents with reported beneficial effects in NAFLD, such as pioglitazone, glucagon-like peptide-1 receptor agonists and sodium glucose co-transporter 2 inhibitors [34–37].
There were, however, some limitations in our study. First, the outcome of AF was based on TE but not on liver biopsy. Nonetheless, in our study, the prevalence of ≥F3 fibrosis on TE in our study population was 19.6%, a rate similar to those reported in studies that staged hepatic fibrosis using liver histology [30]. Secondly, our findings that were derived from an exclusively Chinese, hospital clinic-based population might not be generalizable to patients of other ethnic groups, or with less complicated diabetes and shorter disease duration. Third, some biochemical parameters such as GGT and insulin levels were not measured in our cohort, rendering it difficult to compare the performance of DFS with other recently developed non-invasive fibrosis tests [28,29]. Moreover, the PPVs of DFS were low, being only 30% to 50%. However, since DFS was developed to optimize risk stratification and streamline referrals to hepatologists for TE, a high NPV of more than >90% might be relatively more important. Finally, although DFS was internally validated with reproducible diagnostic accuracies, it should be externally validated using an independent population, preferably with a multi-ethnic cohort and larger sample size, to confirm our findings.
Over the years, NAFLD has gradually become an important, yet often overlooked, diabetic complication [38]. Importantly, given that more than 70% of patients with type 2 diabetes may be comorbid with NAFLD, and TE is not widely available, early risk stratification with a convenient and accurate non-invasive fibrosis test as the first line assessment would allow timely referral to hepatologists for further investigations. Where TE is available for patients of the diabetes clinic but involves a long waiting list, DFS can also be used to identify those who should be prioritized for earlier TE. Moreover, those with a greater likelihood of AF could be offered anti-diabetic agents that have been shown to improve hepatic fibrosis, liver dysfunction and/or steatosis, as well as new treatments for NAFLD when clinically available [34–35,37,39–41]. Although further studies are required to validate our findings, we have demonstrated that there is considerable potential to incorporate DFS, which consists of five simple measurements available in routine clinical practice, into the standard of care in diabetes management, to prevent the long-term adverse liver outcomes in patients with type 2 diabetes.
Supplementary Information
Diagnostic Performance of DFS and Conventional Fibrosis Scores to Identify ≥F3 Fibrosis in Training and Testing Setsa
Diagnostic Performance of DFS and Conventional Fibrosis Scores to Identify ≥F3 Fibrosis in Participants with CAP ≥288 dB/ma
Acknowledgements
This study was supported by funding from the State Key Laboratory of Pharmaceutical Biotechnology, University of Hong Kong, Hong Kong SAR, and research funding support from Mrs Cheung Chin Lan Hong and Dr Chadwick Lie.
Notes
CONFLICTS OF INTEREST
Wai-Kay Seto received research funding from Echosens. Other co-authors have no conflicts of interest.
AUTHOR CONTRIBUTIONS
Conception or design: C.H.L., K.S.L.L. Acquisition, analysis, or interpretation of data: W.K.S., K.I., D.T.W.L., C.H.Y.F., H.Y.W. Drafting the work or revising: C.H.L., W.S.C., Y.C.W., M.F.Y., K.S.L.L. Final approval of the manuscript: C.H.L., K.S.L.L.