Variabilities in Weight and Waist Circumference and Risk of Myocardial Infarction, Stroke, and Mortality: A Nationwide Cohort Study
Article information

Abstract
Background
Evidence regarding the association between variabilities in obesity measures and health outcomes is limited. We aimed to examine the association between variabilities in obesity measures and cardiovascular outcomes and all-cause mortality.
Methods
We identified 4,244,460 individuals who underwent health examination conducted by the Korean National Health Insurance Service during 2012, with ≥3 anthropometric measurements between 2009 and 2012. Variabilities in body weight (BW) and waist circumference (WC) were assessed using four indices including variability independent of the mean (VIM). We performed multivariable Cox proportional hazards regression analyses.
Results
During follow-up of 4.4 years, 16,095, 18,957, and 30,200 cases of myocardial infarction (MI), stroke, and all-cause mortality were recorded. Compared to individuals with the lowest quartiles, incrementally higher risks of study outcomes and those of stroke and all-cause mortality were observed among individuals in higher quartiles of VIM for BW and VIM for WC, respectively. The multivariable adjusted hazard ratios and 95% confidence intervals comparing the highest versus lowest quartile groups of VIM for BW were 1.17 (1.12 to 1.22) for MI, 1.20 (1.16 to 1.25) for stroke, and 1.66 (1.60 to 1.71) for all-cause mortality; 1.07 (1.03 to 1.12) for stroke and 1.29 (1.25 to 1.33) for all-cause mortality regarding VIM for WC. These associations were similar with respect to the other indices for variability.
Conclusion
This study revealed positive associations between variabilities in BW and WC and cardiovascular outcomes and all-cause mortality. Our findings suggest that variabilities in obesity measures are associated with adverse health outcomes in the general population.
INTRODUCTION
Obesity is a well-known risk factor for cardiovascular diseases (CVDs) and death [1]. Weight gain is strongly associated with adverse cardiovascular outcomes and mortality [2], and weight reduction is commonly recommended as lifestyle intervention in obese patients with such morbidities. However, recent longitudinal studies have reported the associations between changes in body weight (BW) and body mass index (BMI) and cardiovascular risk and mortality, with complex findings [3,4]. Repetitive weight loss and regain may be associated with an unhealthy body composition [5]. However, these approaches did not produce specific conclusions on the associations between variabilities in obesity measures and CVD and mortality.
Recently, intra-individual variability in various cardiometabolic measures has attracted increasing interest. Weight variability can affect glucose metabolism and inflammation, which are linked to type 2 diabetes and CVD [5]. However, limited studies have reported the longitudinal associations between variability in obesity measures and cardiovascular morbidity and mortality. Moreover, these studies have mostly been conducted in Western populations, with methodological discrepancies, and whether such variabilities are associated with worse prognosis remains controversial [6–9]. Most previous studies evaluating the associations between variability in obesity measures and cardiovascular events and mortality have primarily focused on variabilities in BW and BMI. To the best of our knowledge, no study has included waist circumference (WC) in the analysis. WC may be a better tool to assess body composition and visceral adiposity and to reflect cardiometabolic profiles [10].
Therefore, we examined the longitudinal associations between intra-individual variabilities in BW and WC and the risk of cardiovascular outcomes and all-cause mortality using a nationwide cohort covering the entire South Korean population.
METHODS
Data source and study population
This study was based on the database provided by the South Korean National Health Insurance Service (NHIS). The NHIS manages a mandatory universal health insurance program that covers approximately 97% of the South Korean population and retains a comprehensive health information dataset of 50 million Koreans, including data on demographics, health examinations, and medical treatment, procedures, and disease diagnoses according to the International Classification of Disease-10th Revision-Clinical Modification (ICD-10-CM) codes.
Among the 4,470,291 individuals aged ≥20 years who had undergone health examinations conducted by the South Korean NHIS between January 1, 2012 and December 31, 2012, we initially considered individuals who had undergone at least three health examinations between January 1, 2009 and December 31, 2012. We excluded individuals who were diagnosed with myocardial infarction (MI) or stroke within 5 years from enrollment (n=216,384) and those with missing data on health examinations and health behaviors (n=9,447). Finally, 4,244,460 individuals were enrolled. Flow diagram of study participants is shown in Fig. 1. This study adhered to the tenets of the Declaration of Helsinki; the study protocol was approved by the Institutional Review Board of the Korea University Anam Hospital (No. 2018AN0257). Anonymous and de-identified information was used; therefore, requirement for informed consent was waived.
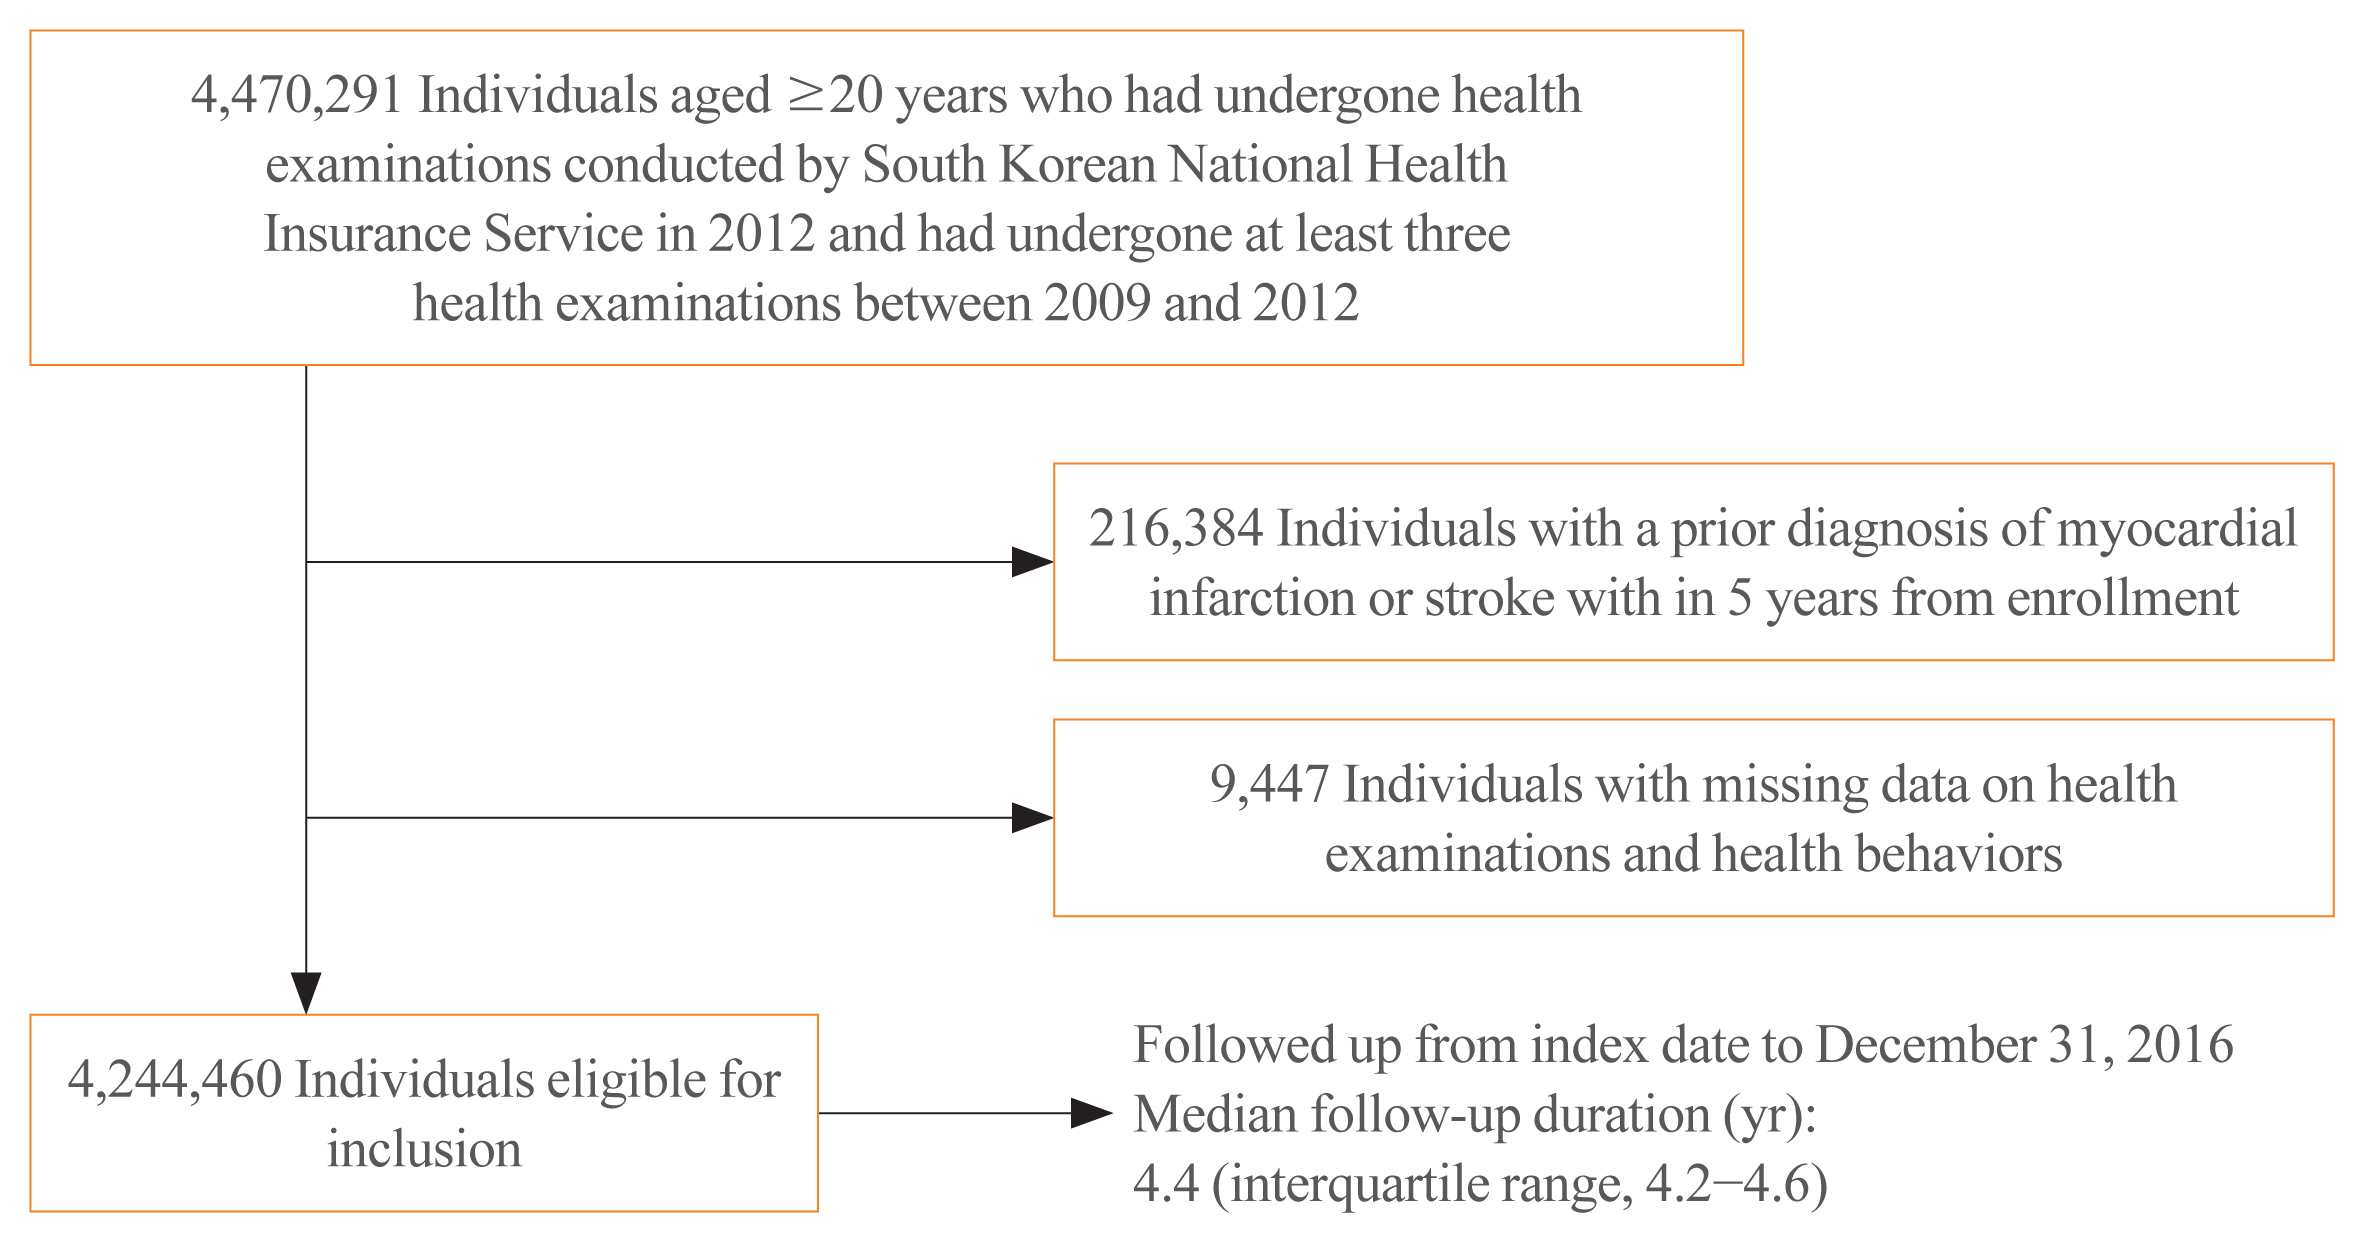
Flow diagram of study population.
Measures of variabilities in BW and WC
Anthropometric measurement was performed by trained staffs with the participants wearing light clothing. BW (kg) and height (cm) were measured using an electronic scale, and WC (cm) was measured at the narrowest point between the lower border of the rib cage and the iliac crest. BMI was calculated as BW (kg) divided by squared height (m). Individuals were categorized into five BMI groups based on the World Health Organization recommendations for Asian populations [11]. Participants were additionally classified into six groups at 5-cm intervals of WC. Variabilities in BW and WC were defined as intra-individual variabilities between measurements using the following four variability indices: (1) standard deviation (SD); (2) coefficient of variation (CV); (3) variability independent of the mean (VIM); and (4) average real variability (ARV). VIM was calculated as 100×SD/meanβ, where β is the regression coefficient, based on the natural logarithm of the SD over the natural logarithm of the mean [12]. ARV is the average of the absolute differences between consecutive values and was calculated using the following formula, where N denotes the number of anthropometric measurements [13].
Study outcomes and follow-up
The study endpoints were newly diagnosed MI, stroke, or all-cause mortality. MI was defined as the recording of ICD-10-CM codes I21 or I22 during hospitalization or these codes having been recorded at least twice. Stroke was defined as the recording of ICD-10-CM codes I63 or I64 during hospitalization with claims for brain magnetic resonance imaging or brain computerized tomography. All-cause mortality was assessed by extracting data from the Korean National Statistical Office. Participants without MI or stroke during their follow-up periods were considered to have completed the study at the date of their death or at the end of follow-up, whichever occurred first. The study population was followed up from the index date to the date of cardiovascular events (MI or stroke) or all-cause mortality, or until December 31, 2016, whichever occurred first.
Covariates
The demographics and lifestyles of the participants were assessed using standardized self-reported questionnaires. Household income level was dichotomized at the lowest 25% threshold. Smoking status was categorized as non-smokers, ex-smokers, or current smokers. An intake of ≥30 g of alcohol per day was defined as heavy alcohol consumption [14]. Regular exercise was categorized on the basis of ≥20 minutes of strenuous exercise ≥3 times per week or ≥30 minutes of moderate exercise ≥5 times per week. Baseline comorbidities were identified on the basis of combinations of health examination results, or ICD-10-CM and prescription codes. The presence of hypertension was defined as systolic/diastolic blood pressure (BP) ≥140/90 mm Hg or at least one claim per year for antihypertensive medication prescription under ICD-10-CM codes I10–I13, or I15. Diabetes mellitus (DM) was defined as fasting glucose level ≥126 mg/dL or at least one claim per year for an antidiabetic medication prescription under ICD-10-CM codes E11–E14. Dyslipidemia was defined as total cholesterol level ≥240 mg/dL or at least one claim per year for lipid-lowering medication prescription under ICD-10-CM code E78. Chronic kidney disease (CKD) was defined as estimated glomerular filtration rate <60 mL/min/1.73 m2, using the equation from the Modification of Diet in Renal Disease study [15].
Statistical analyses
Data were analyzed using the SAS software version 9.4 (SAS Institute, Cary, NC, USA). We reported the baseline characteristics of the study population according to the quartiles of VIM for BW as mean±SD, median (interquartile range), or number (percentage). The incidence rate of outcomes was calculated by dividing the number of events by 1,000 person-years. We plotted Kaplan-Meier curves for incidence probabilities of the outcomes according to the quartile groups of BW and WC variabilities and performed log-rank test to compare differences between groups. Multivariable Cox proportional hazards regression models were used to evaluate the risk of the outcomes, according to the quartiles of all variability indices for BW and WC, compared to the lowest quartile of the indices. Hazard ratios (HRs) and 95% confidence intervals (CIs) were calculated. Model 1 was adjusted for age and sex, and model 2 was further adjusted for smoking status, alcohol intake, physical activity, and income. In model 3, variables from model 2 were further adjusted for hypertension, DM, dyslipidemia, CKD, number of measurement, and baseline BMI (or baseline WC). We also performed subgroup analyses by age, sex, BW change status, and smoking status; interaction of variabilities in BW and WC with subgroups was estimated. A P<0.05 was considered statistically significant.
RESULTS
Baseline characteristics
There were 16,095, 18,957, and 30,200 cases of MI, stroke, and all-cause mortality, respectively, during the median follow-up period of 4.4 years (interquartile range, 4.2 to 4.6) in the entire cohort. The characteristics of the study participants by quartiles of VIM for BW are presented in Table 1. Individuals in lower quartiles of BW variability were older and were more likely to be male, heavy alcohol drinkers, regular exercisers than those in higher quartiles of VIM for BW. Mean values of cardiometabolic parameters such as BP, fasting blood glucose, total cholesterol, and triglycerides, and prevalence of comorbidities increased in the lower quartile groups.
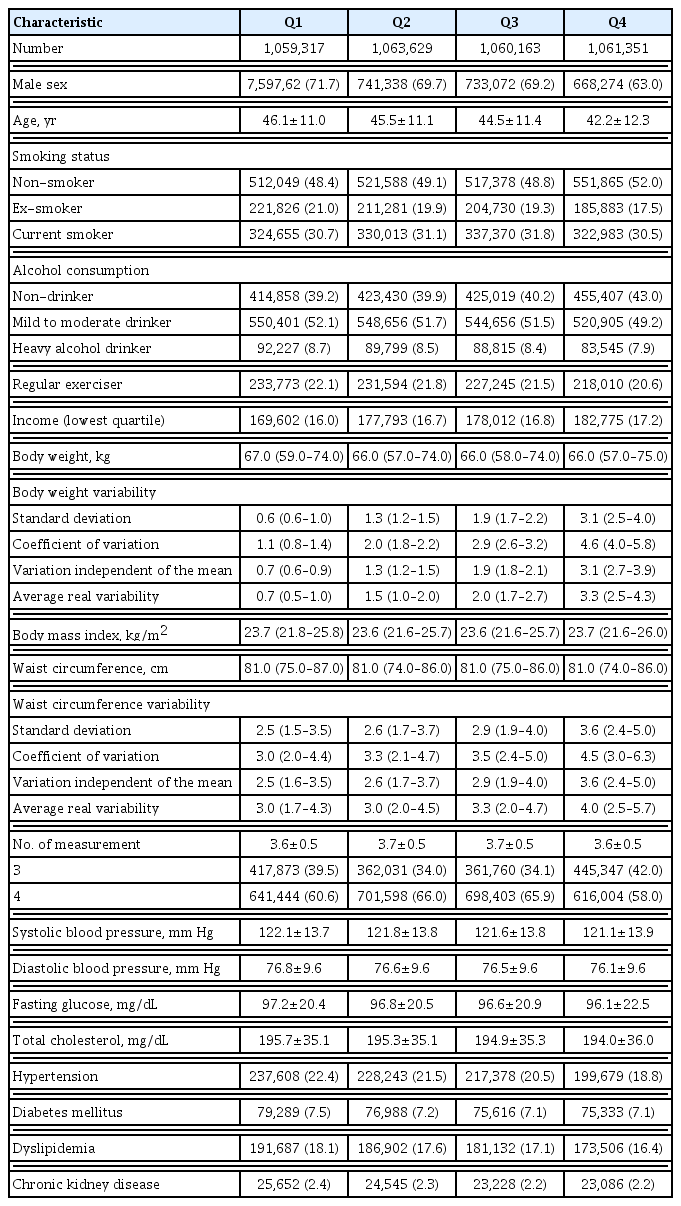
Baseline Characteristics According to Quartiles of Variability Independent of the Mean for Body Weight
Longitudinal associations between baseline BMI and WC, and the risk of MI, stroke, and all-cause mortality
Overweight and obese individuals had higher HRs for MI and stroke compared to those with a normal BMI (P<0.001). All-cause mortality risk showed a significantly inverse J-shaped association with BMI category (P<0.001). There were significantly positive associations between WC and the risk of MI and stroke, and a U-shaped association between WC and all-cause mortality risk was observed (P<0.001) (Supplemental Table S1).
Longitudinal associations between variabilities in BW and WC and the risk of MI, stroke, and all-cause mortality
The Kaplan-Meier curves in Supplemental Fig. S1 show that the incidence probabilities of all-cause mortality significantly increased in the higher quartile groups of VIM for BW (log-rank P<0.001). The incidence probabilities of stroke and all-cause mortality increased in the higher quartile groups of VIM for WC (log-rank P<0.001). Tables 2, 3 show the incidence and HR (95% CI) of MI, stroke, and all-cause mortality according to the quartile groups of VIM for BW and WC. Incrementally higher risks of all three outcomes were observed in higher quartiles of VIM for BW, compared with the lowest quartile (Q1) group in all models (all P for trend <0.001). Individuals in the highest quartile (Q4) group of VIM for BW exhibited 17%, 20%, and 66% higher risk of MI, stroke, and all-cause mortality than the risk in the Q1 group, after adjusting for all measured confounding variables (model 3). HRs of stroke and all-cause mortality significantly increased in higher quartile groups of VIM for WC, compared with the Q1 group (all P for trend <0.05). Individuals in the Q4 group of VIM for WC exhibited a 7% and 29% higher risk of stroke and all-cause mortality than that of individuals in the Q1 group, in model 3. The HR of MI significantly increased in Q4 of VIM for WC compared with Q1 group in model 1 and model 2; however, this association was attenuated after further adjustment for comorbidities and baseline WC. Similar findings were observed with regard to other variability indices including SD, CV, and ARV (Supplemental Table S2).

Risk of Myocardial Infarction, Stroke, and All-Cause Mortality by Quartiles of Variability Independent of the Mean for Body Weight
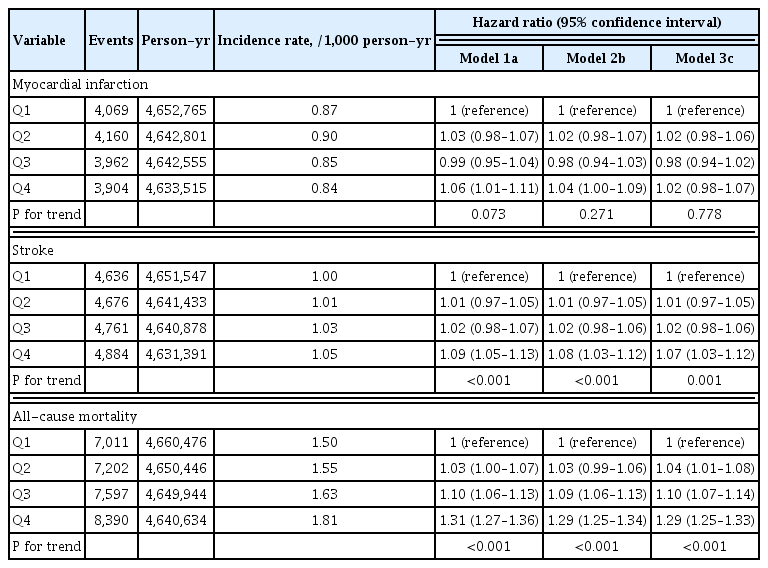
Risk of Myocardial Infarction, Stroke, and All-Cause Mortality by Quartiles of Variability Independent of the Mean for Waist Circumference
Subgroup analyses
Table 4 shows the HRs (95% CIs) of study outcomes in Q4 of VIM for BW and WC, compared with other groups (Q1–Q3) in subgroups. The associations between VIM for BW and MI were stronger among individuals older than 65 years, women, and non-smokers. The association of VIM for BW and WC with all-cause mortality was significantly stronger in patients with DM and nonsmokers. However, changes in smoking status were not associated with variabilities in obesity parameters and outcomes. Weight change status did not show any interactions, specifically in the association between variabilities in obesity parameters and the risk of MI and stroke (Supplemental Table S3). The association between BW variability and all-cause mortality risk was predominantly observed in the weight loss group (Supplemental Table S3).
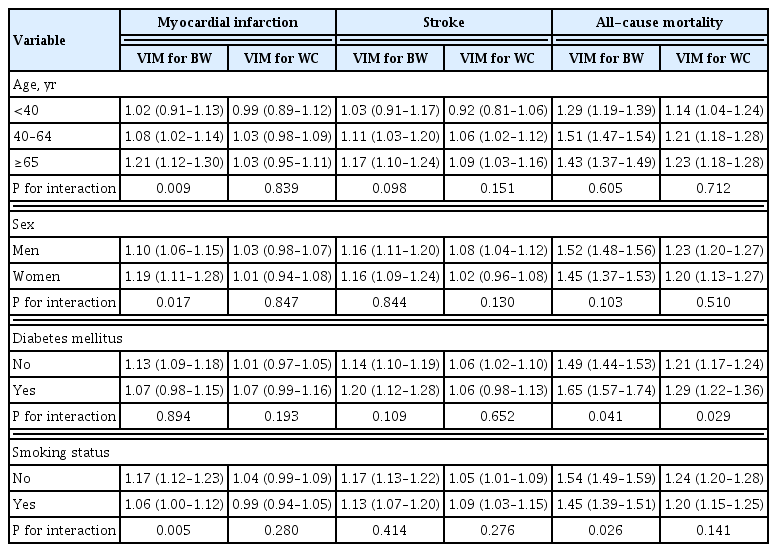
Risk of Outcomes by VIM of Obesity Measures (Q4 vs. Q1–Q3) in Subgroups
DISCUSSION
In this study, we found significant associations between baseline BMI and WC and the risk of MI, stroke, and all-cause mortality. There were positive associations between the variability in BW and the risk of the three outcomes. Variability in WC was significantly associated with the risk of stroke and all-cause mortality. These findings were consistent with different indices of variability, irrespective of adjustment for confounding variables including baseline BMI or WC. Our results suggest that variabilities in BW and WC may be independent risk factors for adverse health outcomes. This study provides epidemiologic evidence regarding the associations between variabilities in obesity measures and the risk of MI, stroke, and all-cause mortality in the general population of East Asia.
Several previous studies have investigated the associations between variabilities in obesity measures and risk factors for CVD and cardiovascular death, with conflicting results. Consistent with our findings, some studies showed that variabilities in BW negatively affect cardiovascular health [16–18]. However, a 10-year follow-up study conducted in the Japanese population revealed that BMI fluctuations based on root mean square error were not associated with any cardiovascular risk factors [19]. We attempted to define variabilities in obesity measures using various indices and observed consistent findings regarding all variability indices. Furthermore, in contrast to previous studies, we demonstrated consistent associations between variability in BW and the risk of major cardiovascular outcomes including MI and stroke, irrespective of individual cardiovascular risk factors. Previous studies have also reported inconsistent associations between BW and BMI variabilities and all-cause mortality. Some studies reported that variability in BW increases the risk of all-cause mortality; however, most of these studies assessed BW based on patient recalls, included significantly few measurements, or were conducted for a short duration [20,21]. Prospective studies with longer duration of follow-up, involving more sufficient measurements of BW, support our findings, reporting that BW variabilities increased the risk of all-cause mortality [6,9]. However, according to previous studies, the adverse effect of variability in BW was attenuated with long-term follow-up or after accounting for pre-existing diseases [7,8,22].
Notably, our study found positive associations between variability in WC and the risk of stroke and all-cause mortality. Although no study has previously assessed such associations, a few previous reports may partially explain our findings. A cohort study on Iranian men showed that more than 10% increase in the waist-to-hip ratio is prominently associated with mortality risk [23]. A retrospective cohort study in Japan indicated the deleterious effects of variability in body fat based on root mean square error of cardiovascular risk factors such as hypertension [24]. A study on participants of the Framingham Heart Study Third Generation cohort showed that increase in fat volume and decrease in fat attenuation were associated with increased risks of cardiovascular risk factors [25]. Collaborating findings from these studies and our study indicate the negative impact of variability in WC on health outcomes. Furthermore, as WC is a better predictor of CVD compared with BMI or waist-to-hip ratio, our results on the variability in WC are consistent with the findings observed in the previous studies regarding the variability in BW. However, some studies reported that changes or fluctuations in WC had no association with mortality risk or insulin resistance [26,27]. Meanwhile, the lack of association between variability in WC and MI in the general population may be attributed to the longer time required for fluctuation in WC to affect healthy individuals, or the “healthy population” effect. While the short period of observation for anthropometric measures may have some limitations, obesity parameters may be changed dynamically along the time period and therefore, longer time for the measurement may not reflect the all changes along the period and lead to biased measurement. However, further studies are required to confirm this finding accurately.
Although the underlying mechanisms of associations between variabilities in obesity measures and CVDs and all-cause mortality are unclear, possible explanations regarding the association may be as follows. Weight fluctuation and associated adipose tissue remodeling can have detrimental effects on various risk factors of CVD by accompanying abnormal excretion of proinflammatory adipokines, alteration in free fatty acid metabolism, poor vascularity, and cellular hypoxia [25,28]. A cohort study based on the data of the Coronary Artery Risk Development in Young Adults Study reported that greater coronary artery calcification is associated with weight fluctuations [29]. Aforementioned previous studies on variabilities in BW or WC and risk factors for CVD also support this explanation. Studies reported that individuals who had lost their weight more than 10 pounds showed lower cytotoxicity for natural killer cells than those who had not. Moreover, this finding was enhanced through an increased frequency of intentional loss in BW, which may be a major indicator of BW cycling [30].
The results of our subgroup analyses suggest interesting implications in the association between variabilities in obesity measures and the outcomes. Change in BW had some interactions with VIM for BW in all-cause mortality risk. The associations between VIM for BW and all-cause mortality were consistently stronger in nonsmokers and in individuals with DM than in current smokers and in individuals without DM, respectively. Further studies are required to reveal the mechanisms by which variabilities in BW and WC may cause adverse health effects according to pre-existing conditions.
The current study highlights the importance of stable body size, indicating that CVD and mortality risk increase with increased variabilities in obesity measures. It significantly contributes to the current literature by extending the understanding of the association between variabilities in WC and stroke and all-cause mortality by emphasizing the importance of stable WC beyond BW stability. The strong associations observed in nonsmokers suggest the importance of a stable body size in healthy population.
This study has several limitations. First, due to the retrospective design of this study, the causal association could not be confirmed from our findings; moreover, reverse causality may have existed, although we considered a washout period for defining the outcomes to overcome this issue. Second, BW and WC were measured for a relatively short period, and there might be different intervals among the measurements. Third, whether the weight loss of the participants was intentional or unintentional could not be verified due to insufficient data. Fourth, this study had a relatively short follow-up duration to observe the associations. Fifth, there may be potential selection bias because data of non-routine health examinations may be possibly included. Finally, our study was not able to account for comorbidities or risk factors (e.g., chronic inflammatory conditions, known coronary artery disease without MI, peripheral artery disease, family history, non-ischemic heart disease, pulmonary disease, cancer, and treatment or intensity of statin and antiplatelet agents) related to outcomes. Despite these limitations, our study used a significantly large sample covering the entire South Korean population to assess the associations between fluctuations in obesity measures and CVDs and mortality. Moreover, to the best of our knowledge, this is the first study assessing the effect of variabilities in WC on CVDs and mortality. The large sample size enabled us to consider comprehensive confounding variables, including sociodemographic and lifestyle factors and pre-existing diseases based on laboratory data and claims, and subgroup analyses. Assessment of BW and WC in our study was based on anthropometric measurements, while similar assessments in several previous studies were based on self-reported questionnaires. Moreover, our study assessed variabilities in BW and WC using various indices to overcome the limitation of each index and focused on VIM as a sensitive index for variability. Additionally, we observed consistent associations among the indices.
In conclusion, this large-scale longitudinal study revealed that variabilities in BW and WC are associated with an increased risk of MI, stroke, and all-cause mortality. Our findings suggest that variabilities in obesity measures may be predictors of future CVDs and mortality. Healthcare providers should promote a commitment to maintaining appropriate BW and WC to avoid their fluctuations and consider the histories of the patients’ body size while assessing risk status.
SUPPLEMENTARY MATERIAL
Supplemental Table S1.
HR (95% CI) of Myocardial Infarction, Stroke, and All-Cause Mortality by Baseline BMI and WC
Supplemental Table S2.
HR (95% CI) of Study Outcomes According to Quartiles of Variability Indices for BW and WC
Supplemental Table S3.
Risk of Study Outcomes by Quartiles of VIM for BW and WC in Weight Change Status Groups
Supplemental Fig. S1.
The Kaplan-Meier curves for incidence probabilities of study outcomes according to variabilities in obesity measures; Kaplan-Meier curves for the inci- dence probabilities of myocardial infarction (A), stroke (B), and all-cause mortality (C) according to quartiles of variability independent of the mean (VIM) for body weight; Ka- plan-Meier curves for the incidence probabilities of myocardial infarction (D), stroke (E), and all-cause mortality (F) according to quartiles of VIM for waist circumference.
Notes
CONFLICTS OF INTEREST
No potential conflict of interest relevant to this article was reported.
AUTHOR CONTRIBUTIONS
Conception or design: D.H.K., G.E.N., K.H., Y.G.P. Acquisition, analysis, or interpretation of data: D.H.K., G.E.N., K.H., Y.G.P. Drafting the work or revising: D.H.K., G.E.N., K.H., Y.H.K., K.Y.P., H.S.H., B.H., S.J.C., S.J.J., Y.J.Y., Y.K.R., K.H.C., Y.G.P. Final approval of the manuscript: D.H.K., G.E.N., K.H., Y.H.K., K.Y.P., H.S.H., B.H., S.J.C., S.J.J., Y.J.Y., Y.K.R., K.H.C., Y.G.P.