Articles
- Page Path
- HOME > Endocrinol Metab > Volume 35(4); 2020 > Article
-
Original ArticleClinical Study Cross-Sectional and Longitudinal Examination of Insulin Sensitivity and Secretion across Puberty among Non-Hispanic Black and White Children
-
Shannon E. Marwitz1
 , Megan V. Gaines1, Sheila M. Brady1, Sarah J. Mi1, Miranda M. Broadney1, Susan Z. Yanovski2, Van S. Hubbard2, Jack A. Yanovski1
 -
Endocrinology and Metabolism 2020;35(4):847-857.
DOI: https://doi.org/10.3803/EnM.2020.771
Published online: November 18, 2020
1Section on Growth and Obesity, Eunice Kennedy Shriver National Institute of Child Health and Human Development, Bethesda, MD, USA
2Division of Digestive Diseases and Nutrition, National Institute of Diabetes, Digestive, and Kidney Diseases, National Institutes of Health, Bethesda, MD, USA
- Corresponding author: Jack A. Yanovski. Section on Growth and Obesity, Eunice Kennedy Shriver National Institute of Child Health and Human Development, National Institutes of Health, Hatfield Clinical Research Center, Room 1-3330, 10 Center Drive, Bethesda, MD 20892-1103, USA, Tel: +1-301-496-0858, Fax: +1-301-480-4271, E-mail: jy15i@nih.gov
Copyright © 2020 Korean Endocrine Society
This is an Open Access article distributed under the terms of the Creative Commons Attribution Non-Commercial License (https://creativecommons.org/licenses/by-nc/4.0/) which permits unrestricted non-commercial use, distribution, and reproduction in any medium, provided the original work is properly cited.
ABSTRACT
-
Background
- Few studies using criterion measures of insulin sensitivity (SI) and insulin secretory capacity (ISC) have been conducted across puberty to adulthood. We examined how SI and ISC change from pre-puberty through adulthood.
-
Methods
- Hyperglycemic clamp studies were performed in a convenience sample of non-Hispanic Black (NHB) and White children evaluated at age 6 to 12 years and at approximately 5-year intervals into adulthood (maximum age 27 years). SI and ISC (first-phase and steady-state insulin secretion) were determined cross-sectionally in 133 unique participants across puberty and in adulthood. Additionally, longitudinal changes in SI and ISC were compared at two timepoints among three groups defined by changes in pubertal development: pre-pubertal at baseline and late-pubertal at follow-up (n=27), early-pubertal at baseline and late-pubertal at follow-up (n=27), and late-pubertal at baseline and adult at follow-up (n=24).
-
Results
- Cross-sectionally, SI was highest in pre-puberty and early puberty and lowest in mid-puberty (analysis of covariance [ANCOVA] P=0.001). Longitudinally, SI decreased from pre-puberty to late puberty (P<0.001), then increased somewhat from late puberty to adulthood. Cross-sectionally, first-phase and steady-state ISC increased during puberty and decreased in adulthood (ANCOVA P<0.02). Longitudinally, steady-state and first-phase ISC increased from pre-puberty to late puberty (P<0.007), and steady-state ISC decreased from late puberty to adulthood. The NHB group had lower SI (P=0.003) and greater first-phase and steady-state ISC (P≤0.001), independent of pubertal development.
-
Conclusion
- This study confirms that SI decreases and ISC increases transiently during puberty and shows that these changes largely resolve in adulthood.
- Adolescence is considered a high-risk period for the development of type 2 diabetes, particularly among individuals belonging to racial and ethnic minority populations in the United States, including those who are non-Hispanic Black [1]. Lower insulin sensitivity during sexual maturation has long been considered one of the factors that increase insulin demand and unmask disorders of glucose homeostasis. Decreased insulin sensitivity during puberty was first reported in 1986 [2]. Since then, a reduction of insulin sensitivity and a compensatory increase in insulin secretory capacity during puberty have been frequently described, with insulin sensitivity decreasing from pre-puberty, reaching a nadir mid-puberty, and returning to near pre-pubertal levels by the end of puberty [3–7]. However, most of the studies examining puberty-associated changes in insulin sensitivity and insulin secretory capacity have been cross-sectional in nature [2,3,5,6,8–10]. Few studies have followed children longitudinally to assess changes in insulin sensitivity and insulin secretory capacity [11,12]. Many such investigations have not used criterion measures of insulin sensitivity or insulin secretory capacity [4,7,13–16], or have had a small sample size [12,17]. Hannon et al. [17] used sophisticated glucose clamp techniques and longitudinally followed nine children from pre-puberty to mid-/late-/post-puberty, finding lower insulin sensitivity and greater insulin secretion during puberty. Therefore, there is a need for longitudinal studies of larger cohorts using criterion measures of insulin sensitivity and secretion. Another open question is if there are race-dependent differences in how insulin sensitivity and secretion change throughout puberty. Although an earlier appearance of puberty’s clinical signs is found among non-Hispanic Black than among non-Hispanic White children [18,19], it is unclear if there are important differences in insulin sensitivity or insulin secretory capacity attributable to how puberty manifests in non-Hispanic Black and non-Hispanic White adolescents that might contribute to the greater risk of type 2 diabetes in non-Hispanic Black adolescents during puberty. The aim of the present analysis was therefore to examine how insulin sensitivity and insulin secretory capacity, as estimated using hyperglycemic clamps, change across pubertal stages and into adulthood in non-Hispanic Black and non-Hispanic White children. We hypothesized that longitudinal assessments of insulin sensitivity and insulin secretory capacity would demonstrate that pre-pubertal and early-pubertal children exhibit decreased insulin sensitivity and increased insulin secretory capacity during late puberty and that there would be improved insulin sensitivity and insulin secretory capacity among those who were studied again as adults, but that pubertal developmental stage would not have different effects on insulin sensitivity or insulin secretory capacity in non-Hispanic Black versus non-Hispanic White children.
INTRODUCTION
- Participants
- This study was approved by the National Institute of Child Health and Human Development (NICHD) Institutional Review Board and registered at https://clinicaltrials.gov as NCT00001522. Signed informed consent and assent were obtained from parents and children, respectively.
- The investigation is a secondary analysis of participants in a 15-year longitudinal study, which was designed to examine differences in body weight and glucose homeostasis among non-Hispanic Black and non-Hispanic White children. Non-Hispanic Black and non-Hispanic White children 6 to 12 years of age were recruited using advertisements, mailings, and referrals from local physicians as previously described [20]. Children were either overweight (body mass index ≥85th percentile based on US National Health and Nutrition Examination Survey standards [21] or non-overweight but with two overweight (BMI ≥25 kg/m2) parents. Participants were enrolled only if they reported that all four of their grandparents were either non-Hispanic Black or non-Hispanic White. All of the children were otherwise healthy at baseline with normal history and physical examinations and blood chemistry (other than mild elevations of lipids, insulin, or liver enzymes commonly observed in children with obesity), and not taking medications known to affect weight or eating behavior. Subjects were seen at the National Institutes of Health Clinical Research Center at baseline and approximately every 5 years thereafter for a physical examination that included assessment of pubertal stage, body composition, and performance of a hyperglycemic clamp study. Participants were compensated for their time and inconvenience. Participants continued to be followed in the study even if they elected not to undergo a clamp study at one or more follow-up visits.
- Two data analyses were performed: a cross-sectional analysis comparing unique individuals across puberty, and a longitudinal analysis comparing changes across time in participants with data from two clamps. The cohort for the cross-sectional analysis was constructed from among all participants who completed at least one hyperglycemic clamp. Participants who had completed at least two clamps were considered for inclusion in the longitudinal analysis (see results). Because more participants underwent a clamp when they were pre-pubertal or in early puberty, the following selection strategy was used to place participants into the different groups: (1) participants who had clamps at later stages of pubertal development were placed in later pubertal stage groups; (2) without regard to their clamp insulin sensitivity or secretion results, participants with more than one possible group were allocated to attempt to minimize differences in sex, race, and body fat percentage and achieve sample sizes >15 per group.
- Body composition
- Body fat percentage was assessed using dual-energy X-ray absorptiometry (DXA), using the Hologic QDR2000 in pencil beam mode pediatric with software version 5.64 from 1997 to 3/30/2001 and using the QDR4500A instrument in fan beam mode analyzed with pediatric software version 11.2 (Hologic Inc., Bedford, MA, USA) since 2001. Based on the greater known underestimation relative to deuterium dilution for this version of the QDR4500A software, the fat mass measurements of both boys and girls studied with the QDR4500A instrument were adjusted using the following equation: adjusted fat mass= 1.124×(measured fat mass)−0.819 [22]. In four cases (one girl, three boys), air displacement plethysmography (Bod Pod, Life Measurement Inc., Concord, CA, USA) was used to measure fat mass because DXA was not obtained contemporaneously with clamps. The Bod Pod value for percentage fat mass of the girl was adjusted for the known underestimation in girls [23] to be 103% of the measured value. Height was measured in triplicate by a calibrated stadiometer and weight was measured to the nearest 0.1 kg using a calibrated scale.
- Pubertal status
- Physical examination was performed by a trained endocrinologist or nurse practitioner [24]. For girls, pubertal status was assigned based on both inspection and palpation of the breast to one of the five stages of Tanner [25]. For boys, testicular volume was estimated according to the method of Prader [26]. The overall genital stage in boys was not recorded for this study. Girls with Tanner breast stage 1 and boys with testes ≤3 mL were considered pre-pubertal and classified as pubertal group I. Girls with Tanner breast stage 2 and boys with testes >3 to <10 mL were considered to be in early puberty and classified as pubertal group II. Girls with Tanner breast stage 3 and boys with testes ≥10 to <15 mL were considered to be in mid-puberty and classified as pubertal group III. Girls with Tanner breast stage 4 and boys with testes ≥15 to <25 mL were considered to be in late puberty and classified as pubertal group IV. Girls with Tanner breast stage 5 and boys with testes ≥25 mL were considered end-pubertal and classified as pubertal group V. Adult participants (age >18 years) had all achieved pubertal group IV or V when last examined. If there was discordance between right and left breast stages or testis volumes, the higher pubertal stage was assigned. Tanner staging for pubic hair was also performed, however due to the high concordance with thelarche/gonadarche measures (Pearson’s correlation coefficient=0.887), pubic hair Tanner stage was not included in the analyses. Serum estradiol was measured by electrochemiluminescence immunoassay on a Roche Cobas analyzer (Roche, Basel, Switzerland; sensitivity 5 pg/mL, interassay CV 1.6% to 2.5%, intraassay CV 3.5% to 5.7%). A chemiluminescent immunoassay on a Siemens Immulite 2,500 analyzer was used to measure total testosterone (Siemens, Munich, Germany; sensitivity 20 ng/dL, interassay CV 10.1% to 10.9%, intraassay CV 5.1% to 10.1%).
- Hyperglycemic clamps
- The hyperglycemic clamp study procedure has been previously described [27]. Participants were admitted overnight to ensure fasting. Dextrose (0.19 g/kg) was infused over 2 minutes to raise plasma glucose acutely to approximately 225 mg/dL. A variable infusion of 20% dextrose was then used to achieve a target glucose concentration of 200 mg/dL (±10%) for 120 minutes. As previously detailed [27], insulin was measured at 5, 7.5, 10, 12.5, and 15 minutes and then every 15 minutes from 15 to 120 minutes (Immulite 2000 by Diagnostic Production Corporation [DPC], Los Angeles CA, USA); the mean inter- and intra-assay coefficients of variation were both <7.5%. Plasma glucose was measured at the bedside using a glucose analyzer (Yellow Springs Instrument, Yellow Springs, OH, USA), calibrated to within 5% of multiple glucose standards (50, 100, 125, 150, 250, and 500 mg/dL) before each study.
- Insulin secretion and sensitivity
- First phase insulin secretory capacity was calculated as the average of insulin concentrations obtained during the first 15 minutes of the clamp. Steady-state insulin secretory capacity (I) was calculated as the average of insulin concentrations obtained during second hour of the clamp (60 to 120 minutes). The infusion rate of exogenous glucose, corrected for urinary glucose losses and over- or under-filling of the glucose space, provided a measure of whole body glucose uptake (M). M/I served as the measure of insulin sensitivity.
- Statistical analysis
- Statistical analyses were performed using IBM SPSS version 23.0 Statistics (IBM Co., Armonk, NY, USA). Insulin sensitivity, first-phase insulin secretion, and steady-state insulin secretion were non-normal and transformed by the common log to achieve normality. The arcsine square root transformation was performed on body fat percentage to achieve normality.
- For both cross-sectional and longitudinal cohorts, analysis of variance (ANOVA) was performed to compare age, sex hormone concentrations, and baseline percentage body fat; the chi-square test was performed to compare race and sex composition among groups. The post hoc Fisher least significant difference test was performed to examine differences among pubertal stage groups when pubertal stage was a significant contributor (P< 0.05) to the analysis. For cross-sectional participants, analysis of covariance (ANCOVA) was used to compare insulin sensitivity, first phase insulin secretion, and steady state insulin secretion among groups (pubertal groups I through V and adults). Covariates included sex, race, fat percentage, and a factor for the method/machine used to measure body composition (removing this factor from the analyses did not affect results). Longitudinal analyses compared the results of three groups that were assembled based on having a sufficient (>15) sample size and to be of interest based on transitions in pubertal staging: one group was pubertal group I at baseline and pubertal group IV or V at follow-up, the second group was pubertal group II or III at baseline and IV or V at follow-up, and the third group was pubertal group IV or V at baseline and restudied 4 to 10 years later when the participants were adult. ANCOVA was used to compare insulin sensitivity, first phase insulin secretion, and steady state insulin secretion among the three groups at each time point (baseline and follow-up). Covariates included sex, race, method of body composition analysis, and fat percentage at visit. ANCOVA was also used to examine if change in insulin sensitivity, first-phase insulin secretion, or steady-state insulin secretion differed among the three studied groups, accounting for sex, race, method of body composition determination, fat percentage at baseline, and change in fat percentage.
METHODS
- Participants
- Subject characteristics for the cross-sectional and longitudinal cohorts are provided in Tables 1, 2, respectively. The protocol enrolled 246 children from 1996 to 2009 and studied participants until 2017. A total of 152 individuals completed at least one hyperglycemic clamp study and were evaluated for inclusion in cross-sectional analyses. Of these, 19 were excluded due to missing data (body composition or pubertal staging separated by more than 3 months from their clamp, or because of hemolysis of insulin samples that rendered the clamp uninterpretable). In total, 110 study participants underwent at least two clamp studies. There were 90 participants with at least two interpretable clamps performed who were considered for inclusion in the longitudinal analysis. Of these, 78 had a baseline and a follow-up clamp obtained at the paired pubertal stages that were statistically analyzed. The 12 individuals not included in this analysis because they had clamps obtained, for example only at pubertal stage II and adulthood, did not differ significantly in sociodemographic factors from those whose data were included.
- Cross-sectional findings
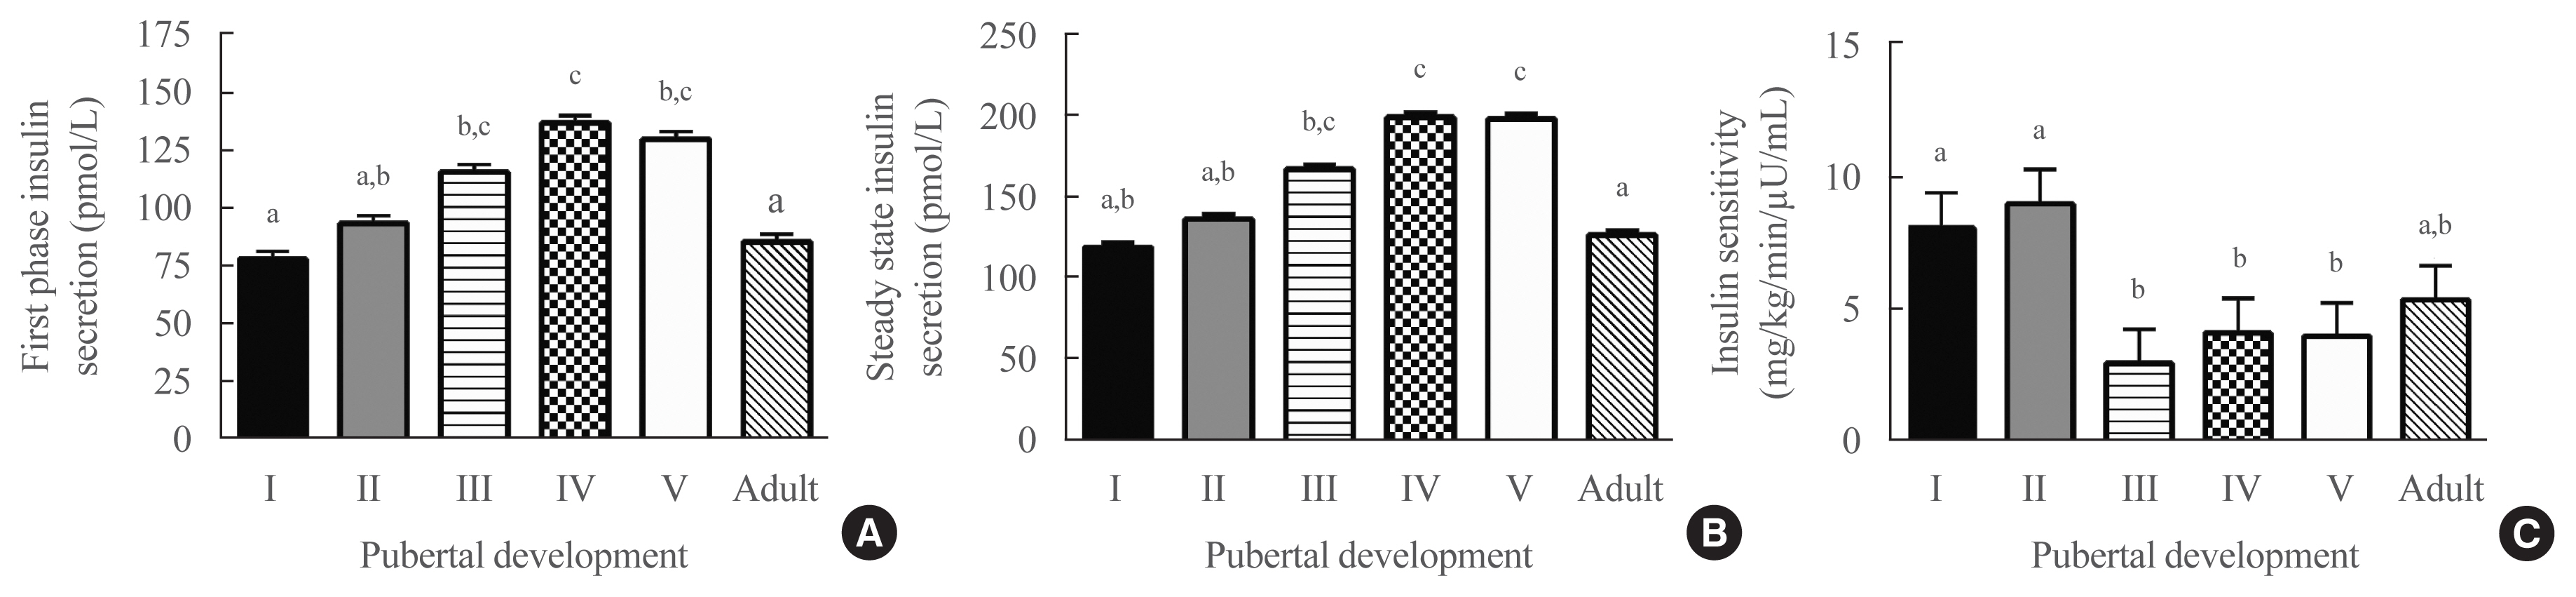
- The characteristics of the cross-sectional cohort are presented in Table 1. As expected, age was significantly greater for each higher pubertal group. Sex hormone concentrations also increased across puberty for both sexes (Table 1). There were no significant differences in race, sex, or percentage body fat between the groups. The unadjusted values for first-phase insulin secretory capacity, steady-state insulin secretory capacity, and insulin sensitivity are also presented in Table 1. Glucose concentrations were successfully maintained at the target concentration (200 mg/dL; 11.1 mmol/L) during the last hour of sampling (Supplemental Fig. S1).
- Cross-sectionally, after adjusting for covariates (including fat mass, which was a significant covariate, P<0.001, for all models), pubertal development was a significant predictor of first-phase insulin secretory capacity (P=0.02) (Fig. 1A), steady-state insulin secretory capacity (P<0.001) (Fig. 1B) and insulin sensitivity (P<0.004) (Fig. 1C). Insulin sensitivity was highest in pubertal groups I and II, lowest in groups IV and V (P<0.05 vs. groups I and II), and somewhat higher in adulthood, such that insulin sensitivity was not significantly different in adulthood compared to groups I and II. Fat percentage and race were significant covariates in all three models. Those with higher fat percentage and who were non-Hispanic Black had significantly greater insulin secretory capacity and lower insulin sensitivity. Sex was a significant covariate only in the model for first-phase insulin secretory capacity, with lower secretion in females.
- Longitudinal findings
- The characteristics of the longitudinal cohort are presented in Table 2. The pre-pubertal at-baseline group (group 1) had significantly less body fat at baseline than those who were early/mid-pubertal at baseline (group 2) or in pubertal group V at baseline group (group 3), and had a greater increase in percentage body fat at follow-up than group 2. There were no significant between-group differences in race or sex. Without adjustment for covariates (Table 2), at baseline, first phase and steady state insulin secretory capacity were significantly lower and insulin sensitivity was higher in group 1 than either group 2 or 3 (P<0.002). At follow-up (Table 2), first-phase and steady-state insulin secretion were significantly higher in group 2 (P<0.004) but insulin sensitivity did not differ significantly among groups (P=0.542).
- After adjusting for age, sex, and fat mass (Table 3), those who were pre-pubertal at baseline (group 1) had significantly lower baseline first phase and steady state insulin secretion (P<0.05) than those in mid-puberty at baseline (group 2) or those who were in pubertal group V at baseline (group 3), although insulin sensitivity did not differ significantly among groups. At follow-up, there were no significant differences among the groups.
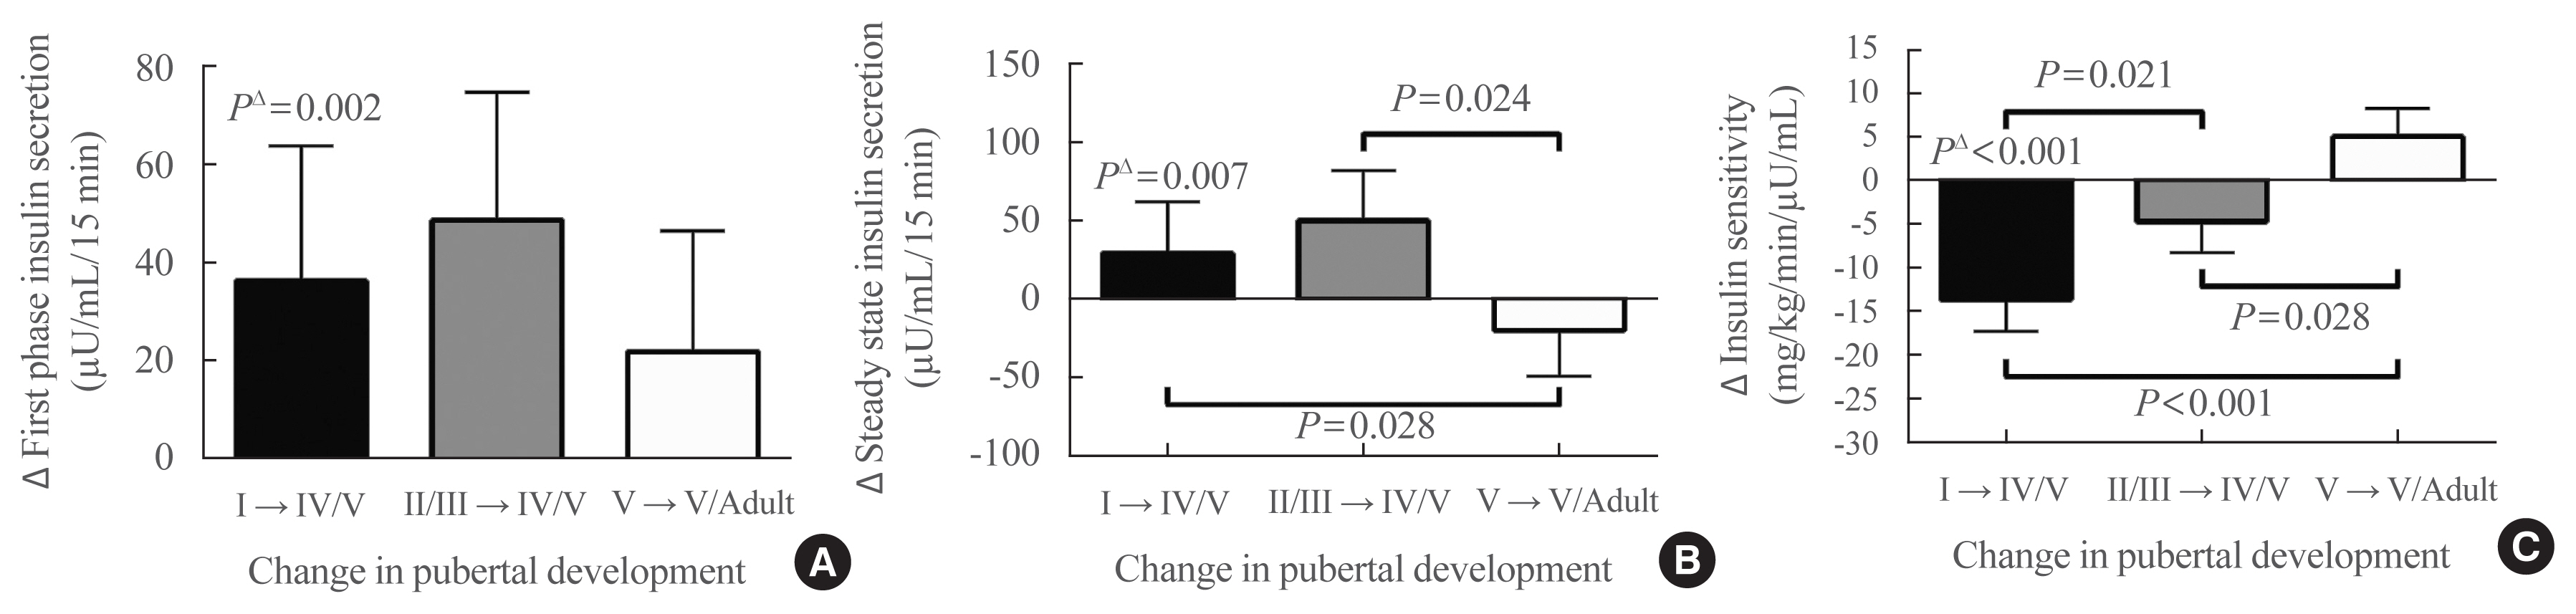
- When individual changes between baseline and follow-up of clamp-derived indices of insulin secretion were examined, after adjusting for race, sex, lean mass, methods of body composition determination, baseline fat mass, and change in fat mass, first-phase insulin secretion (Fig. 2A) significantly increased for group 1 from pre-puberty to late puberty (puberty group I→IV/V, P=0.002), but did not increase significantly for group 2 from early puberty to late puberty (puberty group I/IIII→IV/V P=0.70), or for group 3 from late puberty to adulthood (puberty group V→adult P=0.40). Steady-state insulin secretion (Fig. 2B) also significantly increased from pre-puberty to late puberty (P=0.007), but did not significantly change from early puberty to late puberty (P=0.78), or from late puberty to adulthood (P=0.37). Comparing changes in insulin secretion between groups, the models had a significant coefficient for pubertal group only for steady-state insulin secretory capacity (P=0.047), but not for first-phase insulin secretory capacity (P=0.69). For steady-state insulin secretion, groups 1 and 2 had significantly greater increases in insulin secretion, versus a decrease in secretion for group 3. Race and sex were not significant factors in analyses of changes in insulin secretion.
- When individual changes between baseline and follow-up of clamp-derived indices of insulin sensitivity were examined, after adjusting for race, sex, lean mass, baseline fat mass, and change in fat mass, insulin sensitivity (Fig. 2C) decreased significantly for group 1 between pre-puberty and late puberty (P<0.001). The decrement in insulin sensitivity for group 2 between early puberty and late puberty (P=0.42) and the increase in insulin sensitivity for group 3 between late puberty and adulthood were not significant (P=0.55). The model for change in insulin sensitivity comparing the groups also had a significant coefficient for pubertal stage (P<0.001), with significant differences for change in insulin sensitivity among all groups (Fig. 2C). The greatest decrease in insulin sensitivity was observed from pre-puberty to late puberty; there was a smaller decrease from early puberty to late puberty, and a small increase in insulin sensitivity from late puberty to adulthood. Change in body fat percentage was a significant covariate in the model for change in insulin sensitivity. Race and sex were not significant factors for change in insulin sensitivity.
RESULTS
- The current study presents novel data, cross-sectionally and longitudinally assessing insulin sensitivity and insulin secretory capacity from pre-puberty into adulthood. The hyperglycemic clamp technique is considered the gold standard for measuring insulin secretion. It also allows calculation of estimates of insulin sensitivity that are highly correlated with the criterion measures of insulin sensitivity obtained through the hyperinsulinemic-euglycemic clamp procedure [28]. To our knowledge, only one other study has reported children followed longitudinally to assess insulin sensitivity and insulin secretory capacity using clamps, and it had a smaller sample size, with children followed from pre-puberty to mid-/late-/post-puberty [17]. In addition to following a pre-pubertal group to late-/post-puberty, we studied separately a group that was early-pubertal at baseline to late puberty at follow-up and a group that was late-pubertal at baseline and restudied 4 to 10 years later.
- In our longitudinal studies, we observed a modest increase in steady-state, but not first-phase, insulin secretory capacity from pre-puberty to late puberty, a somewhat greater increase in first-phase and steady-state insulin secretory capacity from early puberty to late puberty, and a decrease in first-phase and steady-state insulin secretory capacity from late puberty to adulthood. In terms of insulin sensitivity, the group that was pre-pubertal at baseline experienced the greatest decline in insulin sensitivity, the group that was early/mid-pubertal at baseline had a smaller decline in insulin sensitivity, and the group that was post-pubertal at baseline experienced an increase in insulin sensitivity. These findings were not identical in terms of statistical significance to the results of cross-sectional analyses, although the patterns were largely consistent between the two analyses.
- These findings are consistent with two other longitudinal studies that employed frequently sampled intravenous glucose tolerance tests (FSIGTs) as the measure of insulin secretory capacity and insulin sensitivity [13,29]. Hoffman et al. [15] found no effect of pubertal stage on insulin sensitivity among 24 boys and girls studied with repeated FSIGTs over an 18-month interval; however, this was likely due to the small number of subjects examined and the limited follow-up interval.
- Our longitudinal observations are also in line with other investigators’ cross-sectional findings [2,5], showing a decrease in insulin sensitivity from pre-puberty to mid-puberty, followed by an increase in subsequent pubertal stages and returning to near pre-pubertal levels by the end of puberty. This decrease in insulin sensitivity has been found to be accompanied by a compensatory increase in insulin secretory capacity [3].
- There is mixed evidence for racial differences in insulin sensitivity and insulin secretory capacity. In several studies, Black adolescents were more insulin-resistant and had higher first-phase insulin secretory capacity than White adolescents [13,30–32]. Moran et al. [5] found no racial differences in insulin sensitivity for the entire cohort, but when sexes were examined separately, white boys were significantly more insulin-sensitive than black boys. They also observed that blacks exhibited higher steady-state insulin secretory capacity [5]. It is possible that the large sample size of Moran et al. [5] allowed for a clearer picture of the nuances between race, sex, and insulin sensitivity to emerge. In the present study, non-Hispanic Black youth exhibited significantly higher first-phase and steady-state insulin secretory capacity, and lower insulin sensitivity than their non-Hispanic White counterparts. Race was not, however, significant in the models for changes in insulin sensitivity and insulin secretory capacity. Although non-Hispanic Black adolescents are known to have significantly greater risks for development of type 2 diabetes during adolescence [1], the explanation for this disparity in risk does not appear to be related to differences in how puberty alters insulin secretory capacity or insulin sensitivity. Reduced insulin sensitivity as compared to non-Hispanic White adolescents has been reported during puberty for those of Hispanic ethnicity [11,33] and among Native American [34] and some groups of Southeast Asian [35] adolescents, though Korean adolescents do not appear to have less insulin sensitivity [36], likely because of a lower prevalence of obesity. More research with a larger sample size is necessary in order to identify clinical predictors for the development of type 2 diabetes during puberty, as it is still a relatively rare disorder. However, findings from the current study and others [37–39] suggest that failure to see improvements in insulin sensitivity in late puberty portends a higher risk of persistent insulin resistance.
- Similar to race, sex differences have been reported in some, but not all, prior studies. Sex was significant only in our model of first-phase insulin secretory capacity, with lower secretion in girls. This is consistent with work done in Hispanic adolescents with obesity [33]. Moran et al. [5] noted decreased insulin sensitivity in girls at all pubertal stages compared to their male counterparts; however, the difference was only significant in late puberty. Hoffman et al. [15] demonstrated significantly higher insulin sensitivity in males during pre-puberty and late puberty than in their female counterparts. Others have reported no differences by sex [13,29].
- As has been previously reported [9,15,29,40], adiposity was an important contributor to insulin sensitivity and insulin secretory capacity in the current study. Fat percentage was significant in all of the cross-sectional models and change in fat percentage was significant in the model for change in insulin sensitivity. While Hannon et al. [17] observed no effect of change in percentage body fat, this was likely due to their smaller sample size. Recent work by Kelsey et al. [11] using FSIGTs to estimate insulin sensitivity found that insulin sensitivity was, on average, three times lower in children with obesity than in their normal-weight counterparts, and acute insulin response to glucose was three times higher, at all time points across puberty. Notably, there were no differences in the trajectories of either measure between children of normal-weight and those with obesity, although the participants were not followed into adulthood. It has been hypothesized that the changes in insulin sensitivity and insulin secretory capacity observed during puberty are due at least in part to the changes in adiposity that accompany development [9,15]. Elevations in sex steroids are also likely contributors [14] at least indirectly, by producing puberty-associated increases in growth hormone concentrations that decrease glucose uptake and therefore insulin sensitivity [14,17].
- This study is limited by its use of available data, which meant that some analyses may have had insufficient power to detect differences, particularly given the multiple covariates in the analyses. The use of different DXA machines and air displacement plethysmography to estimate percentage body fat is also a limitation that we attempted to address in the statistical analysis. We used only physical examinations, rather than biochemical means, to define pubertal status, and this may also be a limitation. Since pubertal staging systems were never meant to provide a quantitative physiologic comparison of sexual maturation between boys and girls, it is possible that our analysis plan limited the likelihood of observing sex-based differences in insulin sensitivity. The present study was also limited in its groupings by pubertal stage progression, as not all relationships between stages had sufficient observations to be examined. Lastly, since none of the analyses presented in this paper were primary aims of the parent study, the results do not represent tests of prospective hypotheses. The study does have several strengths. The longitudinal design allowed for the assessment of within-subject changes. The cohort included boys and girls, and recruited non-Hispanic Black and non-Hispanic White participants with a wide range of adiposity. The hyperglycemic clamp is considered a gold-standard measure of insulin secretion; however, assessing insulin sensitivity by hyperglycemic clamp may be considered a limitation. Although its measures of insulin sensitivity are well correlated with euglycemic hyperinsulinemic clamp measures [28], the hyperglycemic approach does not yield identical measures of insulin sensitivity, as glucose effectiveness is increased by hyperglycemia. Future longitudinal studies should enroll larger numbers of participants to be able to examine differences in insulin sensitivity between individual pubertal stages more closely using the euglycemic hyperinsulinemic clamp technique.
- In sum, estimates from hyperglycemic clamp studies of insulin sensitivity appear to reach a nadir in mid-puberty and improve in young adulthood, while measures of insulin secretory capacity increase during mid-puberty and then decrease in young adulthood. These changes are seen in both non-Hispanic White and non-Hispanic Black adolescents.
DISCUSSION
Supplementary Data
Supplemental Fig. S1
-
CONFLICTS OF INTEREST
Jack A. Yanovski receives grant support (2017 to 2018) for unrelated studies using pharmacotherapy in patients with rare syndromes causing obesity (Rhythm Pharmaceuticals; Soleno Therapeutics).
-
AUTHOR CONTRIBUTIONS
Conception or design: S.Z.Y., V.S.H., J.A.Y. Acquisition, analysis, or interpretation of data: S.E.M., M.V.G., S.M.B., S.J.M., M.M.B., J.A.Y. Drafting the work or revising: S.E.M., J.A.Y. Final approval of the manuscript: S.E.M., M.V.G., S.M.B., S.J.M., M.M.B., S.Z.Y., V.S.H., J.A.Y.
Article information
-
Acknowledgements
- We thank the participants and their families for their long-term involvement with this research project. This research was supported by the Intramural Research Program of the Eunice Kennedy Shriver National Institute of Child Health and Human Development, National Institutes of Health, 1ZIAHD000641, with supplemental funding from the National Institute on Minority Health and Health Disparities. The funding sources were not involved in study design, in the collection, analysis or interpretation of data, in the writing of the report, or in the decision to submit the article for publication. The opinions and assertions expressed herein are those of the authors and are not to be construed as reflecting the views of the National Institutes of Health.


| Characteristic | Pre-pubertal, Group I (n=25) | Early-pubertal, Group II (n=24) | Mid-pubertal, Group III (n=18) | Late-pubertal, Group IV (n=21) | Fully-pubertal, adolescents Group V (n=22) | Fully-pubertal, adults (IV or V) (n=23) | ANOVA P value |
|---|---|---|---|---|---|---|---|
| Age, yr | 8.6±1.5a | 10.6±1.6b | 12.2±1.7c | 14.0±1.4d | 17.3±4.6e | 22.3±1.7f | <0.001 |
|
|
|||||||
| Race | |||||||
| Non-Hispanic White, % | 48.0 | 50.0 | 61.1 | 71.4 | 68.2 | 56.5 | 0.701 |
| Non-Hispanic Black, % | 52.0 | 50.0 | 38.9 | 28.6 | 31.8 | 43.5 | |
|
|
|||||||
| Male sex, % | 56.0 | 45.8 | 33.3 | 57.1 | 50.0 | 52.2 | 0.540 |
|
|
|||||||
| Baseline body fat, % | 35.9±13.1 | 36.1±14.7 | 37.5±12.0 | 29.8±11.3 | 34.1±11.2 | 34.9±12.2 | 0.468 |
|
|
|||||||
| BMI SD score | 1.7±1.0 | 1.3±1.2 | 1.7±0.9 | 1.4±1.0 | 1.5±1.0 | 1.3±0.9 | 0.529 |
|
|
|||||||
| Testosterone (in male), ng/dL | 16.8±11.0a | 32.9±40.7a | 183.2±136.4b | 292.3±113.1b,c | 404.4±262.2c,d | 408.3±116.8d | <0.001 |
|
|
|||||||
| Estradiol (in female), pg/mL | 9.0±4.0a | 22.1±44.0a | 34.3±21.9a,b | 60.2±28.6b,c | 60.1±28.1c | 86.2±50.7c | <0.001 |
|
|
|||||||
| First-phase insulin secretion, μU/mL/15 min | 111.4±120.3 | 109.4±95.6 | 96.7±71.8 | 99.3±106.1 | 101.9±65.2 | 109±120.7 | 0.995 |
|
|
|||||||
| Steady-state insulin secretion, μU/mL/60 min | 139.9±144 | 141.4±98.8 | 140.8±74.7 | 155.6±142.7 | 155.9±60.5 | 139.9±135.6 | 0.993 |
|
|
|||||||
| Insulin-sensitivity, mg/kg/min/μU/mL | 15.7±19.9a | 11.2±8.6a,b | 6.3±5.6b | 10.8±8.3a,b | 5.7±5.1b | 9.2±6.6b | 0.027 |
Values are expressed as mean±standard deviation. Girls with Tanner breast stage 1 and boys with testes ≤3 mL were considered pre-pubertal and classified as pubertal group I. Girls with Tanner breast stage 2 and boys with testes >3 to <10 mL were considered to be in early puberty and classified as pubertal group II. Girls with Tanner breast stage 3 and boys with testes ≥10 to <15 mL were considered to be in mid-puberty and classified as pubertal group III. Girls with Tanner breast stage 4 and boys with testes ≥15 to <25 mL were considered to be in late puberty and classified as pubertal group IV. Girls with Tanner breast stage 5 and boys with testes ≥25 mL were considered end-pubertal and classified as pubertal group V. Adult participants (age >18 years) had all achieved pubertal group IV or V when last examined.
ANOVA, analysis of variance; BMI, body mass index; SD, standard deviation.
a,b,c,d,e,f Values followed by different superscripted letters on the same line are considered significantly different (P≤0.05).
| Characteristic | Group 1 (I→IV/V adolescents) (n=27) | Group 2 (II/III→IV/V adolescents) (n=27) | Group 3 (V→adults) (n=24) | ANOVA P value for group comparison |
|---|---|---|---|---|
| Baseline age, yr | 8.6±1.4a | 10.3±1.8b | 16.5±1.8c | <0.001 |
|
|
||||
| Age at follow-up, yr | 17.1±3.2a | 16.2±2.2a | 21.8±2.0b | <0.001 |
|
|
||||
| Baseline BMI SD score | 1.07±1.01a | 1.72±1.04b | 1.74±0.98b | 0.028 |
|
|
||||
| Race | ||||
| Non-Hispanic White, % | 77.8 | 51.9 | 66.7 | 0.133 |
| Non-Hispanic Black, % | 22.2 | 48.1 | 33.3 | |
|
|
||||
| Male sex, % | 63.0 | 37.0 | 54.2 | 0.154 |
|
|
||||
| Baseline body fat, % | 26.4±10.7a | 39.4±12.0b | 34.3±11.6b | <0.001 |
|
|
||||
| Follow-up body fat, % | 32.1±14.4 | 37.7±12.1 | 35.4±12.9 | 0.301 |
|
|
||||
| Change in body fat, % | 5.7±9.2a | −1.7±8.1b,c | 1.2±7.2a,c | 0.006 |
|
|
||||
| Baseline testosterone (in male), ng/dL | 12.1±4.0a | 40.2±47.1a | 352±151.5b | <0.001 |
|
|
||||
| Follow-up testosterone (in male), ng/dL | 425.4±242.1 | 375.7±118.5 | 471.4±161.4 | 0.499 |
|
|
||||
| Baseline estradiol (in female), pg/mL | 9.2±6.2a | 23.3±38.9a | 60.9±24.8b | 0.001 |
|
|
||||
| Follow-up estradiol (in female), pg/mL | 104.6±48.5 | 94.8±96.9 | 111.5±110.4 | 0.888 |
|
|
||||
| Baseline first-phase insulin secretion, μU/mL/15 min | 42.7±36.5a | 129.5±129.7b | 94.8±68.2b | 0.002 |
|
|
||||
| Follow-up first-phase insulin secretion, μU/mL/15 min | 55.7±36.3a | 128.2±106.1b | 92.0±64.3a,b | 0.001 |
|
|
||||
| Baseline steady-state insulin secretion, μU/mL/60 min | 72.4±41.9a | 162.5±131.9b | 140.1±72.9b | 0.001 |
|
|
||||
| Follow-up steady-state insulin secretion, μU/mL/60 min | 96.7±44.0a | 183.0±131.8b | 127.8±65.3a | 0.003 |
|
|
||||
| Baseline insulin sensitivity, mg/kg/min/μU/mL | 12.5±13.1a | 8.3±7.0b | 5.7±3.3b | <0.001 |
|
|
||||
| Follow-up insulin sensitivity, mg/kg/min/μU/mL | 8.9±7.5 | 6.6±9.0 | 7.6±6.1 | 0.542 |
|
|
||||
| Change in first-phase insulin secretion, μU/mL/15 min | 13±33.5 | −0.8±115.3 | −2.7±70.9 | 0.740 |
|
|
||||
| Change in steady-state insulin secretion, μU/mL/60 min | 24.3±41.2 | 24.5±134 | −12.3±76 | 0.274 |
|
|
||||
| Change in insulin sensitivity, mg/kg/min/μU/mL | −13.6±13.3a | −1.8±8.7b | 1.8±6.1b | <0.0001 |
Values are expressed as mean±standard deviation. P values for comparisons between groups are not adjusted for any covariates. Roman numerals in group description refer to pubertal development groups at baseline and follow-up. Girls with Tanner breast stage 1 and boys with testes ≤3 mL were considered pre-pubertal and classified as pubertal group I. Girls with Tanner breast stage 2 and boys with testes >3 to <10 mL were considered to be in early puberty and classified as pubertal group II. Girls with Tanner breast stage 3 and boys with testes ≥10 to <15 mL were considered to be in mid-puberty and classified as pubertal group III. Girls with Tanner breast stage 4 and boys with testes ≥15 to <25 mL were considered to be in late puberty and classified as pubertal group IV. Girls with Tanner breast stage 5 and boys with testes ≥25 mL were considered end-pubertal and classified as pubertal group V. Adult participants (age >18 years) had all achieved pubertal groups IV or V when last examined. Group 1 was pre-pubertal (pubertal group I) at baseline and late-pubertal (pubertal groups IV or V) at follow-up, group 2 was early-pubertal (pubertal groups II or III) at baseline and late-pubertal (pubertal groups IV or V) at follow-up, and group 3 was late-pubertal (pubertal groups IV or V) at baseline and studied again at follow-up as adults 4 to 10 years later.
ANOVA, analysis of variance; BMI, body mass index; SD, standard deviation.
a,b,c Values followed by different superscripted letters on the same line were significantly different (P≤0.05).
| Characteristic | Group 1 (I→IV/V adolescents) (n=27) | Group 2 (II/III→IV/V adolescents) (n=27) | Group 3 (V→adults) (n=24) | ANOVA P value for group comparison |
|---|---|---|---|---|
| Baseline first-phase insulin secretion, μU/mL/15 min | 43.4±6.6a | 76.2±6.5b | 115.6±6.7b | 0.009 |
| Follow-up first-phase insulin secretion, μU/mL/15 min | 66.5±6.6 | 93.3±6.7 | 105.7±6.3a | 0.087 |
| Baseline steady-state insulin secretion, μU/mL/60 min | 71.3±6.4a | 108.4±6.2b | 176.2±6.4b | 0.013 |
| Follow-up steady-state insulin secretion, μU/mL,60 min | 107.4±6.2 | 139±6.3 | 148.9±5.9 | 0.107 |
| Baseline insulin sensitivity, mg/kg/min/μU/mL | 9.8±7.3 | 5.9±7.0 | 5.1±7.5 | 0.160 |
| Follow-up insulin sensitivity, mg/kg/min/μU/mL | 3.9±7.7 | 2.6±7.8 | 5.2±7.3 | 0.234 |
Values are expressed as mean±standard deviation. P values are from analyses of log-transformed data accounting for age, sex, race, and body fat mass. Adjusted means and SDs from back-transformed analyses are shown. Roman numerals in group description refer to pubertal development groups at baseline and follow-up. Girls with Tanner breast stage 1 and boys with testes ≤3 mL were considered pre-pubertal and classified as pubertal group I. Girls with Tanner breast stage 2 and boys with testes >3 to <10 mL were considered to be in early puberty and classified as pubertal group II. Girls with Tanner breast stage 3 and boys with testes ≥10 to <15 mL were considered to be in mid-puberty and classified as pubertal group III. Girls with Tanner breast stage 4 and boys with testes ≥15 to <25 mL were considered to be in late puberty and classified as pubertal group IV. Girls with Tanner breast stage 5 and boys with testes ≥25 mL were considered end-pubertal and classified as pubertal group V. Adult participants (age >18 years) had all achieved pubertal groups IV or V when last examined. Group 1 was pre-pubertal (pubertal group I) at baseline and late-pubertal (pubertal groups IV or V) at follow-up, group 2 was early-pubertal (pubertal groups II or III) at baseline and late-pubertal (pubertal groups IV or V) at follow-up, and group 3 was late-pubertal (pubertal groups IV or V) at baseline and studied again at follow-up as adults 4 to 10 years later.
ANOVA, analysis of variance.
a,b Values followed by different superscripted letters on the same line were significantly different (P≤0.05).
- 1. Mayer-Davis EJ, Lawrence JM, Dabelea D, Divers J, Isom S, Dolan L, et al. Incidence trends of type 1 and type 2 diabetes among youths, 2002–2012. N Engl J Med 2017;376:1419–29.ArticlePubMedPMC
- 2. Amiel SA, Sherwin RS, Simonson DC, Lauritano AA, Tamborlane WV. Impaired insulin action in puberty. A contributing factor to poor glycemic control in adolescents with diabetes. N Engl J Med 1986;315:215–9.ArticlePubMed
- 3. Caprio S, Plewe G, Diamond MP, Simonson DC, Boulware SD, Sherwin RS, et al. Increased insulin secretion in puberty: a compensatory response to reductions in insulin sensitivity. J Pediatr 1989;114:963–7.ArticlePubMed
- 4. Jeffery AN, Metcalf BS, Hosking J, Streeter AJ, Voss LD, Wilkin TJ. Age before stage: insulin resistance rises before the onset of puberty: a 9-year longitudinal study (EarlyBird 26). Diabetes Care 2012;35:536–41.ArticlePubMedPMC
- 5. Moran A, Jacobs DR Jr, Steinberger J, Hong CP, Prineas R, Luepker R, et al. Insulin resistance during puberty: results from clamp studies in 357 children. Diabetes 1999;48:2039–44.ArticlePubMed
- 6. Bloch CA, Clemons P, Sperling MA. Puberty decreases insulin sensitivity. J Pediatr 1987;110:481–7.ArticlePubMed
- 7. Brufani C, Tozzi A, Fintini D, Ciampalini P, Grossi A, Fiori R, et al. Sexual dimorphism of body composition and insulin sensitivity across pubertal development in obese Caucasian subjects. Eur J Endocrinol 2009;160:769–75.ArticlePubMed
- 8. Caprio S, Cline G, Boulware S, Permanente C, Shulman GI, Sherwin RS, et al. Effects of puberty and diabetes on metabolism of insulin-sensitive fuels. Am J Physiol 1994;266(6 Pt 1):E885–91.ArticlePubMed
- 9. Travers SH, Jeffers BW, Bloch CA, Hill JO, Eckel RH. Gender and Tanner stage differences in body composition and insulin sensitivity in early pubertal children. J Clin Endocrinol Metab 1995;80:172–8.ArticlePubMed
- 10. Kelsey MM, Zeitler PS. Insulin resistance of puberty. Curr Diab Rep 2016;16:64.ArticlePubMed
- 11. Kelsey MM, Pyle L, Hilkin A, Severn CD, Utzschneider K, Van Pelt RE, et al. The impact of obesity on insulin sensitivity and secretion during pubertal progression: a longitudinal study. J Clin Endocrinol Metab 2020;105:e2061–8.ArticlePubMedPMC
- 12. Huang Z, Liu J, Ma L, Wan X, He X, Fang D, et al. Glucose metabolism, insulin sensitivity and β-cell function in type A insulin resistance syndrome around puberty: a 9-year follow-up. Horm Metab Res 2014;46:65–72.ArticlePubMed
- 13. Ball GD, Huang TT, Gower BA, Cruz ML, Shaibi GQ, Weigensberg MJ, et al. Longitudinal changes in insulin sensitivity, insulin secretion, and beta-cell function during puberty. J Pediatr 2006;148:16–22.ArticlePubMed
- 14. Goran MI, Gower BA. Longitudinal study on pubertal insulin resistance. Diabetes 2001;50:2444–50.ArticlePubMed
- 15. Hoffman RP, Vicini P, Sivitz WI, Cobelli C. Pubertal adolescent male-female differences in insulin sensitivity and glucose effectiveness determined by the one compartment minimal model. Pediatr Res 2000;48:384–8.ArticlePubMed
- 16. Travers SH, Jeffers BW, Eckel RH. Insulin resistance during puberty and future fat accumulation. J Clin Endocrinol Metab 2002;87:3814–8.ArticlePubMed
- 17. Hannon TS, Janosky J, Arslanian SA. Longitudinal study of physiologic insulin resistance and metabolic changes of puberty. Pediatr Res 2006;60:759–63.ArticlePubMed
- 18. Biro FM, Galvez MP, Greenspan LC, Succop PA, Vangeepuram N, Pinney SM, et al. Pubertal assessment method and baseline characteristics in a mixed longitudinal study of girls. Pediatrics 2010;126:e583–90.ArticlePubMedPMC
- 19. Herman-Giddens ME, Steffes J, Harris D, Slora E, Hussey M, Dowshen SA, et al. Secondary sexual characteristics in boys: data from the Pediatric Research in Office Settings Network. Pediatrics 2012;130:e1058–68.ArticlePubMed
- 20. Fleisch AF, Agarwal N, Roberts MD, Han JC, Theim KR, Vexler A, et al. Influence of serum leptin on weight and body fat growth in children at high risk for adult obesity. J Clin Endocrinol Metab 2007;92:948–54.ArticlePubMed
- 21. Must A, Dallal GE, Dietz WH. Reference data for obesity: 85th and 95th percentiles of body mass index (wt/ht2) and triceps skinfold thickness. Am J Clin Nutr 1991;53:839–46.ArticlePubMed
- 22. Robotham DR, Schoeller DA, Mercado AB, Mirch MC, Theim KR, Reynolds JC, et al. Estimates of body fat in children by Hologic QDR-2000 and QDR-4500A dual-energy X-ray absorptiometers compared with deuterium dilution. J Pediatr Gastroenterol Nutr 2006;42:331–5.ArticlePubMedPMC
- 23. Nicholson JC, McDuffie JR, Bonat SH, Russell DL, Boyce KA, McCann S, et al. Estimation of body fatness by air displacement plethysmography in African American and white children. Pediatr Res 2001;50:467–73.ArticlePubMed
- 24. Bonat S, Pathomvanich A, Keil MF, Field AE, Yanovski JA. Self-assessment of pubertal stage in overweight children. Pediatrics 2002;110:743–7.ArticlePubMed
- 25. Marshall WA, Tanner JM. Variations in pattern of pubertal changes in girls. Arch Dis Child 1969;44:291–303.ArticlePubMedPMC
- 26. Tanner JM. Growth and maturation during adolescence. Nutr Rev 1981;39:43–55.ArticlePubMed
- 27. Nguyen TT, Keil MF, Russell DL, Pathomvanich A, Uwaifo GI, Sebring NG, et al. Relation of acanthosis nigricans to hyperinsulinemia and insulin sensitivity in overweight African American and white children. J Pediatr 2001;138:474–80.ArticlePubMed
- 28. Sjaarda L, Lee S, Tfayli H, Bacha F, Bertolet M, Arslanian S. Measuring β-cell function relative to insulin sensitivity in youth: does the hyperglycemic clamp suffice? Diabetes Care 2013;36:1607–12.ArticlePubMedPMC
- 29. Cook JS, Hoffman RP, Stene MA, Hansen JR. Effects of maturational stage on insulin sensitivity during puberty. J Clin Endocrinol Metab 1993;77:725–30.ArticlePubMed
- 30. Arslanian S, Suprasongsin C. Differences in the in vivo insulin secretion and sensitivity of healthy black versus white adolescents. J Pediatr 1996;129:440–3.ArticlePubMed
- 31. Gower BA, Granger WM, Franklin F, Shewchuk RM, Goran MI. Contribution of insulin secretion and clearance to glucose-induced insulin concentration in African-American and Caucasian children. J Clin Endocrinol Metab 2002;87:2218–24.ArticlePubMed
- 32. Haffner SM, D’Agostino R, Saad MF, Rewers M, Mykkanen L, Selby J, et al. Increased insulin resistance and insulin secretion in nondiabetic African-Americans and Hispanics compared with non-Hispanic whites. The Insulin Resistance Atherosclerosis Study. Diabetes 1996;45:742–8.ArticlePubMed
- 33. Kelly LA, Lane CJ, Weigensberg MJ, Toledo-Corral CM, Goran MI. Pubertal changes of insulin sensitivity, acute insulin response, and β-cell function in overweight Latino youth. J Pediatr 2011;158:442–6.ArticlePubMedPMC
- 34. Pettitt DJ, Moll PP, Knowler WC, Mott DM, Nelson RG, Saad MF, et al. Insulinemia in children at low and high risk of NIDDM. Diabetes Care 1993;16:608–15.ArticlePubMed
- 35. Ehtisham S, Crabtree N, Clark P, Shaw N, Barrett T. Ethnic differences in insulin resistance and body composition in United Kingdom adolescents. J Clin Endocrinol Metab 2005;90:3963–9.ArticlePubMed
- 36. Kim JW, Park SH, Kim Y, Im M, Han HS. The cutoff values of indirect indices for measuring insulin resistance for metabolic syndrome in Korean children and adolescents. Ann Pediatr Endocrinol Metab 2016;21:143–8.ArticlePubMedPMC
- 37. McCance DR, Pettitt DJ, Hanson RL, Jacobsson LT, Bennett PH, Knowler WC. Glucose, insulin concentrations and obesity in childhood and adolescence as predictors of NIDDM. Diabetologia 1994;37:617–23.ArticlePubMed
- 38. Lee JM. Insulin resistance in children and adolescents. Rev Endocr Metab Disord 2006;7:141–7.ArticlePubMed
- 39. Hu T, Jacobs DR Jr, Sinaiko AR, Bazzano LA, Burns TL, Daniels SR, et al. Childhood BMI and fasting glucose and insulin predict adult type 2 diabetes: the international childhood cardiovascular cohort (i3C) consortium. Diabetes Care 2020;43:2821–9.ArticlePubMedPMC
- 40. Caprio S, Hyman LD, McCarthy S, Lange R, Bronson M, Tamborlane WV. Fat distribution and cardiovascular risk factors in obese adolescent girls: importance of the intraabdominal fat depot. Am J Clin Nutr 1996;64:12–7.ArticlePubMed
References
Figure & Data
References
Citations
- Exploratory Longitudinal Analysis of the Circulating CHIT1 Activity in Pediatric Patients with Obesity
Ioana Țaranu, Nicoleta Răcătăianu, Cristina Drugan, Cristina-Sorina Cătană, Andreea-Manuela Mirea, Diana Miclea, Sorana D. Bolboacă
Children.2023; 10(1): 124. CrossRef - Insulin Clearance in Health and Disease
Sonia M. Najjar, Sonia Caprio, Amalia Gastaldelli
Annual Review of Physiology.2023; 85(1): 363. CrossRef - Influence of puberty on relationships between body composition and blood pressure: a cross-sectional study
Esther A. Kwarteng, Lisa M. Shank, Loie M. Faulkner, Lucy K. Loch, Syeda Fatima, Suryaa Gupta, Hannah E. Haynes, Kaitlin L. Ballenger, Megan N. Parker, Sheila M. Brady, Anna Zenno, Marian Tanofsky-Kraff, Jack A. Yanovski
Pediatric Research.2023; 94(2): 781. CrossRef - Distribution of OGTT-Related Variables in Patients with Cystic Fibrosis from Puberty to Adulthood: An Italian Multicenter Study
Andrea Foppiani, Fabiana Ciciriello, Arianna Bisogno, Silvia Bricchi, Carla Colombo, Federico Alghisi, Vincenzina Lucidi, Maria Ausilia Catena, Mariacristina Lucanto, Andrea Mari, Giorgio Bedogni, Alberto Battezzati
Journal of Personalized Medicine.2023; 13(3): 469. CrossRef - Fat-free/lean body mass in children with insulin resistance or metabolic syndrome: a systematic review and meta-analysis
Diana Paola Córdoba-Rodríguez, Iris Iglesia, Alejandro Gomez-Bruton, Gerardo Rodríguez, José Antonio Casajús, Hernan Morales-Devia, Luis A. Moreno
BMC Pediatrics.2022;[Epub] CrossRef - Evaluating Triglyceride and Glucose Index as a Simple and Easy-to-Calculate Marker for All-Cause and Cardiovascular Mortality
Kyung-Soo Kim, Sangmo Hong, You-Cheol Hwang, Hong-Yup Ahn, Cheol-Young Park
Journal of General Internal Medicine.2022; 37(16): 4153. CrossRef - An update of the consensus statement on insulin resistance in children 2010
Veronica Maria Tagi, Sona Samvelyan, Francesco Chiarelli
Frontiers in Endocrinology.2022;[Epub] CrossRef - Dietary sugar restriction reduces hepatic de novo lipogenesis in boys with fatty liver disease
Stephanie T. Chung, Sheela N. Magge
Journal of Clinical Investigation.2021;[Epub] CrossRef
 PubReader
 ePub Link
 Cite
Cite