The Prevalence and Risk of Type 2 Diabetes in Adults with Disabilities in Korea
Article information

Abstract
Background
People with disabilities are at risk of secondary conditions such as diabetes. The aim of this study was to evaluate the prevalence and risk of type 2 diabetes in South Korea, especially among people with all types of disabilities.
Methods
We conducted a cross-sectional study using data from the Korean National Health Insurance Service, with two disabilityfree controls matched for each participant with disabilities by age and sex. Information regarding the type, severity and grade of disabilities was obtained based on the National Disability Registry. Diagnosis of type 2 diabetes was defined according to the following criteria: presence of International Classification of Diseases, Tenth Revision, Clinical Modification codes E11, E12, E13, or E14 and claims for at least one oral anti-diabetic agent or insulin at baseline, or fasting glucose level ≥126 mg/dL.
Results
We included 1,297,806 participants with disabilities and 2,943,719 control. Out of 4,241,525 participants, 841,990 (19.9%) were diagnosed with diabetes. The prevalence of diabetes was higher in the disability group compared with individuals without disabilities (23.1% vs. 18.4%). The odds of having diabetes was higher in the disability group compared with the control group (adjusted odds ratio, 1.34; 95% confidence interval, 1.33 to 1.34). The results showed higher prevalence of diabetes in the mildly disabled group (23.2%) than in the severely disabled group (22.7%).
Conclusion
The prevalence and risk of diabetes were higher in people with disabilities compared with the general population. Physicians and public health authorities should focus on people with disabilities for proper diabetes management.
INTRODUCTION
According to the International Classification of Impairments, Disabilities, and Handicaps by the World Health Organization, a disability is the inability to perform an activity in the manner or range considered normal for a particular individual [1]. The number of people with disabilities in South Korea is increasing; it almost doubled from approximately 1.45 million in 2000 to 2.68 million in 2011 [2].
The concepts and definition of disability in Korea have been extended according to the international standards. Instead of the eight body systems of the International Classification of Functioning, Disability and Health frame [3], disability in Korea is currently further classified into 15 subclasses including problems in the limbs, brain, kidneys, heart, respiratory system, liver, face, and ostomies; visual, auditory, linguistic, intellectual, developmental including autism, and mental disabilities; and epilepsy [4]. An estimated 2.7 million people (5.6% of the Korean population) currently live with a disability [5]. As the aged population rapidly increases in South Korea, it is predicted that the population of individuals with disabilities and prevalence of diabetes will also increase. In addition, disabilities are associated with poor health outcomes and increased risk of developing secondary conditions [6]. Moreover, individuals with disabilities experience more barriers in accessing medical services than the general population [5]. To plan an effective welfare strategy for the disabled and to establish proper health policies, the current status of people with disabilities who are at risk of diabetes should be characterized in detail.
Diabetes is likely to be associated with disabilities. Several cross-sectional studies have revealed that physical disability is strongly associated with an increased incidence of type 2 diabetes [7,8]. Previous studies have also shown that people with intellectual disabilities have an increased prevalence of diabetes [9]. However, these are small-scale studies or include certain groups with limited type of disability. Large-scale studies conducted in individuals with all types of disabilities are rare; therefore, we aimed to investigate and compare the prevalence of type 2 diabetes mellitus between people with disabilities and the general population using recent nationwide data.
METHODS
Source of data
This study analyzed data from the Korean National Health Insurance Service (NHIS) and claims database. NHIS comprises of a complete set of health information pertaining to 50 million Koreans. It is a mandatory health insurance program that covers 97.1% of the Korean population. In Korea, NHIS is the single insurer, managed by the government. NHIS includes an eligibility database (age, sex, socioeconomic variables, type of eligibility, household income level, etc.); a medical treatment claims database (based on medical bills that were claimed by medical service providers for their medical expenses); a health examination database (results of general health examinations and questionnaires on lifestyle and behavior); a medical care institution database (types of medical care institutions, location, equipment, and number of physicians); and a National Disability Registry. We used the general health examination data and NHIS claims data including diagnoses, procedures, and prescription records. This study was approved by the Institutional Review Board of Kangbuk Samsung Hospital of Korea (KBSMC 2019-09-015) and used data (NHIS REQ0000032688) made by NHIS. Anonymous and deidentified information was used for analysis and, therefore, informed consent was not obtained.
Study population
First, we analyzed data from the eligibility database. Two disability-free controls were matched for each participant with disabilities by age and sex. We combined data from the health examination database and selected 4,241,525 participants aged 20 years or older who had undergone a health examination in 2017. We identified 1,297,806 participants with disabilities and 2,943,719 controls. Individuals with disabilities were further classified into the following two subgroups: severe disability (degree 1 to 3) and mild disability (degree 4 to 6).
Definitions of disability
Korea has a National Disability Registry System according to the Korean Disability Act, which contains social security numbers and information regarding disability characterization, such as disability type and severity. Disabilities are classified into 15 types and 6 degrees of disability severity. Disability is diagnosed by the respective medical specialist. When persons with disabilities register in this registry system, their records include one or two disability types as “primary” and “secondary” disabilities, and an integrated degree of disability severity [5]. When impairments occurred in different organs or body systems, the final degree of physical disability consisted of a combination of the impairments. If minor impairments occur independently and are not part of a major impairment, they can be combined. When a minor impairment was accompanied only with one major impairment, the committee rated the most severe impairment only [10]. The severity of disability was graded from 1 (very severe) to 6 (very mild), on the basis of functional losses and clinical impairment.
Definitions of diabetes
Type 2 diabetes was diagnosed according to the following criteria: (1) the presence of International Classification of Diseases, Tenth Revision, Clinical Modification (ICD-10-CM) codes E11, E12, E13, or E14 and claims for at least one oral anti-diabetic agent or insulin at baseline, or (2) fasting glucose level ≥126 mg/dL (acquired from the health examination database).
Definition of comorbid diseases
Prevalence of hypertension was defined according to the presence of at least one claim per year for the prescription of antihypertensive agents under ICD-10 codes I10-I13 and I15, or systolic/diastolic blood pressure ≥140/90 mm Hg. The presence of dyslipidemia was defined according to the prescription of at least one claim per year for antihyperlipidemic agents under ICD-10 code E78, or total cholesterol ≥6.21 mmol/L (240 mg/dL) (acquired from the health examination database).
Measurements
The body mass index (BMI) was calculated as the participant’s weight in kilograms divided by the square of the height in meters. The BMI cutoff of 25 kg/m2 was used to define obesity for the Korean population in this study. Individuals were categorized as non-smokers, ex-smokers, or current smokers, and heavy alcohol drinkers were defined as individuals who drink more than 30 g alcohol per day, based on information acquired using a self-reported questionnaire. Regular exercise was defined as either strenuous physical activity that was performed for at least 20 minutes for more than three times per week or moderate intensity of activity for at least five times per week. Income level was dichotomized at the lower 20%.
Statistical analysis
Categorical variables were expressed as percentages, and we used chi-square test to explore differences between groups. For continuous variables, Student’s t test and one-way analysis of variance was used. Logistic regression analysis was performed to evaluate the odds ratio (OR) and 95% confidence intervals (CI) for the presence of diabetes according to the disability status. The regression model was adjusted for age and sex. Statistical significance was defined as two-sided P value <0.05. All statistical analyses were performed using SAS version 9.3 (SAS Institute Inc., Cary, NC, USA) and R version 3.6.1 (The R Foundation for Statistical Computing, Vienna, Austria, http://www.Rproject.org).
RESULTS
Baseline characteristics according to the presence of disabilities
Out of the 4,241,525 participants, 1,297,806 (30.6%) were diagnosed with disabilities. Age, sex-adjusted prevalence of diabetes in participants with disabilities was higher compared with the general population (17.9% vs. 13.4% in total, 19.1% vs. 15.4% in men, 17.0% vs. 11.3% in women) (Supplemental Table S1). The prevalence of obesity defined by BMI and waist circumference was higher among participants with disabilities compared with the general population (42.8% vs. 38.9% by BMI; 34.6% vs. 28.7% by waist circumference). Fasting blood glucose was higher in participants with disabilities compared with the general population. Regarding health-related behaviors, the smoking rate and the proportion of heavy alcohol drinkers were slightly higher in the control group (18.7% vs. 18.3%, 7.0% vs. 6.4% respectively). The prevalence of diabetes in participants with disabilities was higher compared with the general population across all age groups (Supplemental Table S2).
Baseline characteristics according to severity and type of disabilities
We classified participants with disabilities into two groups according to disability severity (Table 1): severe disability group (grades 1 to 3, n=364,742, 8.6%) and mild disability group (grades 4 to 6, n=933,064, 22%). The prevalence of obesity by BMI criteria was higher in the mild disability group than in the severe disability group (44.2% vs. 39.4%, P<0.001). Moreover, the percentage of underweight individuals was higher in the severe disability group than in the mild disability group (5.5% vs. 2.5%, P<0.001).
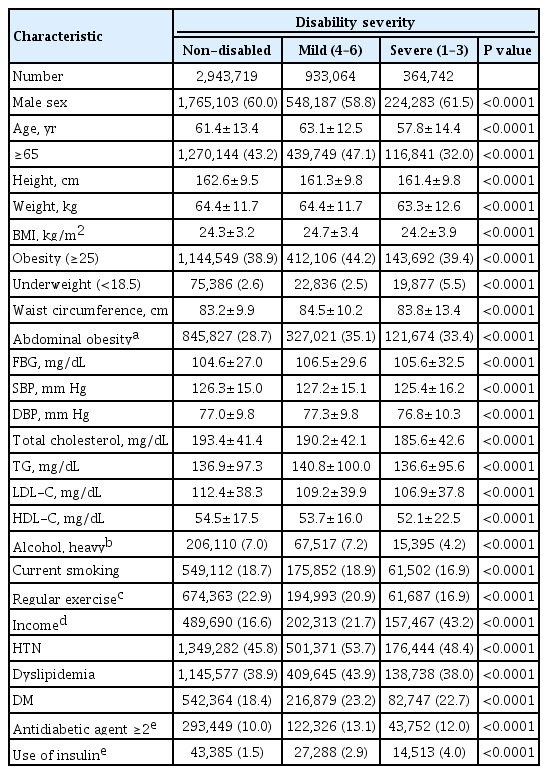
Baseline Characteristics of Participants According to the Severity of Disability
The mean age of the control group was 61.4±13.4 years. Participants with autism were the youngest group (mean age 27.6 years old), followed by participants with brain problems (43.6 years old), epilepsy (52.2 years old), and mental disabilities (52.6 years old) (Supplemental Table S3). The proportion of physical disability was the highest among all disability types (n=770,291, 18.2%). The prevalence of obesity by BMI was the highest in participants with mental disability (50.3%) and the lowest in participants with respiratory disability (20.4%).
Prevalence of diabetes
Out of the 4,241,525 participants, 841,990 (19.9%) were diagnosed with diabetes. The prevalence of diabetes was higher in people with disabilities than in people without disabilities (23.1% and 18.4%, P<0.001). Regarding disability grades (Supplemental Table S4), the prevalence of diabetes was the highest in the fourth grade, although it did not show any trend in accordance with each grade of disability. The proportion of having diabetes was higher in the mild disability group (grade 4 to 6) than in the severe disability group (grade 1 to 3) (23.2% and 22.7%, P<0.001). Regarding the types of disabilities, the prevalence of diabetes was lower especially in individuals with facial deformity, brain impairment, epilepsy, mental retardation, and autism than in individuals without disabilities. These individuals were relatively young among the study participants (mean age 54.0, 43.6, 52.2, 57.6, and 27.6 years, respectively). Except for these types of disabilities, the prevalence of diabetes was higher among people with disabilities compared to the general population.
Risk of comorbid diabetes according to the status of disability
Fig. 1 shows the relationship between the status of disabilities and risk of type 2 diabetes. In the logistic regression model after adjustment for age and sex, people with disabilities had significantly higher odds of having diabetes (OR, 1.34; 95% CI, 1.33 to 1.34; P<0.001). Participants with severe disabilities (grade 1 to 3) showed higher risk of having diabetes than participants with mild disabilities (grade 4 to 6) (OR, 1.48; 95% CI, 1.47 to 1.49 vs. OR, 1.29; 95% CI, 1.28 to 1.30; P<0.001). Regarding the types of disabilities, participants with renal impairments had the highest odds of having diabetes (OR, 4.04; 95% CI, 3.94 to 4.14; P<0.001) followed by individuals with liver, heart, mental, and visual disability (OR, 3.16, 2.31, 1.83, 1.80, respectively). Patients with disabilities showed higher adjusted ORs regardless of their impaired organ except for participants with autism, facial deformities, or epilepsy. The mean age of these groups was relatively low; 27.6, 54.0, and 52.2 years, respectively.
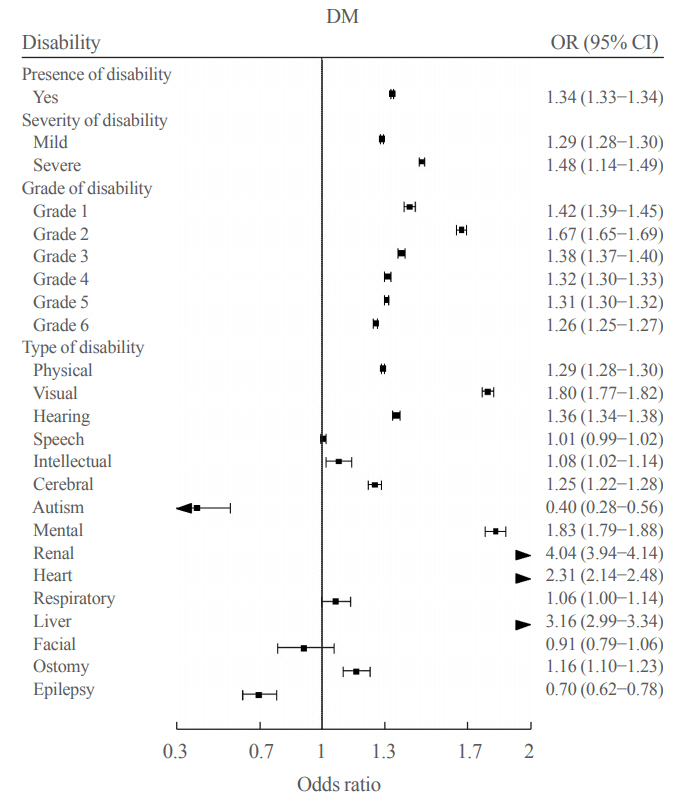
Odds ratio of type 2 diabetes mellitus (DM) according to status of disabilities. OR, odds ratio; CI, confidence interval.
Subgroup analysis
In subgroup analysis by sex (Tables 2, 3), women with severe disabilities showed higher OR than men with severe disabilities (OR, 1.74; 95% CI, 1.72 to 1.77 vs. OR, 1.36; 95% CI, 1.35 to 1.36; P<0.001). Regarding the types of disabilities, participants with renal, hepatic, or cardiac disabilities showed the highest risk of having diabetes in men (OR, 3.95, 3.21, and 2.51, respectively; P<0.001). In women, participants with renal, hepatic, or brain impairments showed the highest risk of diabetes (OR, 4.38, 2.97, and 2.07, respectively; P<0.001).
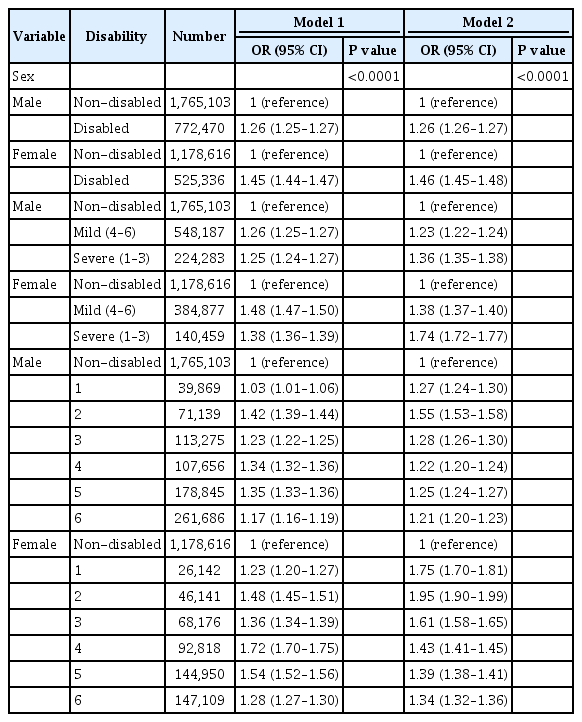
Subgroup Analysis by Sex and Severity of Disability
DISCUSSION
In this large-scale, nationwide study, we analyzed the prevalence and risk of type 2 diabetes among people with disabilities in comparison to the general population. We found a higher prevalence of type 2 diabetes among individuals with either physical disabilities or non-physical disabilities compared to individuals without disabilities. Individuals with disabilities also had higher odds of having diabetes. In this cross-sectional study, individuals with mild disabilities showed higher prevalence of diabetes but the adjusted OR of having diabetes was higher in the severe disability group. In subgroup analyses, patients younger than 65 years old and women with severe disabilities showed a higher risk of diabetes.
Previous studies have reported that people with either physical disability or intellectual disability have a higher likelihood of developing diabetes. Kim et al. [2] reported the prevalence of chronic diseases among persons with disabilities using data from the National Survey on Persons with Disabilities. According to this survey, the most common comorbid disease was hypertension (33.5%), followed by arthritis (10.3%) and diabetes (8.9%) [11]. Macrae et al. [9] conducted a systematic literature review of diabetes prevalence in people with intellectual disabilities across 22 studies. According to their literature review, 11 studies suggested that diabetes occurs more frequently in people with intellectual disabilities. The prevalence of diabetes in people with intellectual disabilities was highly variable, but evidence suggests that overall prevalence is higher in people with intellectual disabilities compared to the general population. However, the largest sample comprised of only 29,010 participants [12] and only two studies were conducted in Asia. Unfortunately, most previous studies did not distinguish between the different types of diabetes. Several publications have focused on diabetes in people with physical disabilities. Especially, spinal cord injury has been investigated extensively. Previous studies suggested that spinal cord injuries were associated with an increased incidence of type 2 diabetes [8,13]. In people with spinal cord injuries, muscle paralysis and muscular atrophy may be associated with insulin resistance and impaired glucose metabolism [14-16].
Diabetes and its complications are associated with an increased risk of physical disability. Uncontrolled high blood glucose levels in patients with diabetes can lead to a range of complications, which can themselves lead to disabilities [17]. For example, diabetic retinopathy is the leading cause of visual impairments. Diabetic nephropathy is also the leading cause of end-stage renal disease that may lead to hemodialysis or kidney transplantation. Diabetes is associated with poor circulation in the lower limbs which may lead to amputation. However, a 60% excess prevalence of disability remains after controlling for these factors [18]. In this study, as expected, the prevalence of type 2 diabetes was higher in people with disabilities due to diabetes complications than in the general population. Moreover, individuals with disabilities that result from causes other than diabetes also showed higher prevalence of diabetes compared to people without disability.
Multiple factors have been implicated in the development of type 2 diabetes in people with disabilities. People with physical disabilities undergo alterations in body composition and energy expenditure, which may play a role in the development of diabetes. Several publications found an increase in total fat mass and a decrease in fat-free mass in individuals with spinal cord injury [14,19]. A study involving adolescents with quadriplegic cerebral palsy also revealed increase in body fat percentage and decrease in fat-free mass [20]. The alterations in body composition and physical inactivity due to physical disabilities may contribute to insulin resistance and diabetes mellitus [21]. In addition to people with limb disabilities, heart or respiratory disability also cause difficulties in physical activity. Dyspnea and hypoxemia due to physical activity render these groups less active than the general population. Physical inactivity is associated with decreased energy expenditure that results in positive energy balance, thus leading to insulin resistance and diabetes [21].
It has been demonstrated that the prevalence of obesity and diabetes may be higher in people with intellectual disabilities in comparison to the general population [9]. People with intellectual disabilities are more likely to have an unhealthy lifestyle—poor nutrition, high fat and sugar diet, sedentary lifestyle with limited physical activity [22-24]. There is a strong association between abdominal obesity and the development of type 2 diabetes [25]. We observed similar results in our study. In addition, people with disabilities are more likely to experience limited access to medical care [26,27]. Existing studies reported disparities in accessing health care between individuals with and without disabilities [5,28,29]. The most frequently reported reason for people with disabilities in Korea not receiving proper health service was lack of money (58.8%), followed by lack of access to transportation (18.6%) [5]. We also found similar results in this study. The percentage of households with the lowest income (lower 20 percentile) was higher within the people with disabilities group (27.7%), compared with 16.6% in the general population. These unmet health care needs in people with disabilities may affect progression of diabetes and related complications.
In this present study, we found that the prevalence of type 2 diabetes is lower in people with mental retardation, autism, and epilepsy. Three studies reported that diabetes is less prevalent in people with intellectual disabilities compared with the general population, especially in people with chromosomal syndromes, such as Prader-Willi syndrome and Down’s syndrome [9]. These disabilities may be prevalent in the pediatric population [30]. Individuals with multiple developmental disabilities including chromosome disorders die earlier from other causes prior to the onset of type 2 diabetes [31]. Little is known about the relationship between chromosome or genetic disorders and type 2 diabetes, therefore, further research is required.
We observed higher prevalence of diabetes in people with mild disabilities compared to people with severe disabilities. These findings may be partly explained by the higher prevalence of underweight people with severe disabilities [32]. When we examined the risk of diabetes according to their grades of disability, we found the highest risk in participants with grade 2 disabilities (OR, 1.55 in men and 1.95 in women, P<0.001). Mean age of grade 1 group was younger than those of grade 2 to 6, and the percentage of underweight subjects in grade 1 group was higher than that of others. We also observed the second lowest proportion of the subjects with regular physical activity in grade 2 group next to grade 1 group (Supplementary Table S4). These findings may partially explain the highest OR for diabetes in grade 2, but it seems there are other unknown mechanisms on this relationship.
There are some limitations in this study. This is a cross-sectional study, which provides no evidence on the causality between disabilities and diabetes. We only analyzed participants who underwent health examination during the study period. Over- or underestimation of diabetes prevalence may be possible, as we were unable to obtain data from individuals who did not undergo health examinations. Individuals with severe disabilities in residential settings may not have been included in the study population. This analysis relied on claims data; we could not obtain clinical information on glycated hemoglobin levels and the duration of diabetes. In this study, we did not consider the duration of disabilities and type of disability, e.g., congenital or acquired. The duration of disability may have substantial effects on the development of type 2 diabetes. In addition, we could not evaluate the duration of diabetes in the analyses. Since diabetic retinopathy is one of the major causes of visual impairment, there are possible confounding factors regarding the prevalence of diabetes among individuals with visual impairment [33]. Our results cannot be applied to other countries. The welfare strategy and characteristics of disabled individuals in other countries are different from those of Korea, thus more evidence from multi-ethnic studies is needed to determine the burden of diabetes among individuals with disability. Although nearly all Koreans (97.2% of the Korean population) are covered by the NHIS, the eligibility criteria for the general health screening program provided by the NHIS vary according to the insurance type of beneficiaries. Employees aged 20 years and older undergo regular health checkups, while the dependents of the employed and family members of the self-employed heads of household were eligible only for those aged 40 years or older. Therefore, the characteristics and distribution of study participants aged 40 years or older might be different from those of aged under 40 years old.
Despite possible biases and limitations, our study has several strengths. First, this is a large-scale, matched cohort study that investigated the prevalence of diabetes among people with disabilities. Second, we classified study participants with disabilities into 15 subclasses using data from the National Disability Registry. To date, there is no comprehensive study examining the prevalence of type 2 diabetes in people with any kind of disability. For diagnostic accuracy, we used combinations of diagnostic codes for type 2 diabetes and prescription data, as well as laboratory data from health examination databases. Unlike other studies that used self-reported questionnaires about disability, we used data from the national registry, which is an objective and reliable way to collect information.
This study provides insight into the current status of diabetes among people with disabilities in Korea. Our study shows the increased likelihood of type 2 diabetes in people with disabilities, regardless of the type of disability. The results from this study also highlight that healthcare authorities should pay attention to diabetes in people with disabilities. With increasing longevity both in the general population and in people with disabilities, diabetes is expected to become a public health problem. Therefore, more studies regarding risk of obesity and other chronic diseases (e.g., hypertension) in people with disability are warranted. Also, further longitudinal studies that examine the effects of disability and preventable risk factors for the development of diabetes such as obesity or physical inactivity are required to understand the link between diabetes and disability.
In conclusion, based on this study, it is clear that the prevalence of diabetes is higher in people with disabilities than in the general population. Physicians should recognize that patients with disabilities face an increased risk of developing diabetes. Policies on prevention, detection, and proper management of type 2 diabetes for the disabled are necessary.
Supplementary Information
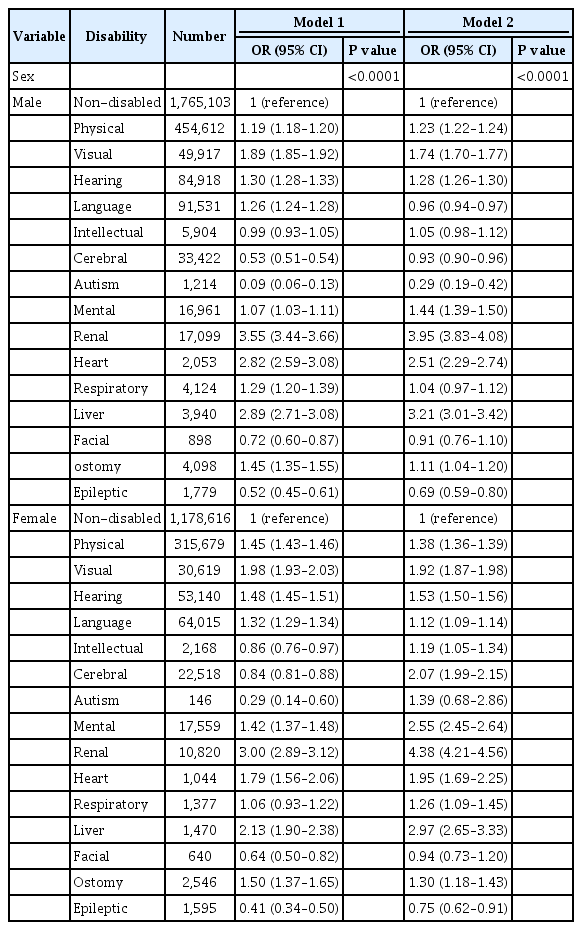
Subgroup Analysis by Sex and Type of Disability
Notes
CONFLICTS OF INTEREST
No potential conflict of interest relevant to this article was reported.
AUTHOR CONTRIBUTIONS
Conception or design: I.J. Acquisition, analysis, or interpretation of data: H.K., S.E.P., K.D.H., Y.G.P. Drafting the work or revising: I.J., E.J.R. Final approval of the manuscript: E.J.R., W.Y.L.