
Articles
- Page Path
- HOME > Endocrinol Metab > Volume 35(2); 2020 > Article
-
Original ArticleMechanisms of the Impact of Hashimoto Thyroiditis on Papillary Thyroid Carcinoma Progression: Relationship with the Tumor Immune Microenvironment
-
Oksana Sulaieva1
 , Olena Chernenko2, Oleksiy Selesnov1, Oleksandr Nechay2, Oleksandr Maievskyi3, Tetyana Falalyeyeva3, Nazarii Kobyliak4, Olena Tsyryuk3, Yurii Penchuk3, Dmytro Shapochka1
 -
Endocrinology and Metabolism 2020;35(2):443-455.
DOI: https://doi.org/10.3803/EnM.2020.35.2.443
Published online: June 30, 2020
1Laboratory of Pathology CSD Health Care, Kyiv, Ukraine
2Ukrainian Research and Practical Center for Endocrine Surgery, Kyiv, Ukraine
3Institute of Biology and Medicine, Taras Shevchenko National University of Kyiv, Kyiv, Ukraine
4Department of Endocrinology, Bogomolets National Medical University, Kyiv, Ukraine
- Corresponding author: Nazarii Kobyliak. Department of Endocrinology, Bogomolets National Medical University, Pushkinska 22a St, Kyiv 01601, Ukraine, Tel: +380-44-235-6005, Fax: +380-44-235-6005, E-mail: nazariikobyliak@gmail.com
Copyright © 2020 Korean Endocrine Society
This is an Open Access article distributed under the terms of the Creative Commons Attribution Non-Commercial License (https://creativecommons.org/licenses/by-nc/4.0/) which permits unrestricted non-commercial use, distribution, and reproduction in any medium, provided the original work is properly cited.
ABSTRACT
-
Background
- The relationship between Hashimoto thyroiditis (HT) and papillary thyroid carcinoma (PTC) remains uncertain. We assessed the impact of HT on the tumor immune microenvironment (TIME) in PTC.
-
Methods
- Thirty patients with PTC (group 1) and 30 patients with PTC and HT (group 2) were enrolled in this pilot study. The distribution and number of CD8+ lymphocytes, plasma cells (CD138+), regulatory T cells (forkhead box P3 [FOXP3+)], mast cell tryptase (MCT+), and M2 macrophages (CD163+) were evaluated. To test the hypothesis that HT impacts PTC development via signal transducer and activator of transcription 6 (STAT6) activation and M2 macrophage polarization, we investigated STAT6 expression in tumor and stromal cells. We also evaluated vascular endothelial growth factor (VEGF) expression by lymph node metastasis (LNM) status.
-
Results
- TIME showed significant between-group differences. Group 1 patients demonstrated immune desert or immune-excluded immunophenotypes, while an inflamed phenotype with more CD8+ cells (P<0.001) predominated in group 2. Immune-excluded TIME was associated with the highest LNM rate. In PTC, LNM was associated with more numerous CD163+ cells. Moreover, LNM in group 1 was associated with increased numbers of mast cells peritumorally and FOXP3+ cells intratumorally and peritumorally. Group 2 demonstrated higher STAT6 but not higher VEGF expression in tumor cells. High VEGF expression was associated with LNM regardless of HT status.
-
Conclusion
- Concomitant HT impacted PTC signaling via STAT6 and TIME by increasing the number of CD8+ cells. LNM is associated with increases in CD163+ cells and VEGF expression in PTC, whereas HT affected LNM through different mechanisms.
- Various countries worldwide, including Ukraine, have observed a recent increase in the number of thyroid cancer cases [1]. The data obtained in the UkrAm Project demonstrated that for at least 21 years after the Chernobyl accident, thyroid cancer risks remained significant [2].
- There are several well-known risk factors for the development and progression of papillary thyroid carcinoma (PTC). In addition to radiation, genetic alterations, and sex, chronic inflammation is involved in malignant transformation of the thyroid [3,4]. While a link between cancer and inflammation has been well-established, such a relationship has not yet been confirmed for inflammatory thyroid diseases [5], the most common of which is Hashimoto thyroiditis (HT) [6]. Chronic inflammation contributes to carcinogenesis by producing mitogenic, antiapoptotic, proangiogenic, and lymphangiogenic factors that could explain the association between HT and PTC [7].
- However, concomitant HT in cases of PTC is associated with a better prognosis than PTC alone [8,9]. In fact, PTC patients with concomitant HT exhibited less aggressive clinicopathological characteristics, including lower rates of extrathyroidal extension (ETE) and lymph node metastasis (LNM) [1,10]. In the investigation of possible mechanisms of association between these conditions, various biomarkers have been identified as potentially being involved in neoplastic transformation from HT to PTC [11]. However, malignant cells are closely related to the tumor immune microenvironment (TIME), which plays a critical role in tumor development and progression by affecting immune surveillance and tumor spread [12,13].
- Different approaches for the evaluation of TIME exist [12,14], and several attempts have been made to classify tumor immunophenotype with regard to TIME. As CD8+ cells are the main cells involved in anti-tumor immune control, most classifications of tumor immunophenotype and assessments of immune score are based on the CD8+ cell count [12,13]. However, the relationship between concomitant HT and TIME in PTC is still not clearly understood, nor is it clear which immune-mediated mechanisms are involved in the impact of HT on PTC outcomes. One possible mechanism is the involvement of tumor-associated macrophages (TAMs). It has previously been shown that TAMs displaying the M2 phenotype facilitate neoangiogenesis and matrix remodeling. Interestingly, in HT, TAM polarization that leads to the activation of the M2 phenotype can be induced by the overexpression of the cytokines interleukin (IL)-4 and IL-13 [15]. In addition, IL-4 and IL-13 have been shown to exert their effects via the signal transducer and activator of transcription 6 (STAT6) protein [16]; therefore, activation by IL-4 and IL-13 as part of HT pathogenesis and progression could be a promising mechanism [17]. This supports the hypothesis that HT can affect PTC development through IL-4–STAT6 axis modulation of TIME and M2 macrophage polarization, facilitating angiogenesis and tumor progression via the action of vascular endothelial growth factor (VEGF) [18,19].
- However, no data yet exist regarding the effect of HT on TIME, STAT6 expression, and VEGF expression in PTC. In this study, we focused on assessing variations in TIME and differences in the numbers of immune cells in PTC according to the coexistence of HT, as well as the relationships of these data with outcomes. In addition, we assessed the role of innate immune cells involved in the regulation of inflammation, repair, angiogenesis, and tumor growth—namely mast cells and macrophages—that are thought to be key TIME cells.
INTRODUCTION
- This study was conducted at the Laboratory of Pathology at CSD Health Care Hospital in collaboration with the Ukrainian Research and Practical Center for Endocrine Surgery. The Institutional Review Board and Local Bioethics Committee of this center approved the study design and the use of human samples (Protocol No. 204 from April 12, 2018). All patients enrolled in the study provided written informed consent.
- Study design
- A total of 30 patients with histologically-confirmed conventional PTC (group 1) and 30 patients with PTC and concomitant HT (group 2) were enrolled. HT diagnosis was based on clinical and sonographic data and was confirmed by the presence of serum autoantibodies to thyroglobulin and thyroid peroxidase and by histological evaluation of slides. The following criteria for HT diagnosis were used: diffuse lymphocyte infiltration, lymphoid follicles with germinal centers, and Hürthle cell changes.
- Inclusion criteria
- All enrolled cases met the following criteria: (1) female sex (to exclude sex-related differences, only female patients were included in the study); (2) patient age of 21 to 54 years at the time of hospital admission; and (3) histologically-confirmed conventional PTC >1 cm but ≤4 cm (pT1b-2) with no ETE. The two groups included equivalent numbers of patients (15 of 30 patients in each group) with and without metastasis.
- Exclusion criteria
- The exclusion criteria were as follows: (1) male sex; (2) patient age under 21 years or over 55 years; (3) diagnosis with other malignancies prior to thyroidectomy; (4) non-conventional PTC; (5) micro-carcinoma, tumor larger than 4 cm, or the presence of ETE; (6) receipt of hormonal replacement therapy prior to diagnostics and surgery; (7) Graves’ disease; (8) pregnancy; and (9) diabetes mellitus.
- Immunohistochemical analysis
- To analyze the role of immune-mediated links between PTC and HT, the immunohistochemical investigation was conducted to count various types of immune cells. The cells of interest were cytotoxic T cells (CD8; clone C8/144B, Dako, Glostrup, Denmark) as effectors of cell-mediated antitumor immunity, plasma cells (CD138; clone MI15, Dako) as effectors of humoral immunity, regulatory T (Treg) cells (forkhead box P3 [FOXP3]; clone EP340, Cell Marque, Rocklin, CA, USA) as cells involved in self-tolerance and immunosuppression, mast cell tryptase (MCT; clone AA1, Diagnostic BioSystems, Pleasanton, CA, USA), and tumor-associated M2 macrophages (CD163; clone MRQ-26, Cell Marque) (Supplemental Table S1).
- The numbers and distributions of these immune cells were examined. In the evaluation of the cell distribution, we considered the interior of the tumor as well as the peritumoral area. In addition, we counted immune cells in the intact thyroid tissue that was unaffected by PTC. The number of immunopositive cells was assessed per square millimeter. A blinded histomorphometric analysis was performed by two independent observers.
- For interpretation of the type of TIME, the following types were considered according to Chen [20]: (1) the immune desert (ID) type, characterized by a lack of pre-existing immunity and a low number of lymphocytes in and around the tumor; (2) the immune-excluded (IE) type, which exhibits prominent peritumor infiltration but a low number of lymphocytes inside the tumor, reflecting the inability of lymphocytes to infiltrate the tumor stroma; and (3) the inflamed type (Inf), in which high infiltration by lymphocytes demonstrates that antitumor T cells have infiltrated the tumor, but fail to function properly.
- To assign TIME type, a semiquantitative evaluation of CD8+ cell infiltration was performed. A threshold of 60 cells per square millimeter was used to stratify CD8+ cell infiltration as either high or low, both in and around the tumor. The ID type was assigned in cases with low CD8+ infiltration in both compartments. The IE type included tumors with low CD8+ infiltration inside the PTC, but high infiltration in the peritumoral area. Finally, cases with high CD8+ infiltration both inside and around PTC foci were considered to be of the Inf immunophenotype. The relationship between immunophenotype and LNM was assessed in both groups.
- To test the hypothesis that the impact of HT on PTC is due to STAT6 activation, we assessed the expression of STAT6 (clone EP325, Cell Marque). In addition, the expression of VEGF (clone VG1, Thermo Fisher Scientific, Waltham, MA, USA) as a key facilitator of tumor angiogenesis and progression was evaluated. STAT6 and VEGF expression levels were assessed in both stroma and tumor cells. The number of immunopositive stromal cells was calculated per square millimeter. The expression levels of STAT6 and VEGF in tumor cells were semi-quantitatively scored on the basis of intensity using a scale of 0 to 3 (0, negative; 1, weak; 2, moderate; 3, strong) and the percentage of positive cells (0%, negative; 1% to 25%, 1+; 26% to 50%, 2+; >50%, 3+). The output included a total score, which was derived by multiplying the staining extent by the staining intensity.
- Statistical analysis
- Mathematical and statistical processing of the results was carried out using MedCalc software (MedCalc Software, Mariakerke, Belgium). The data were evaluated for the existence of a normal distribution using the Shapiro-Wilk test. Further analysis was performed using one-way analysis of variance. The results were presented in the form of mean±standard error of the mean with 95% confidence interval (CI). P values ≤0.05 were considered to indicate statistical significance.
METHODS
- Patient age was similar in groups 1 and 2 (47.6±0.65 years vs. 48.5±0.48 years, respectively). PTC size was also comparable, at 18.1±0.49 mm (range, 17.1 to 19.0) and 19.2±0.72 mm (range, 17.8 to 20.7), respectively.
- Characteristics of TIME in patients with PTC with regard to HT status
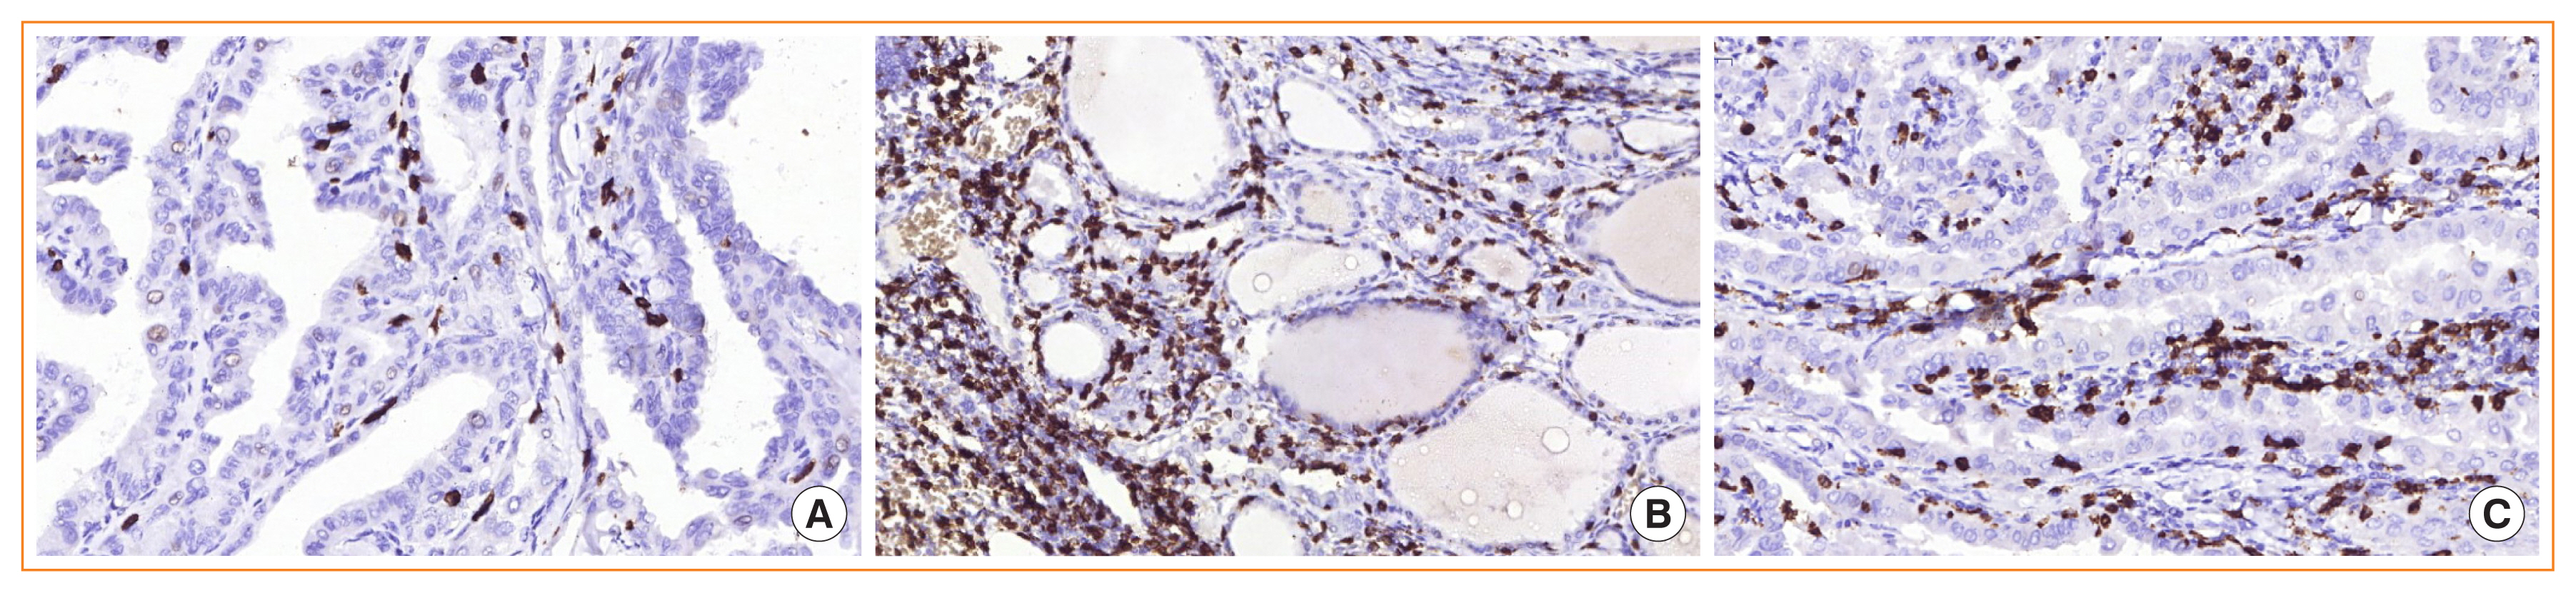
- We first assessed the impact of HT on TIME by evaluating the number of immune cells in PTC and PTC+HT patients in the intact thyroid, the peritumoral area, and inside the PTC (in tumor nests in the central part of the tumor). Assessment of PTC histopathology in patients with coexisting HT revealed high infiltration in both intact thyroid tissues and the PTC. In addition, tumor nodules were surrounded with lymphohistiocytic infiltration. Dense lymphocytic infiltration due to HT was associated with changes in thyroid structure, with alteration of the histological architecture and cytological atypia. As expected, the numbers of all immune cells in intact thyroid tissues were significantly higher in patients with PTC and HT than in patients with PTC alone (Table 1).
- PTC areas demonstrated high numbers of M2 macrophages and mast cells regardless of HT coexistence, although their number and distribution varied widely between groups. In contrast, the number of cells involved in adaptive immunity (plasma cells and cytotoxic T cells) was much higher in group 2 than in group 1, both inside and around the tumor (P<0.001) (Fig. 1). Interestingly, despite higher numbers of Treg cells in group 2 patients, no statistically significant differences were found in the number of FOXP3+ cells either inside or around the PTC. It is important to note that FOXP3 cells were rare (up to only 5 to 10 cells per square millimeter), suggesting that the lack of Treg-mediated immunosuppression could explain the relatively benign progression and outcome of PTC.
- Thus, as expected, coexistence with HT was associated with changes in tumor immune infiltration characteristics and TIME type (Table 2). The TIME phenotype distribution differed to a significant extent between groups (P<0.001). Group 1 patients demonstrated ID or IE immunophenotypes, while the Inf immunophenotype predominated in group 2.
- TIME and the risk of lymph node metastasis
- We next compared the rate of LNM in patients with different TIME types. We found that TIME type was associated with differences in the LNM rate with some group-specific peculiarities (Table 2).
- The ID immunophenotype, characterized by a low number of lymphocytes, was found only among group 1 patients, specifically in 16 cases (53.3% of group 1). LNM was observed in 37.5% of these patients. The IE type, with prominent peritumor infiltration, was found in 16 patients, 13 of whom were from group 1 (81.25%). Only three cases were in patients with concomitant HT, and all of these cases exhibited LNM. Interestingly, this TIME type was associated with the highest rate of LNM (75% overall). The Inf immunophenotype, with high lymphocytic infiltration, was found in only one case in group 1 with no LNM. However, it was the predominant TIME type in group 2 (27 of 30 patients; 90%), and it was accompanied by LNM in 44.4% of cases.
- In addition to the numbers of CD8+ cells, we assessed whether the TIME type was related to variability in the abundance of other immune cell types. To do so, we evaluated the numbers of various cells in patients with different TIME types (Table 3). PTC with the IE immunophenotype was associated with the highest infiltration by M2 macrophages, mast cells, and Treg cells (P<0.001), which could explain the relatively high rate of LNM in this group.
- Thus, the TIME type was associated with diversity in the quantity and spatial distribution of immune cells, as well as with the risk of LNM.
- Cellular mechanisms of LNM in patients with and without HT
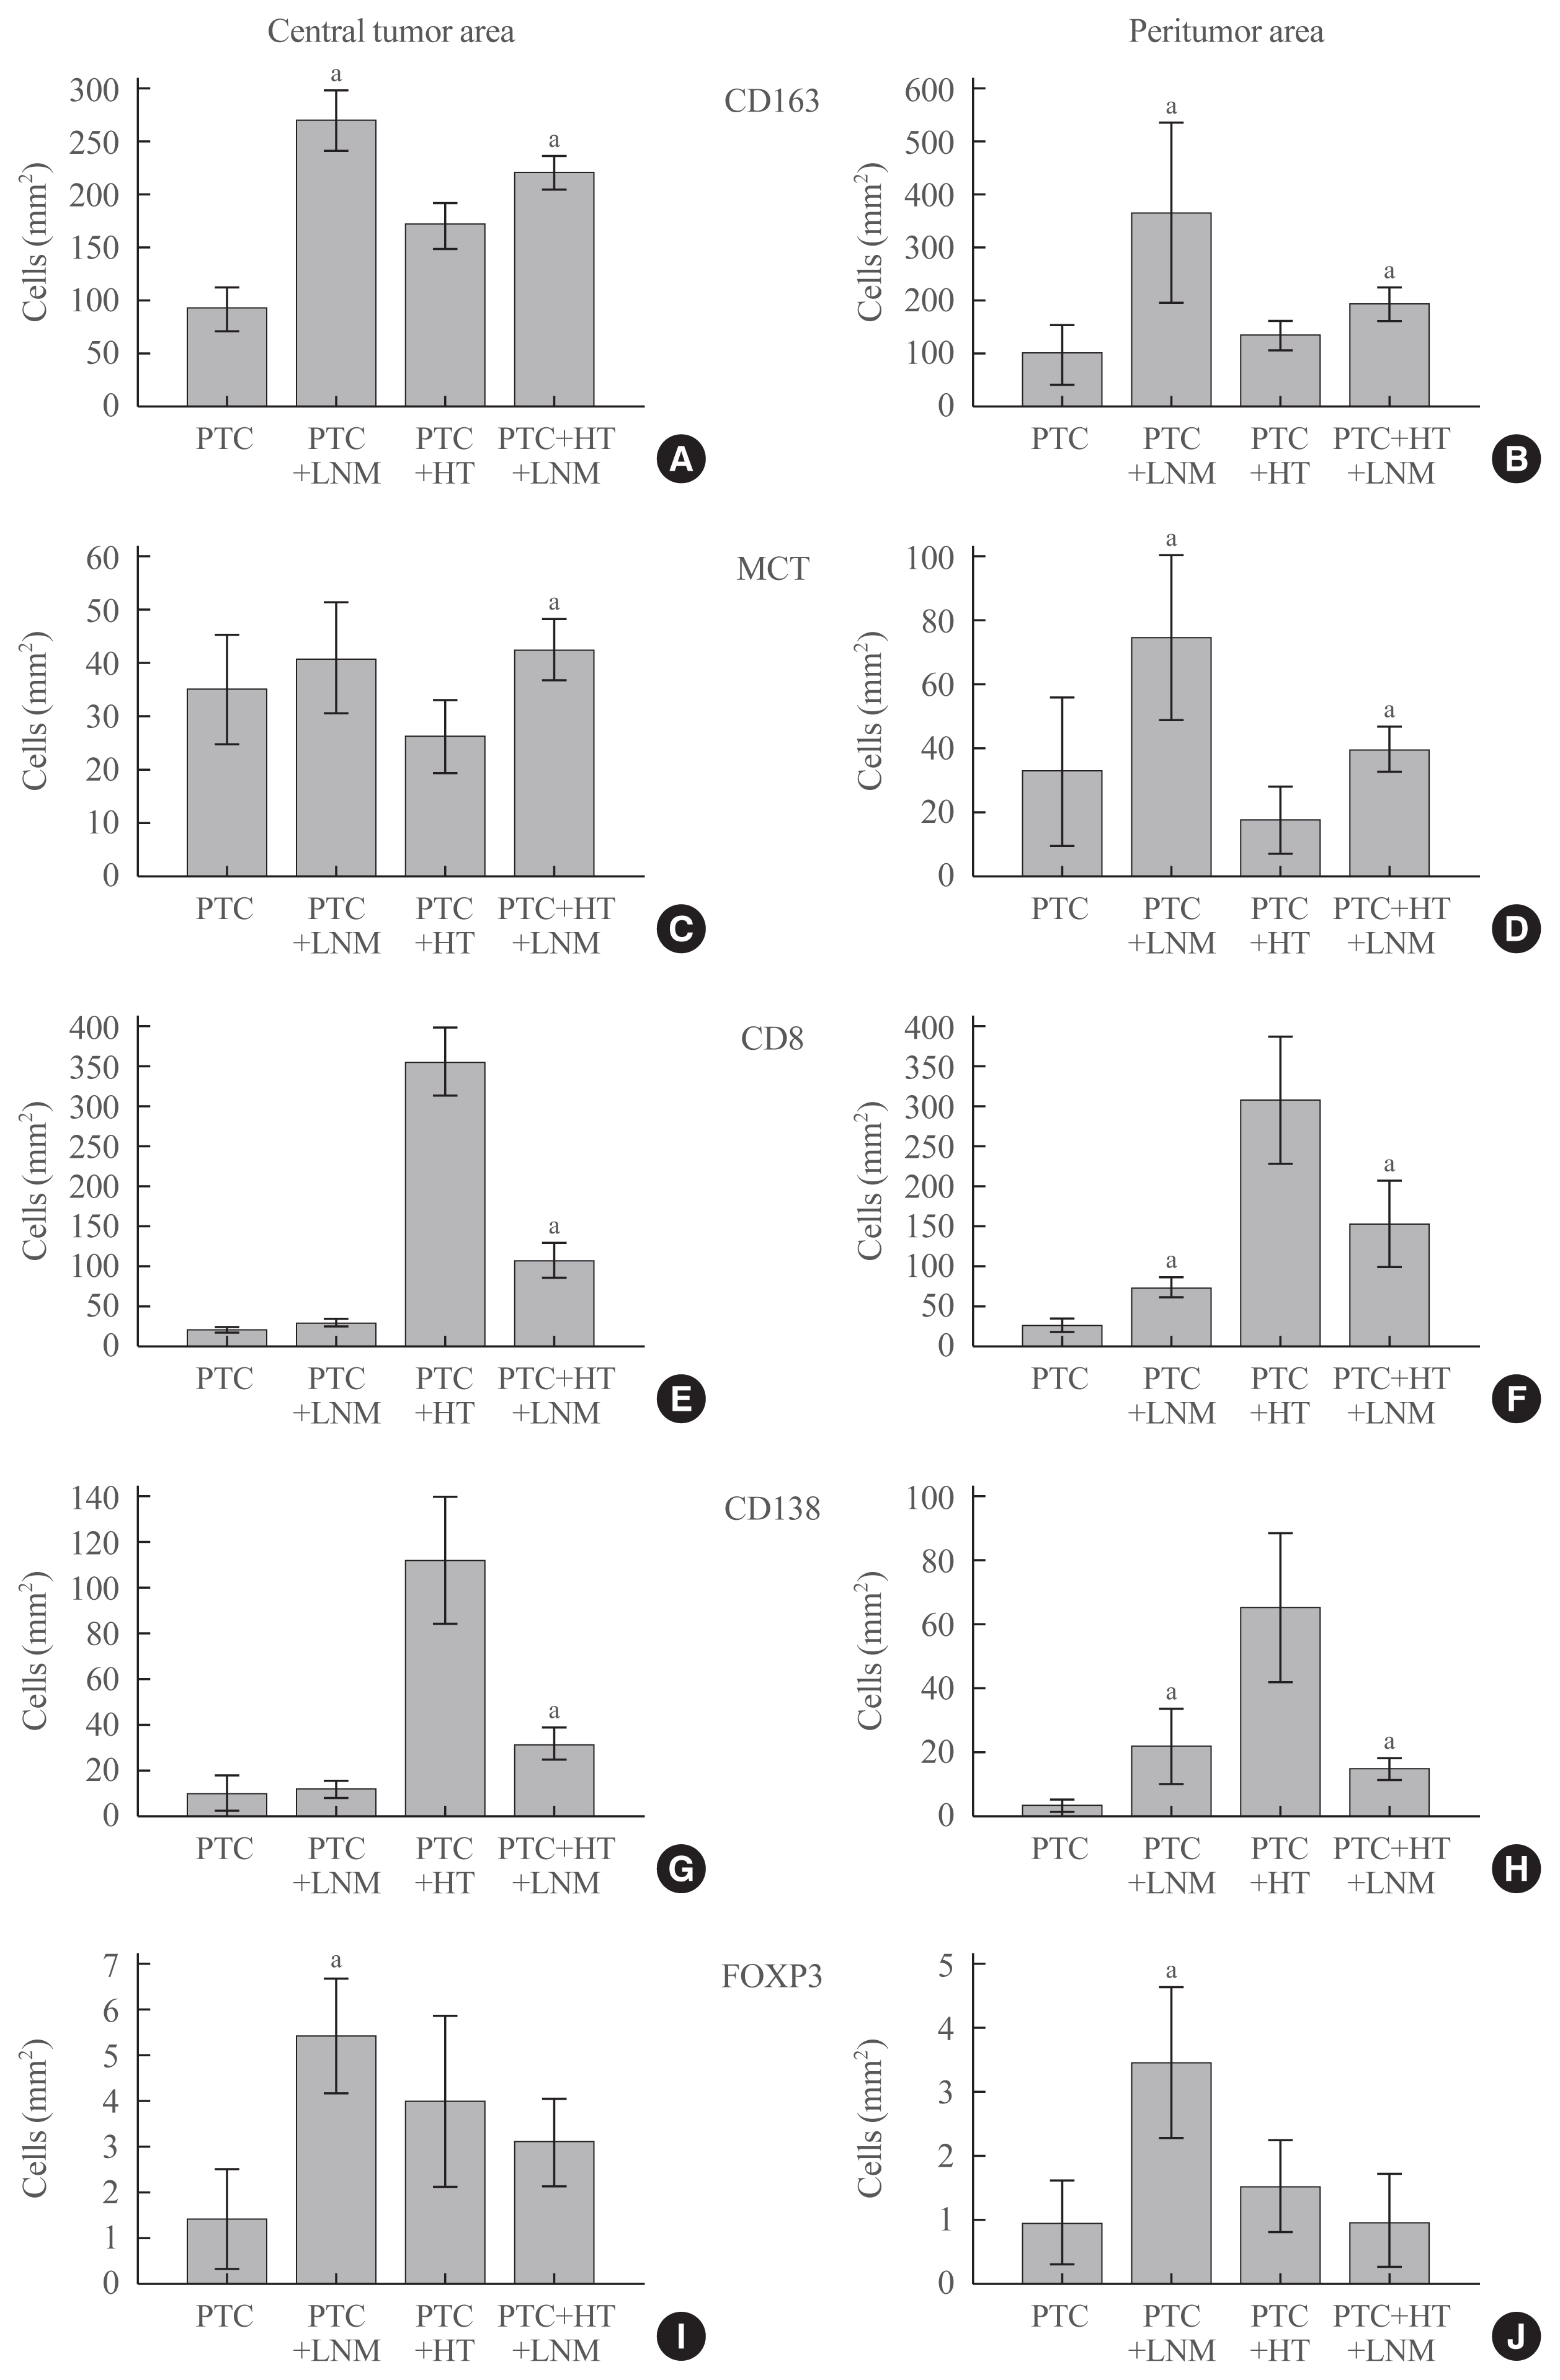
- To determine which cells play key roles in LNM development, we evaluated the numbers of different cells with regard to the coexistence of HT and LNM. As shown in Fig. 2, LNM development in patients with PTC alone was associated with an increased number of M2 macrophages in both the central tumor area and the peritumor zone. No statistically significant difference in MCT number was observed between group 1 patients with and without LNM (Fig. 3). Surprisingly, LNM was associated with slightly increased infiltration of the peritumoral area with CD8+ (P=0.024) and CD138+ (P=0.008) cells, reflecting the role of the IE TIME type. In addition, LNM in PTC with HT was accompanied by an elevated number of FOXP3 cells in both the central and peritumoral areas (P<0.001).
- In contrast, patients with concomitant HT exhibited the involvement of different cells. Progression of PTC in group 2 patients was associated with a significant increase in the number of mast cells, a slight elevation of the number of M2 macrophages, and a prominent decrease in CD8+ and CD138+ cells in both the central tumor and the peritumoral area. However, we found no significant differences in Treg number regarding LNM status.
- Thus, PTC with concomitant HT demonstrated a specific immune profile, and different mechanisms of PTC progression were found depending on HT status.
- STAT6 and VEGF expression in patients with PTC with regard to HT coexistence and LNM
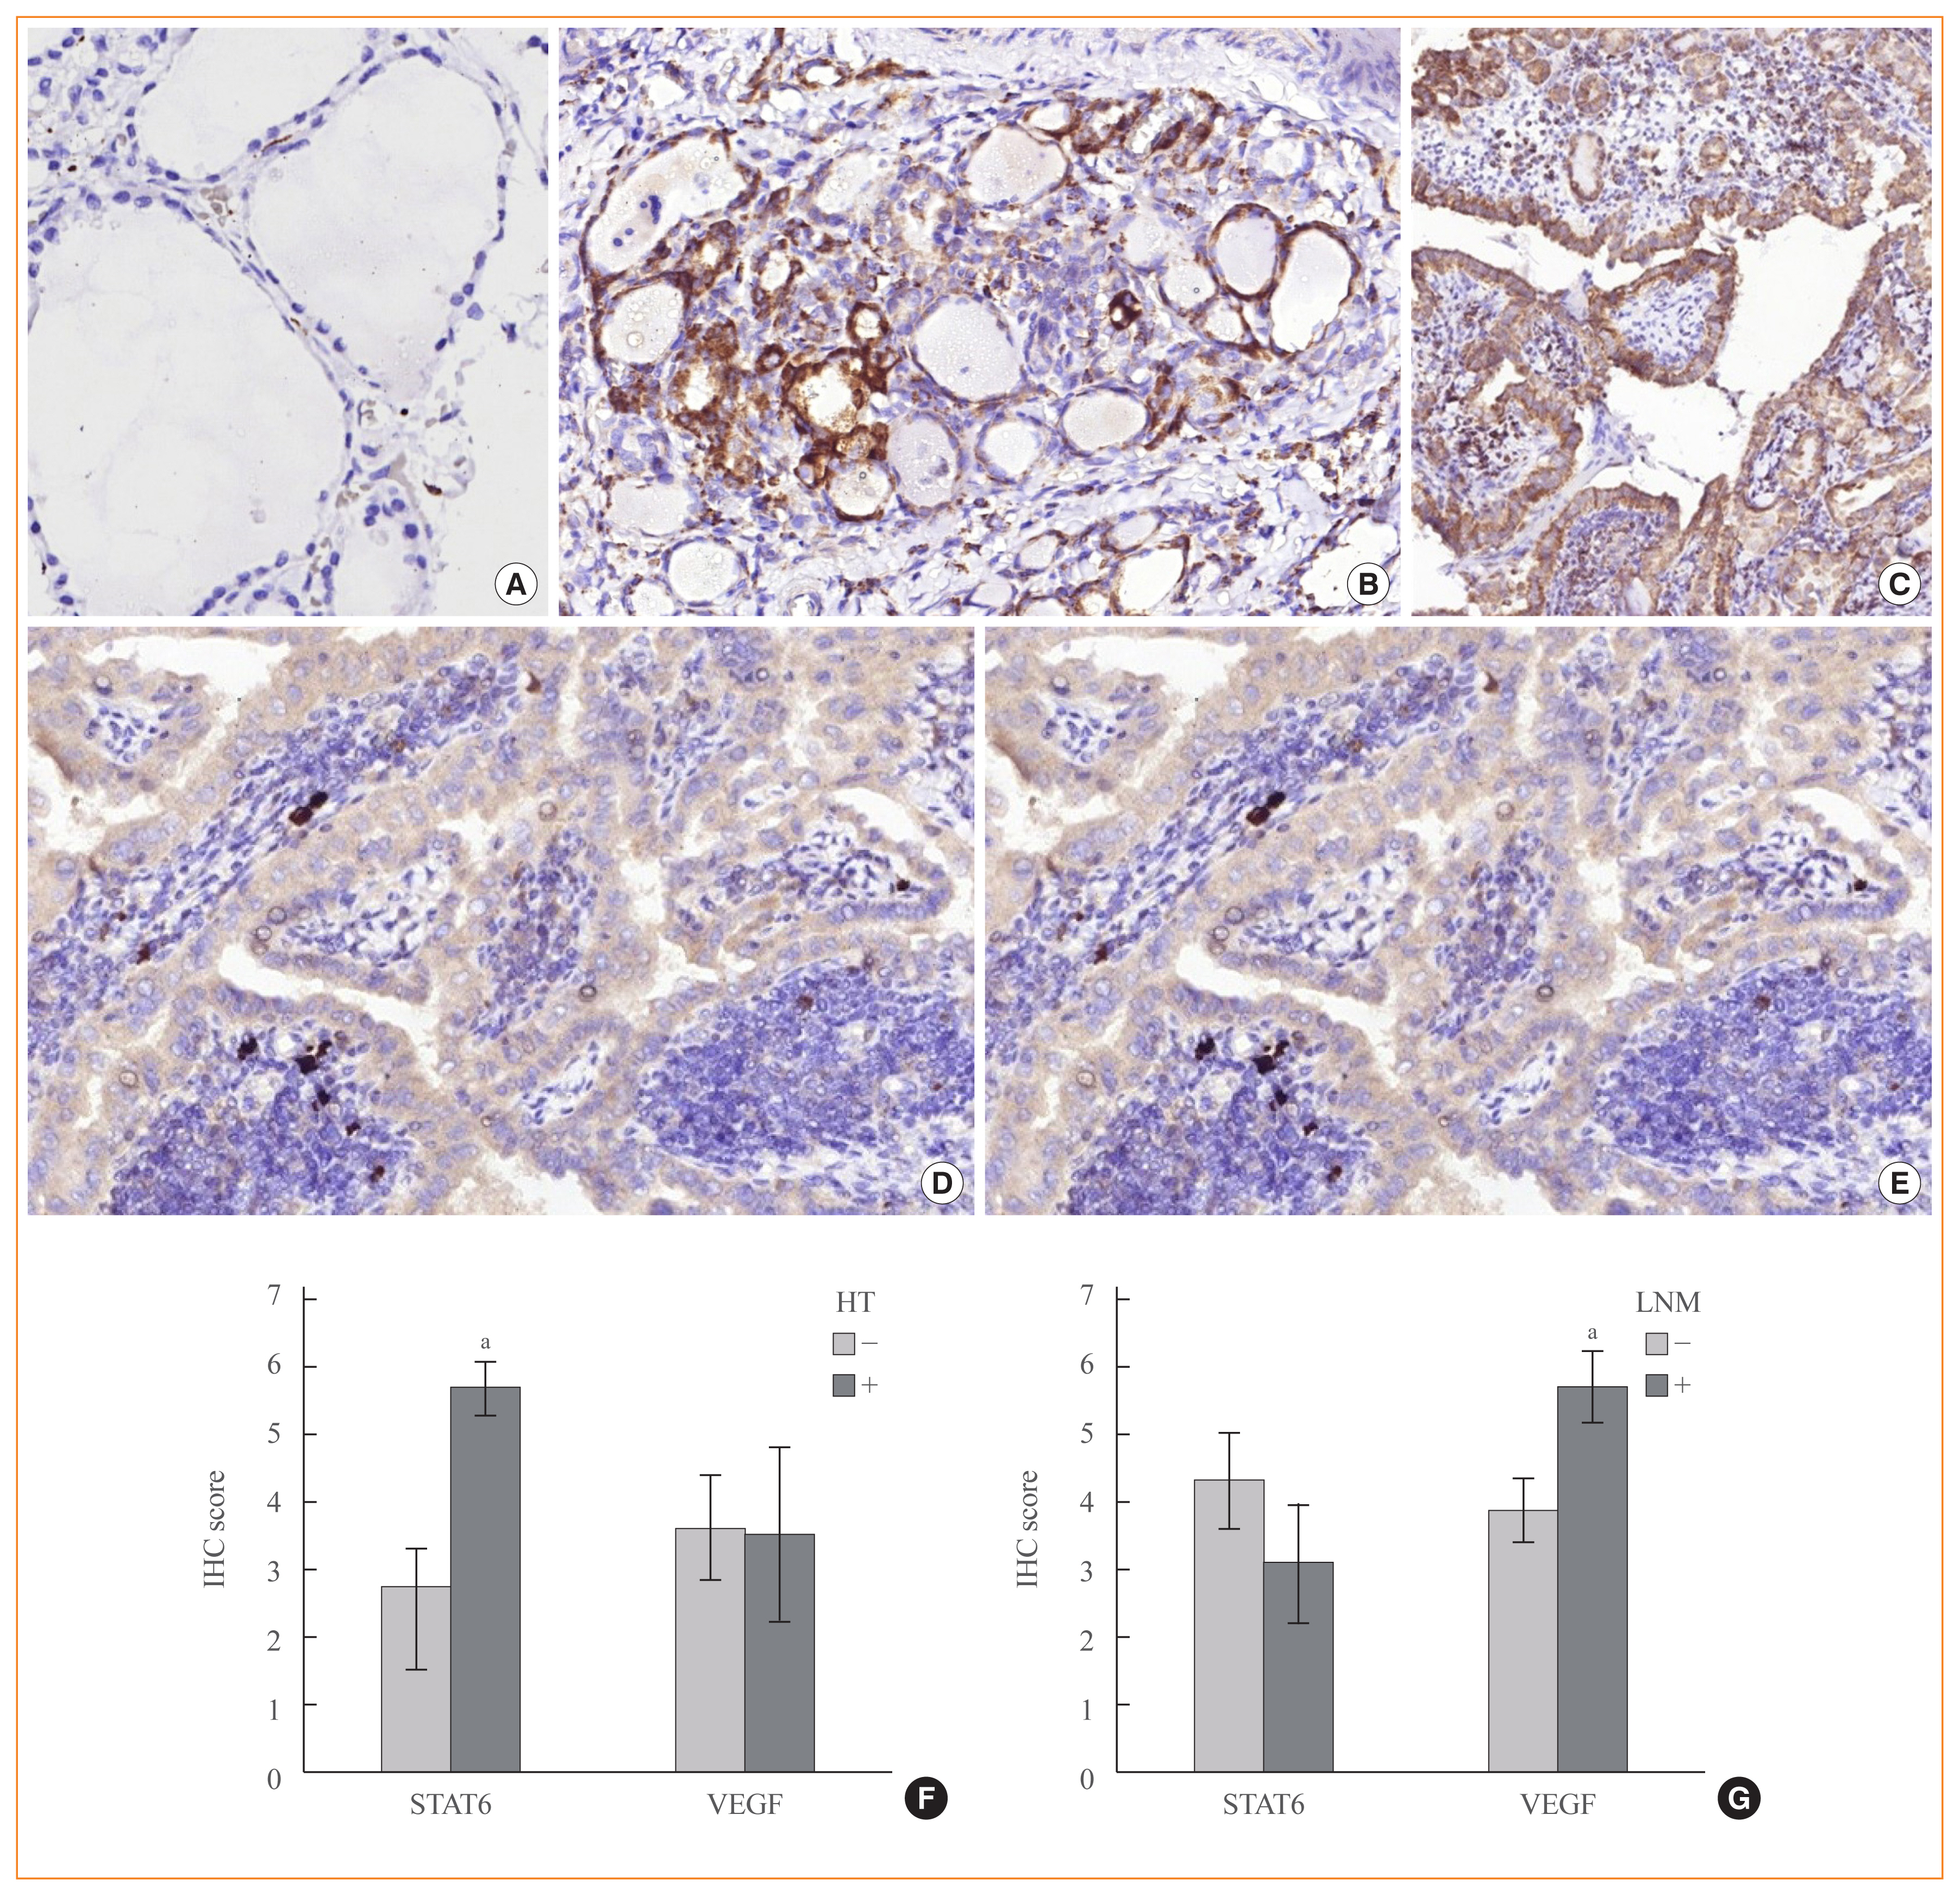
- To discover possible mechanisms behind the relationship between immune-mediated inflammation and PTC characteristics, we assessed the expression of STAT6 and VEGF. Surprisingly, in addition to a stromal immunopositive reaction to STAT6, we observed STAT6 expression in tumor cells inside the PTC. Stromal cells had strong immunoreactivity (3+) and widely varied in number, correlating with the count of M2 macrophages (r= 0.648, P<0.001). This supports the role of STAT6 in macrophage polarization.
- While intact follicular cells did not express STAT6, tumor cells inside the PTC demonstrated mild to high expression of STAT6, the total score of which correlated with the degree of lymphocytic infiltration (r=0.816, P<0.001) and which was significantly higher in group 2 patients (P=0.001) (Fig. 4). In addition, in group 2 patients, thyroid tissue unaffected by PTC demonstrated a STAT6-positive reaction that was associated with histological and cytological atypia of follicular cells. This reflects the direct immune-mediated mechanisms of STAT6 activation in follicular tumor cells and indicates a need for further investigation of its role in tumor transformation and growth in patients with HT. However, we found no differences in STAT6 expression in PTC cells with regard to LNM status.
- VEGF expression was also observed both in stromal cells and inside PTC cells. Numerous VEGF-positive stromal cells were present and corresponded in number and distribution to CD163+ cells. In addition, mild to moderate VEGF expression was observed in the tumor cells of the PTC. The total score for VEGF expression in tumor cells varied from 2 to 6. We found no difference in the total VEGF expression score in PTC cells between patients with and without coexisting HT. In addition, no significant correlation was observed between VEGF expression and STAT6 expression. However, the intensity of VEGF expression in PTC cells was significantly higher in patients with LNM independent of HT coexistence (Fig. 4).
- Thus, assessment of STAT6 and VEGF expression in patients of varying node status showed that the expression of STAT6 was slightly lower in patients with metastasis; however, this difference was not statistically significant. In contrast, high VEGF expression was associated with LNM (P<0.001), reflecting the relationship between this growth factor and PTC progression.
RESULTS
- A key factor in the determination of tumor progression is the proportion and spatial distribution of cytotoxic T lymphocytes within the TIME. It has been reported that de novo carcinogenesis is associated with the inability of antitumor T cells to control tumor growth due to tumor-induced tolerance mechanisms [21].
- The results of the present study revealed that the TIME in PTC had varying characteristics that were associated with the presence or absence of concomitant HT. HT coexistence was found to be associated with an elevated number of CD8+ cells; this supported the results of previous studies that showed that HT promotes the recruitment of T lymphocytes, including CD4+ cells, cytotoxic T lymphocytes (CD8+), and Th17 cells, to the thyroid gland [22]. In addition, HT patients exhibited significantly higher expression of the Th1 transcription factor T-bet than did healthy controls [23]. Th1 cells are induced in response to interferon-γ and IL-12, which are secreted primarily by dendritic and natural killer cells and which promote cytotoxic T cell proliferation and differentiation [24]. This could explain the higher number of CD8+ cells in PTC with HT than in PTC alone. In patients with concomitant HT, the number of CD8+ cells was significantly higher in the PTC interior than in intact thyroid tissue, affecting the TIME. To the extent that the number of CD8+ cells reflects the activation of the antitumor response, this finding supports the concept that HT coexistence could facilitate the activation of antitumor immunity and the promotion of a cancer immune cycle that affects TIME characteristics.
- Currently, three broad classes of TIME have been described on the basis of heterogeneity in the spatial distribution of CD8+ lymphocytes [12]. Tumors with the ID immunophenotype are characterized by an absence of CD8+ cells that corresponds to a lack of pre-existing antitumor immunity. This phenotype can reflect either poor tumor immunogenicity due to a low mutational load or the lack of antigen release or failure of antigen presentation and T-cell activation due to insufficiency of dendritic cells or disrupted costimulatory interactions [20].
- The IE phenotype is associated with an abundance of CD8+ cells in the tumor stroma in the peritumoral area. However, the T cells cannot reach tumor cells, which reflects altered mechanisms of T-lymphocyte recruitment into tumor nests due to a lack of chemokines or low levels of chemokine receptors [25]. In addition, high expression of molecules responsible for vasculogenesis and angiogenesis, such as VEGF, can render antitumor immunity ineffective [19].
- Interestingly, most PTC cases in group 1 were associated with the ID or IE immunophenotype. This reflects the alteration of early steps of the cancer immune cycle, including either antigen recognition and presentation with activation of T cells or CD8+ cell trafficking into the tumor [26]. In contrast, PTC with HT demonstrated predominantly an Inf immunophenotype, which is characterized by an abundance of tumor-infiltrating immune cells, including CD8+ T cells. In addition, HT coexistence with the Inf immunophenotype was associated with a relatively high number of plasma cells, reflecting activation of both cell-mediated and humoral immunity.
- The Inf immunophenotype is typical for immunologically hot tumors; however, the abundance of tumor-infiltrating lymphocytes is associated with the arrest of antitumor immunity [27]. This may be related to various factors, including a lack of the major histocompatibility complex on tumor cells, high expression of immune checkpoint markers, or the effects of immunosuppressive cells such as Treg cells and myeloid-derived suppressor cells [28].
- In an attempt to decipher the mechanisms of immunosuppression, we assessed the number and spatial distribution of Treg cells. Under physiological conditions, Treg cells play essential roles in maintaining self-tolerance and protecting against autoimmunity [29]. Accordingly, Treg cell depletion has been shown to promote autoimmune thyroiditis [22]. However, Treg cells can suppress antitumor immunity, thereby hindering immunosurveillance against cancer development and progression.
- Previous studies have shown that elevation of Treg cells in primary tumors is associated with metastasis and poor prognosis [30]. These cells facilitate tumor immune escape by producing cytokines (IL-10, transforming growth factor-β, and IL-35) and by inhibiting T-cell receptor activation [31]. However, in our study, we found that most patients with PTC had few Treg cells. Although Treg cells were more numerous in cases of PTC with coexisting HT, the overall number of these cells was low and did not significantly differ between intact and tumor-affected tissues. Only a few patients had high numbers of FOXP3, and all of those patients exhibited IE and LNM.
- Thus, concomitant HT impacts the TIME by increasing the number of CD8+ cells inside and around the tumor, reflecting the facilitation of antitumor immunity. Nonetheless, in the future, the roles of other cells in PTC progression should be assessed in some cases involving LNM.
- Another component of TIME that greatly impacts tumor growth and the promotion of immune evasion involves tumor-infiltrating macrophages [27]. It is widely accepted that hypoxia and metabolic reprogramming can promote the polarization of TAMs from the pro-inflammatory M1 type to the immunosuppressive M2 phenotype [32]. Classically activated M1-like macrophages are able to kill tumor cells directly through an early elimination phase of immuno-editing orchestrated by CD8+ cytotoxic T lymphocytes and interferons [33]. However, M2 macrophages are much more abundant in malignancies [31]. The presence of these cells correlates with angiogenesis, immunosuppression, and the promotion of cancer growth and metastasis [34].
- We found no significant difference in the number of CD163+ M2 macrophages between patients with only PTC and those with PTC and concomitant HT. However, a comparison of the number of CD163+ cells in PTC of different immunophenotypes revealed that the IE type was associated with the highest number of M2 cells in both the central tumor area and the peritumoral stroma. In addition, significant changes were found in the number of mast cells in the peritumoral area in PTC with the IE immunophenotype. These findings align with the common concept of the role of M2 macrophages in immunosuppression, which is realized through diverse mechanisms. First, M2 cells can express programmed death ligand 1 (PD-L1) and induce PD-L1 expression on dendritic cells [35]. PD-L1, as well as programmed death ligand 2, bind programmed cell death protein 1 on T cells, suppressing their functions. Second, CD163+ macrophages secrete immunosuppressive cytokines such as IL-10 and transforming growth factor-β, which directly suppress CD8+ T cells and dendritic cells [33]. Moreover, due to the expression of arginase and indoleamine, 2,3-dioxygenase M2 cells are responsible for metabolic reprogramming and starvation in T cells [34].
- As the IE immunophenotype of PTC was associated with the highest rate of LNM among the observed cases, it seems that an increased number of M2 macrophages and mast cells inside the tumor, and especially in peritumor compartments, and their prevalence along with CD8+ cells are associated with tumor progression. To analyze the role of various immune cells in PTC progression, we compared the number of immune cells in PTC with and without metastases and with and without concomitant HT.
- Depending on HT status, PTC demonstrates different mechanisms of antitumor immunity failure, as reflected by the tumor immunophenotype. As expected, LNM development in patients with PTC alone was associated with an increased number of M2 cells in both the primary tumor and lymph nodes affected by metastases, confirming the role of CD163 cells in PTC progression. In addition, LNM development in group 1 patients was associated with a high number of mast cells in the peritumoral area and an increase in the number of FOXP3+ cells inside and around the PTC. The increased number and role of mast cells in thyroid cancer has been shown previously [36]. These cells are responsible for the production of numerous proangiogenic factors, including VEGFs [25]. Accordingly, in the present study, PTC with LNM was associated with increased expression of VEGF. This proangiogenic growth factor was expressed in both stromal and tumor cells. Several types of stromal cells are involved in VEGF expression, including M2 macrophages and mast cells, and these contribute to neoangiogenesis [37]. However, tumor cell expression of VEGF was associated with PTC aggressiveness and LNM development.
- Interestingly, LNM development in PTC with concomitant HT was associated with other immune-mediated mechanisms. In group 2, metastasis was associated with decreased numbers of CD8+ and CD138+ cells and increased numbers of CD163 and mast cells in both central and peritumoral areas, although the difference in M2 macrophage number was less prominent than in group 1. In addition, in group 2, no significant difference was found regarding FOXP3 cell number in patients with and without LNM.
- Such differences demonstrate that LNM development in patients with coexisting HT is associated with the failure of cytotoxic T cells. However, regardless of HT status, PTC progression was associated with an increased number of M2 macrophages.
- This fact underscores the importance of understanding the molecular control of macrophage phenotype and the mechanisms of TAM polarization. As previously mentioned, IL-4 and IL-13 are involved in M2-phenotype polarization via STAT6, which mediates the transcriptional activation of M2 macrophage-specific genes such as arginase 1 (Arg1), mannose receptor 1 (Mrc1), resistin-like alpha (Retnla, Fizz1), chitinase-like protein 3 (Chil3, Ym1), and the chemokine genes Ccl17 and Ccl24 [38].
- In this study, we assessed the expression of STAT6 and its relationship with tumor characteristics. STAT6 expression was observed in both tumor cells and the stroma. Stromal cells displayed a high-intensity immunopositive reaction that was correlated with the number of M2 macrophages. However, tumor cells expressed STAT6 in different patterns. The highest level of STAT6 expression was found in a patient with PTC and concomitant HT, and this expression correlated with the density of lymphocytic infiltration. In addition, we observed STAT6 expression in atypical thyroid cells outside of the PTC in zones with dense infiltration by lymphocytes. The STAT6 signaling pathway is believed to induce epigenetic changes, leading to decreased responsiveness to inflammatory signals [39]; in this fashion, immune-mediated STAT6 activation in follicular and PTC cells may be a form of adaptation to immune attack [18]. In contrast, STAT6 mediates antiapoptotic biological responses through the induction of BCL2L1/BCL-XL, which could be a mechanism to evade the apoptosis of tumor cells [17]. Therefore, STAT6 is involved not only in macrophage polarization, but also in tumor cell transformation and biology under conditions of chronic inflammation. Nevertheless, we found no significant relationship between STAT6 expression in tumor cells and LNM development. Thus, PTC with coexisting HT demonstrates a specific immune profile, and the mechanisms of PTC progression differ depending on HT status.
- In this pilot study, we demonstrated that HT coexistence was associated with higher numbers of CD8+ and CD138+ cells in the PTC and peritumoral area. Regarding TIME, HT coexistence was associated with predominance of the Inf immunophenotype, whereas PTC without HT predominantly demonstrated the ID or IE immunophenotype. The IE immunophenotype was associated with a higher rate of LNM due to prominent M2 macrophages and mast cell infiltration. HT coexistence was associated with STAT6 expression in tumor cells, but did not affect VEGF expression in either stromal cells or PTC cells. The upregulation of VEGF in PTC cells was associated with LNM development independently of HT coexistence.
- The main limitation of this study is the small number of cases. In addition, only middle-aged women with conventional T1b-T2 PTC were enrolled in the study. The lack of genetic testing may also have affected the results.
DISCUSSION
Supplementary Information
-
CONFLICTS OF INTEREST
No potential conflict of interest relevant to this article was reported.
-
AUTHOR CONTRIBUTIONS
Conception or design: O.S., O.C., O.N., N.K. Acquisition, analysis, or interpretation of data: O.C., O.N., O.T., Y.P., D.S. Drafting the work or revising: O.N., O.M., T.F., D.S. Final approval of the manuscript: O.S., N.K.
Article information

- 1. Zhu F, Shen YB, Li FQ, Fang Y, Hu L, Wu YJ. The effects of Hashimoto thyroiditis on lymph node metastases in unifocal and multifocal papillary thyroid carcinoma: a retrospective Chinese cohort study. Medicine (Baltimore) 2016;95:e2674.ArticlePubMedPMC
- 2. Tronko M, Mabuchi K, Bogdanova T, Hatch M, Likhtarev I, Bouville A, et al. Thyroid cancer in Ukraine after the Chernobyl accident (in the framework of the Ukraine-US Thyroid Project). J Radiol Prot 2012;32:N65–9.ArticlePubMedPMC
- 3. Lee KH, Seok EY, Kim EY, Yun JS, Park YL, Park CH. Different prognostic values of individual hematologic parameters in papillary thyroid cancer due to age-related changes in immunity. Ann Surg Treat Res 2019;96:70–7.ArticlePubMed
- 4. Sulaieva O, Chernenko O, Chereshneva Y, Tsomartova D, Larin O. Thyroid stimulating hormone levels and BRAFV600E mutation contribute to pathophysiology of papillary thyroid carcinoma: relation to outcomes? Pathophysiology 2019;26:129–35.ArticlePubMed
- 5. Resende de Paiva C, Gronhoj C, Feldt-Rasmussen U, von Buchwald C. Association between Hashimoto’s thyroiditis and thyroid cancer in 64,628 patients. Front Oncol 2017;7:53.PubMedPMC
- 6. Konturek A, Barczynski M, Wierzchowski W, Stopa M, Nowak W. Coexistence of papillary thyroid cancer with Hashimoto thyroiditis. Langenbecks Arch Surg 2013;398:389–94.ArticlePubMed
- 7. Fang W, Ye L, Shen L, Cai J, Huang F, Wei Q, et al. Tumor-associated macrophages promote the metastatic potential of thyroid papillary cancer by releasing CXCL8. Carcinogenesis 2014;35:1780–7.ArticlePubMedPDF
- 8. Borowczyk M, Janicki A, Dworacki G, Szczepanek-Parulska E, Danieluk M, Barnett J, et al. Decreased staging of differentiated thyroid cancer in patients with chronic lymphocytic thyroiditis. J Endocrinol Invest 2019;42:45–52.ArticlePubMedPDF
- 9. Marotta V, Sciammarella C, Chiofalo MG, Gambardella C, Bellevicine C, Grasso M, et al. Hashimoto’s thyroiditis predicts outcome in intrathyroidal papillary thyroid cancer. Endocr Relat Cancer 2017;24:485–93.ArticlePubMed
- 10. Huang BY, Hseuh C, Chao TC, Lin KJ, Lin JD. Well-differentiated thyroid carcinoma with concomitant Hashimoto’s thyroiditis present with less aggressive clinical stage and low recurrence. Endocr Pathol 2011;22:144–9.ArticlePubMedPDF
- 11. Means C, Clayburgh DR, Maloney L, Sauer D, Taylor MH, Shindo ML, et al. Tumor immune microenvironment characteristics of papillary thyroid carcinoma are associated with histopathological aggressiveness and BRAF mutation status. Head Neck 2019;41:2636–46.ArticlePubMed
- 12. Binnewies M, Roberts EW, Kersten K, Chan V, Fearon DF, Merad M, et al. Understanding the tumor immune microenvironment (TIME) for effective therapy. Nat Med 2018;24:541–50.ArticlePubMedPMCPDF
- 13. Caruana I, Simula L, Locatelli F, Campello S. T lymphocytes against solid malignancies: winning ways to defeat tumours. Cell Stress 2018;2:200–12.ArticlePubMedPMCPDF
- 14. Can NY, Ayturk S, Celik M, Sezer YA, Ozyilmaz F, Tastekin E, et al. Histological perspective on the effects of tumor-associated macrophages in the tumor microenvironment surrounding papillary thyroid carcinoma. Pol J Pathol 2016;67:332–44.ArticlePubMed
- 15. Binnemars-Postma K, Bansal R, Storm G, Prakash J. Targeting the Stat6 pathway in tumor-associated macrophages reduces tumor growth and metastatic niche formation in breast cancer. FASEB J 2018;32:969–78.ArticlePubMed
- 16. Hebenstreit D, Wirnsberger G, Horejs-Hoeck J, Duschl A. Signaling mechanisms, interaction partners, and target genes of STAT6. Cytokine Growth Factor Rev 2006;17:173–88.ArticlePubMed
- 17. Yu T, Gan S, Zhu Q, Dai D, Li N, Wang H, et al. Modulation of M2 macrophage polarization by the crosstalk between Stat6 and Trim24. Nat Commun 2019;10:4353.ArticlePubMedPMCPDF
- 18. Czimmerer Z, Daniel B, Horvath A, Ruckerl D, Nagy G, Kiss M, et al. The transcription factor STAT6 mediates direct repression of inflammatory enhancers and limits activation of alternatively polarized macrophages. Immunity 2018;48:75–90.ArticlePubMedPMC
- 19. de Araujo-Filho VJ, Alves VA, de Castro IV, Lourenco SV, Cernea CR, Brandao LG, et al. Vascular endothelial growth factor expression in invasive papillary thyroid carcinoma. Thyroid 2009;19:1233–7.ArticlePubMed
- 20. Chen DS, Mellman I. Oncology meets immunology: the cancer-immunity cycle. Immunity 2013;39:1–10.ArticlePubMed
- 21. Willimsky G, Blankenstein T. Sporadic immunogenic tumours avoid destruction by inducing T-cell tolerance. Nature 2005;437:141–6.ArticlePubMedPDF
- 22. Gonzalez-Amaro R, Marazuela M. T regulatory (Treg) and T helper 17 (Th17) lymphocytes in thyroid autoimmunity. Endocrine 2016;52:30–8.ArticlePubMedPDF
- 23. Safdari V, Alijani E, Nemati M, Jafarzadeh A. Imbalances in T cell-related transcription factors among patients with Hashimoto’s thyroiditis. Sultan Qaboos Univ Med J 2017;17:e174–80.ArticlePubMedPMC
- 24. Antonelli A, Ferrari SM, Corrado A, Di Domenicantonio A, Fallahi P. Autoimmune thyroid disorders. Autoimmun Rev 2015;14:174–80.ArticlePubMed
- 25. Galdiero MR, Varricchi G, Marone G. The immune network in thyroid cancer. Oncoimmunology 2016;5:e1168556.ArticlePubMedPMC
- 26. Horton BL, Fessenden TB, Spranger S. Tissue site and the cancer immunity cycle. Trends Cancer 2019;5:593–603.ArticlePubMedPMC
- 27. Bindea G, Mlecnik B, Tosolini M, Kirilovsky A, Waldner M, Obenauf AC, et al. Spatiotemporal dynamics of intratumoral immune cells reveal the immune landscape in human cancer. Immunity 2013;39:782–95.ArticlePubMed
- 28. Xiong H, Mittman S, Rodriguez R, Pacheco-Sanchez P, Moskalenko M, Yang Y, et al. Coexpression of inhibitory receptors enriches for activated and functional CD8+ T cells in murine syngeneic tumor models. Cancer Immunol Res 2019;7:963–76.ArticlePubMed
- 29. Spranger S. Mechanisms of tumor escape in the context of the T-cell-inflamed and the non-T-cell-inflamed tumor microenvironment. Int Immunol 2016;28:383–91.ArticlePubMedPMCPDF
- 30. Togashi Y, Shitara K, Nishikawa H. Regulatory T cells in cancer immunosuppression: implications for anticancer therapy. Nat Rev Clin Oncol 2019;16:356–71.ArticlePubMedPDF
- 31. Liotti F, Prevete N, Vecchio G, Melillo RM. Recent advances in understanding immune phenotypes of thyroid carcinomas: prognostication and emerging therapies. F1000Res 2019 8:F1000 Faculty Rev. 227.Article
- 32. Condeelis J, Pollard JW. Macrophages: obligate partners for tumor cell migration, invasion, and metastasis. Cell 2006;124:263–6.ArticlePubMed
- 33. Ferrari SM, Fallahi P, Galdiero MR, Ruffilli I, Elia G, Ragusa F, et al. Immune and inflammatory cells in thyroid cancer microenvironment. Int J Mol Sci 2019;20:4413.ArticlePubMedPMC
- 34. Quaranta V, Schmid MC. Macrophage-mediated subversion of anti-tumour immunity. Cells 2019;8:747.ArticlePubMedPMC
- 35. Loke P, Allison JP. PD-L1 and PD-L2 are differentially regulated by Th1 and Th2 cells. Proc Natl Acad Sci U S A 2003;100:5336–41.ArticlePubMedPMC
- 36. Melillo RM, Guarino V, Avilla E, Galdiero MR, Liotti F, Prevete N, et al. Mast cells have a protumorigenic role in human thyroid cancer. Oncogene 2010;29:6203–15.ArticlePubMedPDF
- 37. Movahedi K, Laoui D, Gysemans C, Baeten M, Stange G, Van den Bossche J, et al. Different tumor microenvironments contain functionally distinct subsets of macrophages derived from Ly6C(high) monocytes. Cancer Res 2010;70:5728–39.ArticlePubMed
- 38. Gordon S, Martinez FO. Alternative activation of macrophages: mechanism and functions. Immunity 2010;32:593–604.ArticlePubMed
- 39. Zhang Y, Zhang Y, Gu W, Sun B. TH1/TH2 cell differentiation and molecular signals. Adv Exp Med Biol 2014;841:15–44.ArticlePubMed
References
Figure & Data
References
Citations
- Clinical significance and diagnostic value of QPCT, SCEL and TNFRSF12A in papillary thyroid cancer
Tairong Liang, Xiuqian Wu, Lan Wang, Zhengzhong Ni, Ying Fan, Peishan Wu, Hongzhi Wang, Yongdong Niu, Haihua Huang
Pathology - Research and Practice.2023; 245: 154431. CrossRef - Recommend with caution: A meta-analysis investigating papillary thyroid carcinoma tumor progression under active surveillance
Peter P. Issa, Ruhul Munshi, Aaron L. Albuck, Mahmoud Omar, Ruba F. Abu Alhuda, Tyler Metz, Mohammad Hussein, Mohamed Shama, Grace S. Lee, Eman Toraih, Emad Kandil
American Journal of Otolaryngology.2023; 44(6): 103994. CrossRef - Hashimoto's thyroiditis is negatively associated with lymph node metastasis in PTMC
Hui Huang, Siyuan Xu, Song Ni, Wensheng Liu, Shaoyan Liu
Journal of Cancer Research and Clinical Oncology.2023; 149(17): 15525. CrossRef - A nomogram based on the risk factors of cervical lymph node metastasis in papillary thyroid carcinoma coexistent with Hashimoto’s thyroiditis
Huanhuan Miao, Jingwen Zhong, Xuesha Xing, Jiawei Sun, Jiaqi Wu, Chengwei Wu, Yan Yuan, Xianli Zhou, Hongbo Wang
Clinical Hemorheology and Microcirculation.2023; 85(3): 235. CrossRef - The role of vascular endothelial growth factor in the development of papillary thyroid carcinoma in patients with lymphocytic thyroiditis
Nese E. GULCELIK, Safak AKIN, Kadriye AYDIN, Cisel AYDIN MERICOZ, Yesim G. GULER TEZEL, Aydan USMAN
Minerva Endocrinology.2023;[Epub] CrossRef - Identification of Transcriptional Pattern Related to Immune Cell Infiltration With Gene Co-Expression Network in Papillary Thyroid Cancer
Meiye Li, Jimei Zhang, Zongjing Zhang, Ying Qian, Wei Qu, Zhaoshun Jiang, Baochang Zhao
Frontiers in Endocrinology.2022;[Epub] CrossRef - A Potential Nine-lncRNAs Signature Identification and Nomogram Diagnostic Model Establishment for Papillary Thyroid Cancer
Jin-Ming Yao, Jun-Yu Zhao, Fang-Fang Lv, Xue-Bo Yang, Huan-Jun Wang
Pathology and Oncology Research.2022;[Epub] CrossRef - Hyperhomocysteinemia in the pathogenesis of cardiovascular and endocrine diseases: translational messages
Rostyslav KAMINSKY, Andrii YANCHYSHYN, Natalia BELEMETS, Olena KURYK, Inga SAMBORSKA, Iryna DZEVULSKA, Rinaldo PELLICANO
Minerva Biotechnology and Biomolecular Research.2022;[Epub] CrossRef - Immune Microenvironment of Muscular-Invasive Urothelial Carcinoma: The Link to Tumor Immune Cycle and Prognosis
Oleksandr Stakhovskyi, Nazarii Kobyliak, Oleg Voylenko, Eduard Stakhovskyi, Roman Ponomarchuk, Oksana Sulaieva
Cells.2022; 11(11): 1802. CrossRef - Comprehensive analysis of lncRNA-mediated ceRNA regulatory networks and key genes associated with papillary thyroid cancer coexistent with Hashimoto’s thyroiditis
Yuepeng Zhang, Yueli Tian
BMC Endocrine Disorders.2022;[Epub] CrossRef - Research Progress in the Correlation between AID, BRAFV600E and Papillary Thyroid Carcinoma
鑫 焦
Advances in Clinical Medicine.2022; 12(12): 11503. CrossRef - STAT6: A review of a signaling pathway implicated in various diseases with a special emphasis in its usefulness in pathology
Georgia Karpathiou, Alexandra Papoudou-Bai, Elise Ferrand, Jean Marc Dumollard, Michel Peoc’h
Pathology - Research and Practice.2021; 223: 153477. CrossRef - Prevalence of Hashimoto Thyroiditis in Adults With Papillary Thyroid Cancer and Its Association With Cancer Recurrence and Outcomes
Siyuan Xu, Hui Huang, Jiaxin Qian, Yang Liu, Ying Huang, Xiaolei Wang, Shaoyan Liu, Zhengang Xu, Jie Liu
JAMA Network Open.2021; 4(7): e2118526. CrossRef - LARINGOPHARINGEAL REFLUX IMPACTS IMMUNE MICROENVIRONMENT OF LARYNGEAL CARCINOMA
D.I. Zabolotnyi, V.V. Kizim, D.D. Zabolotna, Y.V. Kizim, O.N. Sulaieva
Fiziolohichnyĭ zhurnal.2020; 66(4): 12. CrossRef
 PubReader
 ePub Link
 Cite
Cite


