Articles
- Page Path
- HOME > Endocrinol Metab > Volume 35(2); 2020 > Article
-
Original ArticleEffects of a Portfolio-Mediterranean Diet and a Mediterranean Diet with or without a Sterol-Enriched Yogurt in Individuals with Hypercholesterolemia
-
Yvelise Ferro1*
 , Elisa Mazza2*, Mariantonietta Salvati2, Emma Santariga2, Salvatore Giampà2, Rocco Spagnuolo3, Patrizia Doldo3, Roberta Pujia1, Adriana Coppola4, Carmine Gazzaruso4, Arturo Pujia2, Tiziana Montalcini3
 -
Endocrinology and Metabolism 2020;35(2):298-307.
DOI: https://doi.org/10.3803/EnM.2020.35.2.298
Published online: June 30, 2020
1Department of Health Science, University Magna Grecia, Catanzaro, Italy
2Nutrition Unit, Department of Medical and Surgical Science, University Magna Grecia, Catanzaro, Italy
3Department of Clinical and Experimental Medicine, University Magna Grecia, Catanzaro, Italy
4Department of Internal and Emergency Medicine and Centre for Applied Clinical Research, Beato Matteo Institute, Vigevano, Italy
- Corresponding author: Tiziana Montalcini. Nutrition Unit, Department of Clinical and Experimental Medicine, University Magna Grecia, Viale Europa, 88100 Catanzaro, Italy, Tel: +39-961-3697314, Fax: +39-961-3694520, E-mail: tmontalcini@unicz.it
- * These authors contributed equally to this work.
Copyright © 2020 Korean Endocrine Society
This is an Open Access article distributed under the terms of the Creative Commons Attribution Non-Commercial License (https://creativecommons.org/licenses/by-nc/4.0/) which permits unrestricted non-commercial use, distribution, and reproduction in any medium, provided the original work is properly cited.
ABSTRACT
-
Background
- A growing number of functional foods have been proposed to reduce cholesterol levels and the Portfolio Diet, which includes a combination of plant sterols, fibres, nuts, and soy protein, reduces low density lipoprotein cholesterol (LDL-C) from 20% to 30% in individuals with hyperlipidaemia. In this pilot study, the aim was to investigate whether a Mediterranean Diet incorporating a new and simple combination of cholesterol-lowering foods, excluding soy and nuts (namely the Portfolio-Mediterranean Diet), would reduce LDL-C levels, in the short-term, better than a Mediterranean Diet plus a sterol-enriched yogurt or a Mediterranean Diet alone.
-
Methods
- We retrospectively evaluated 24 individuals on a Portfolio-Mediterranean Diet and 48 matched individuals on a Mediterranean Diet with or without a sterol-enriched yogurt (24 each groups) as controls.
-
Results
- At follow-up (after 48±12 days), we observed an LDL reduction of 21±4, 23±4, and 44±4 mg/dL in the Mediterranean Diet alone, Mediterranean Diet plus yogurt and Portfolio-Mediterranean Diet respectively (P<0.001).
-
Conclusion
- A Portfolio-Mediterranean Diet, incorporating a new combination of functional foods such as oats or barley, plant sterols, chitosan, and green tea but not soy and nuts, may reduce LDL of 25% in the short term in individuals with hypercholesterolemia.
- The Mediterranean Diet (MedDiet) is associated with a reduced low density lipoprotein cholesterol (LDL-C), even in the absence of weight loss [1,2]. However, dietary interventions generally have a limited long-term efficacy in reducing LDL-C and there is a decreasing adherence to this dietary pattern in Mediterranean countries in Europe [3,4].
- The National Cholesterol Education Program (NCEP) Adult Treatment Panel (ATP) III report [5] recommends incorporating plant stanols/sterols into a diet aimed at lowering LDL-C by 10% to 15%. This dietary strategy may reduce LDL-C in individuals with hypercholesterolemia with a low cardiovascular (CV) risk [6] and avoid lipid-lowering medications in high risk patients who cannot take them due to adverse effects [7–11].
- It is well accepted that lowering LDL-C using pharmacological and non-pharmacological therapies can reduce the rates of CV events [12]. Thus, although the evidence regarding their efficacy is conflicting [13–15], a growing number of functional foods and nutraceuticals have been proposed to reduce serum lipid levels.
- LDL-C can be reduced further through a combination of ingredients with cholesterol-lowering properties, such as plant sterols/stanols, viscous plant fibres from oats, barley, and nuts, soymilk, and soy meat analogues. This leads to an LDL-C reduction from 20% to 30% and a triglyceride reduction of 16% in individuals with hyperlipidemia compared with diet alone [16]. This dietary intervention, namely the Portfolio Diet (P-Diet) is now a recognised approach to lowering cholesterol [17]. However, one of the limitations of this dietary pattern is that it includes several core food groups which may be hard to consume on a continual basis.
- The aim of the current pilot study was to verify the feasibility of a simple dietary strategy (called the P-MedDiet) in reducing undesirable plasma LDL-C levels by a MedDiet containing a combination of foods with cholesterol-lowering properties but fewer core food groups than the classical P-Diet, in individuals with hypercholesterolemia. We compared its effect with other dietary interventions such as a MedDiet incorporating a sterol-enriched yogurt (SEY) and MedDiet alone.
INTRODUCTION
- Between January and December 2018 we retrospectively reviewed existing medical records of a population composed of adult patients aged over 20 years, attending the outpatient lipid clinic of the “Mater Domini” Azienda University Hospital in Catanzaro, Italy. All of the patients had hypercholesterolemia which was initially managed by a dietary intervention (such as the MedDiet with or without functional foods) or were intolerant to lipid-lowering medications or had refused them [18]. We restricted our analysis to new outpatients who had initiated a dietary treatment with or without functional foods in that period. We included only subjects who had continuously followed the treatment, and had a follow-up LDL-C measurement in the 4 to 8 weeks after the start of the dietary treatment, before a lipid-lowering drug was prescribed.
- In accordance with the definition of desirable serum cholesterol levels used by the ATPIII of the NCEP [19], we enrolled individuals with a fasting total cholesterol concentration equal or over 200 mg/dL which may or may not be associated with an elevated triglyceride concentration.
- We excluded individuals who took lipid-lowering medications (except in the case of intolerant individuals in whom the interruption duration was more than 3 months), those with secondary causes of hyperlipidemia—as cholestasis, hypothyroidism, pregnancy, sepsis, acute intermittent porphyria, oral contraceptive use, nephrotic syndrome, chronic renal failure, corticosteroid therapy, immunosuppression, past and current alcohol abuse (>20 g of alcohol per day; 350 mL (12 oz) of beer, 120 mL (4 oz) of wine, and 45 mL (1.5 oz) of hard liquor each contain 10 g of alcohol—who were affected by debilitating diseases and those consuming only one type of functional food (for example only soy or only oat or only green tea), as ascertained from their clinical records. We also excluded subjects who were following a different diet from the Mediterranean one (e.g., vegetarian, very low-calorie, intermittent fasting, low-carbohydrate, low-fat diet) and those with any energy restrictions.
- Dietary interventions
- A convenience sample of 24 consecutive individuals taking a MedDiet were included in this study. Key components of this diet were the follows: high intake of vegetables, fruits, legumes, nuts, whole-grain products, unsaturated fats (especially extra-virgin olive oil) and moderate intakes of red meat, poultry, dairy products, and red wine.
- A samples of 24 individuals on a MedDiet, taking a SEY daily, were also included. No other sterol-enriched products were found in our medical records. We defined this last dietary pattern as the MedDiet+SEY. In addition, a sample of 24 individuals on a MedDiet taking also a combination of foods with cholesterol-lowering properties were included. Key components of this diet were as follows: oats or barley (as breakfast cereals or drink, at least 3 g of beta-glucans per day), plant sterols (such as enriched yoghurt, 1.6 g per day), different types of legumes (at least three times a week), fish (blue fish or salmon, at least three times a week), chitosan (such as pasta, powder or tablets, at least 3 g a day), and green tea (2 to 3 cups a day). We defined this pattern as the P-MedDiet. The first two groups served as controls. Since nuts and soy (or soy products) were rarely reported in our medical reports, we identified a P-MedDiet excluding these food groups. All the groups were age-, body mass index (BMI)-, and LDL-C-matched.
- For this pilot, observational protocol, participants taking the SEY were those including in the study listed on the ISRCTN registry (study ID ISRCTN13244115; 100 g/day of a yogurt containing sterols 1.6 g/die, provided by Danone, SPA, Milano, Italy). Written informed consent is obtained from all patients attending our outpatient lipid clinic. The investigation conforms to the principles outlined in the Declaration of Helsinki. The privacy rights of human subjects was always observed. Since this pilot study was based on already-existing data and we did not use any identifying information, it was exempt from local ethics committee approval.
- Anthropometric measurements and cardiovascular risk factors assessment
- Body weight was measured at baseline and follow-up visit before breakfast after a 12-hour overnight fast with the subjects lightly dressed, subtracting the weight of clothes. Body weight was measured on a calibrated digital scale (model Tanita BC-418MA, Tanita Corp., Tokyo, Japan) accurate to 0.1 kg, and standing height was measured with a wall-mounted stadiometer [20]. BMI was calculated with the following equation: weight (kg)/height (m)2. Waist circumferences and hip circumferences were measured with a no stretchable tape over the unclothed abdomen at the narrowest point between costal margin and iliac crest and over light clothing at the level of the widest diameter around the buttocks, respectively, as described in the past [21].
- Dietary intake and cardiovascular risk factors assessment
- Dietary intake data were assessed by a 24-hour recall and a 7-day food record methods and calculated using nutritional software MetaDieta version 3.0.1 (Metedasrl, San Benedetto del Tronto, Italy) [21]. The 24-hour recall method was performed via a face-to-face interview. A well-trained dietitian used images associated with a comprehensive food list. The patients were also asked to report any ingredients, food and food waste in a food diary for a 7-day period. Then, the interviewer and participant examined the diary, exploring each functional food consumed. The portion size used were based on the typical portion consumed (e.g., a slice of bread, one egg) or commonly used (e.g., one cup). The nutrient database used to calculate nutrient intake was derived from Italian National Research Institute for Food and Nutrition (INRAN) 2000 and European Institute of Oncology (IEO) 2008. Furthermore, we assessed the presence of the classical CV risk factors, such as hypertension, diabetes and smoking, from clinical records [22].
- Dietary counselling
- In a clinical setting, all patients usually receive the same intensive dietary counselling (DC) by registered dietitians (RDs), consisting in one individual session per month, focusing on the MedDiet pattern [20,21]. Therefore, in this study, all the dietary treatments were prescribed in clinical practice and not for study purposes.
- Each patient underwent a 40- to 45-minute DC session at the first appointment (baseline) as well as at each follow-up. Macronutrient distribution, as a percentage of total energy, ranged as follows: 50% to 55% of calories from carbohydrate, 20% to 30% from fat and 15% to 20% from protein, with a recommended protein intake of 1 g/kg of ideal body weight. The RDs suggested that a variety of foods from the four food groups should be consumed (vegetables and fruits; grain products; milk and derivatives; meat/fish), as well as fewer refined foods, more legumes and fresh unprocessed foods and extra-virgin olive oil as the preferred dietary fat.
- In the case of patients with hypercholesterolemia RD messages supported health-centered behaviors, rather than weight-centered dieting and the concomitant use of the following functional foods was encouraged: oats or barley, plant sterols, legumes, fish, chitosan, and green tea. All patients received a printed copy of an individualized menu plan. The servings of various food categories consumed during the study is presented in Supplemental Table S1.
- Biochemical evaluation
- At baseline and each follow-up visit, venous blood was collected after fasting overnight into vacutainer tubes (Becton & Dickinson, Plymouth, England) and centrifuged within 4 hours. Serum glucose, total cholesterol, high density lipoprotein cholesterol, triglycerides, creatinine, and transaminases were measured by chemiluminescent immunoassay on COBAS 8000 (Roche, Basel, Switzerland), according to the manufacturer’s instructions. Thyroid stimulating hormone (TSH) was assessed by chemiluminescent immunoassay on ADVIA Centaur XPT (Siemens Healthcare Diagnostics Inc., New York, NY, USA). LDL-C level was calculated by the Friedewald formula [23,24]. Quality control was assessed daily for all determinations.
- Data analysis
- Data are reported as mean±standard deviation (SD). With a sample size of 72 subjects (24 each group), we can find an effect size of 20 mg/dL (mean difference of LDL-C levels between groups), with a standard deviation of 17 and a standardized effect size greater than 1, for a two tailed alpha equal to 0.05 and a power of 97%. A chi-square test was performed to analyse the prevalence between groups and analysis of variance (ANOVA) was used to compare the difference between means with a Scheffe post hoc. Changes in lipids and anthropometric parameters from baseline to follow-up (within group variation) were calculated using paired Student’s t test (two tailed).
- The General Linear Model (GLM) was used to adjust the LDL-C reduction for all confounders (which were all the variables correlating with LDL-C reduction in the Pearson’s correlation, i.e.: gender, age, weight change, follow-up duration, lipid disorders, and basal LDL-C). We used patients interview for assessing adherence to the treatments. We defined a participant as low adherent when the participant took less than 80% of the prescribed treatment. Significant differences were assumed to be present at P<0.05 (two-tailed). All comparisons were performed using SPSS version 22.0 for Windows (IBM Co., Armonk, NY, USA).
METHODS
- All of the 72 enrolled individuals had completed data. The mean age was 52±12 years. In this population, 14% were intolerant to lipid-lowering medications, 31% refused to take any type of lipid-lowering agents, and 55% had no indications for statins. The low-adherence rate was 8%, 4%, and 4% in MedDiet, MedDiet+SEY, and P-MedDiet, respectively.
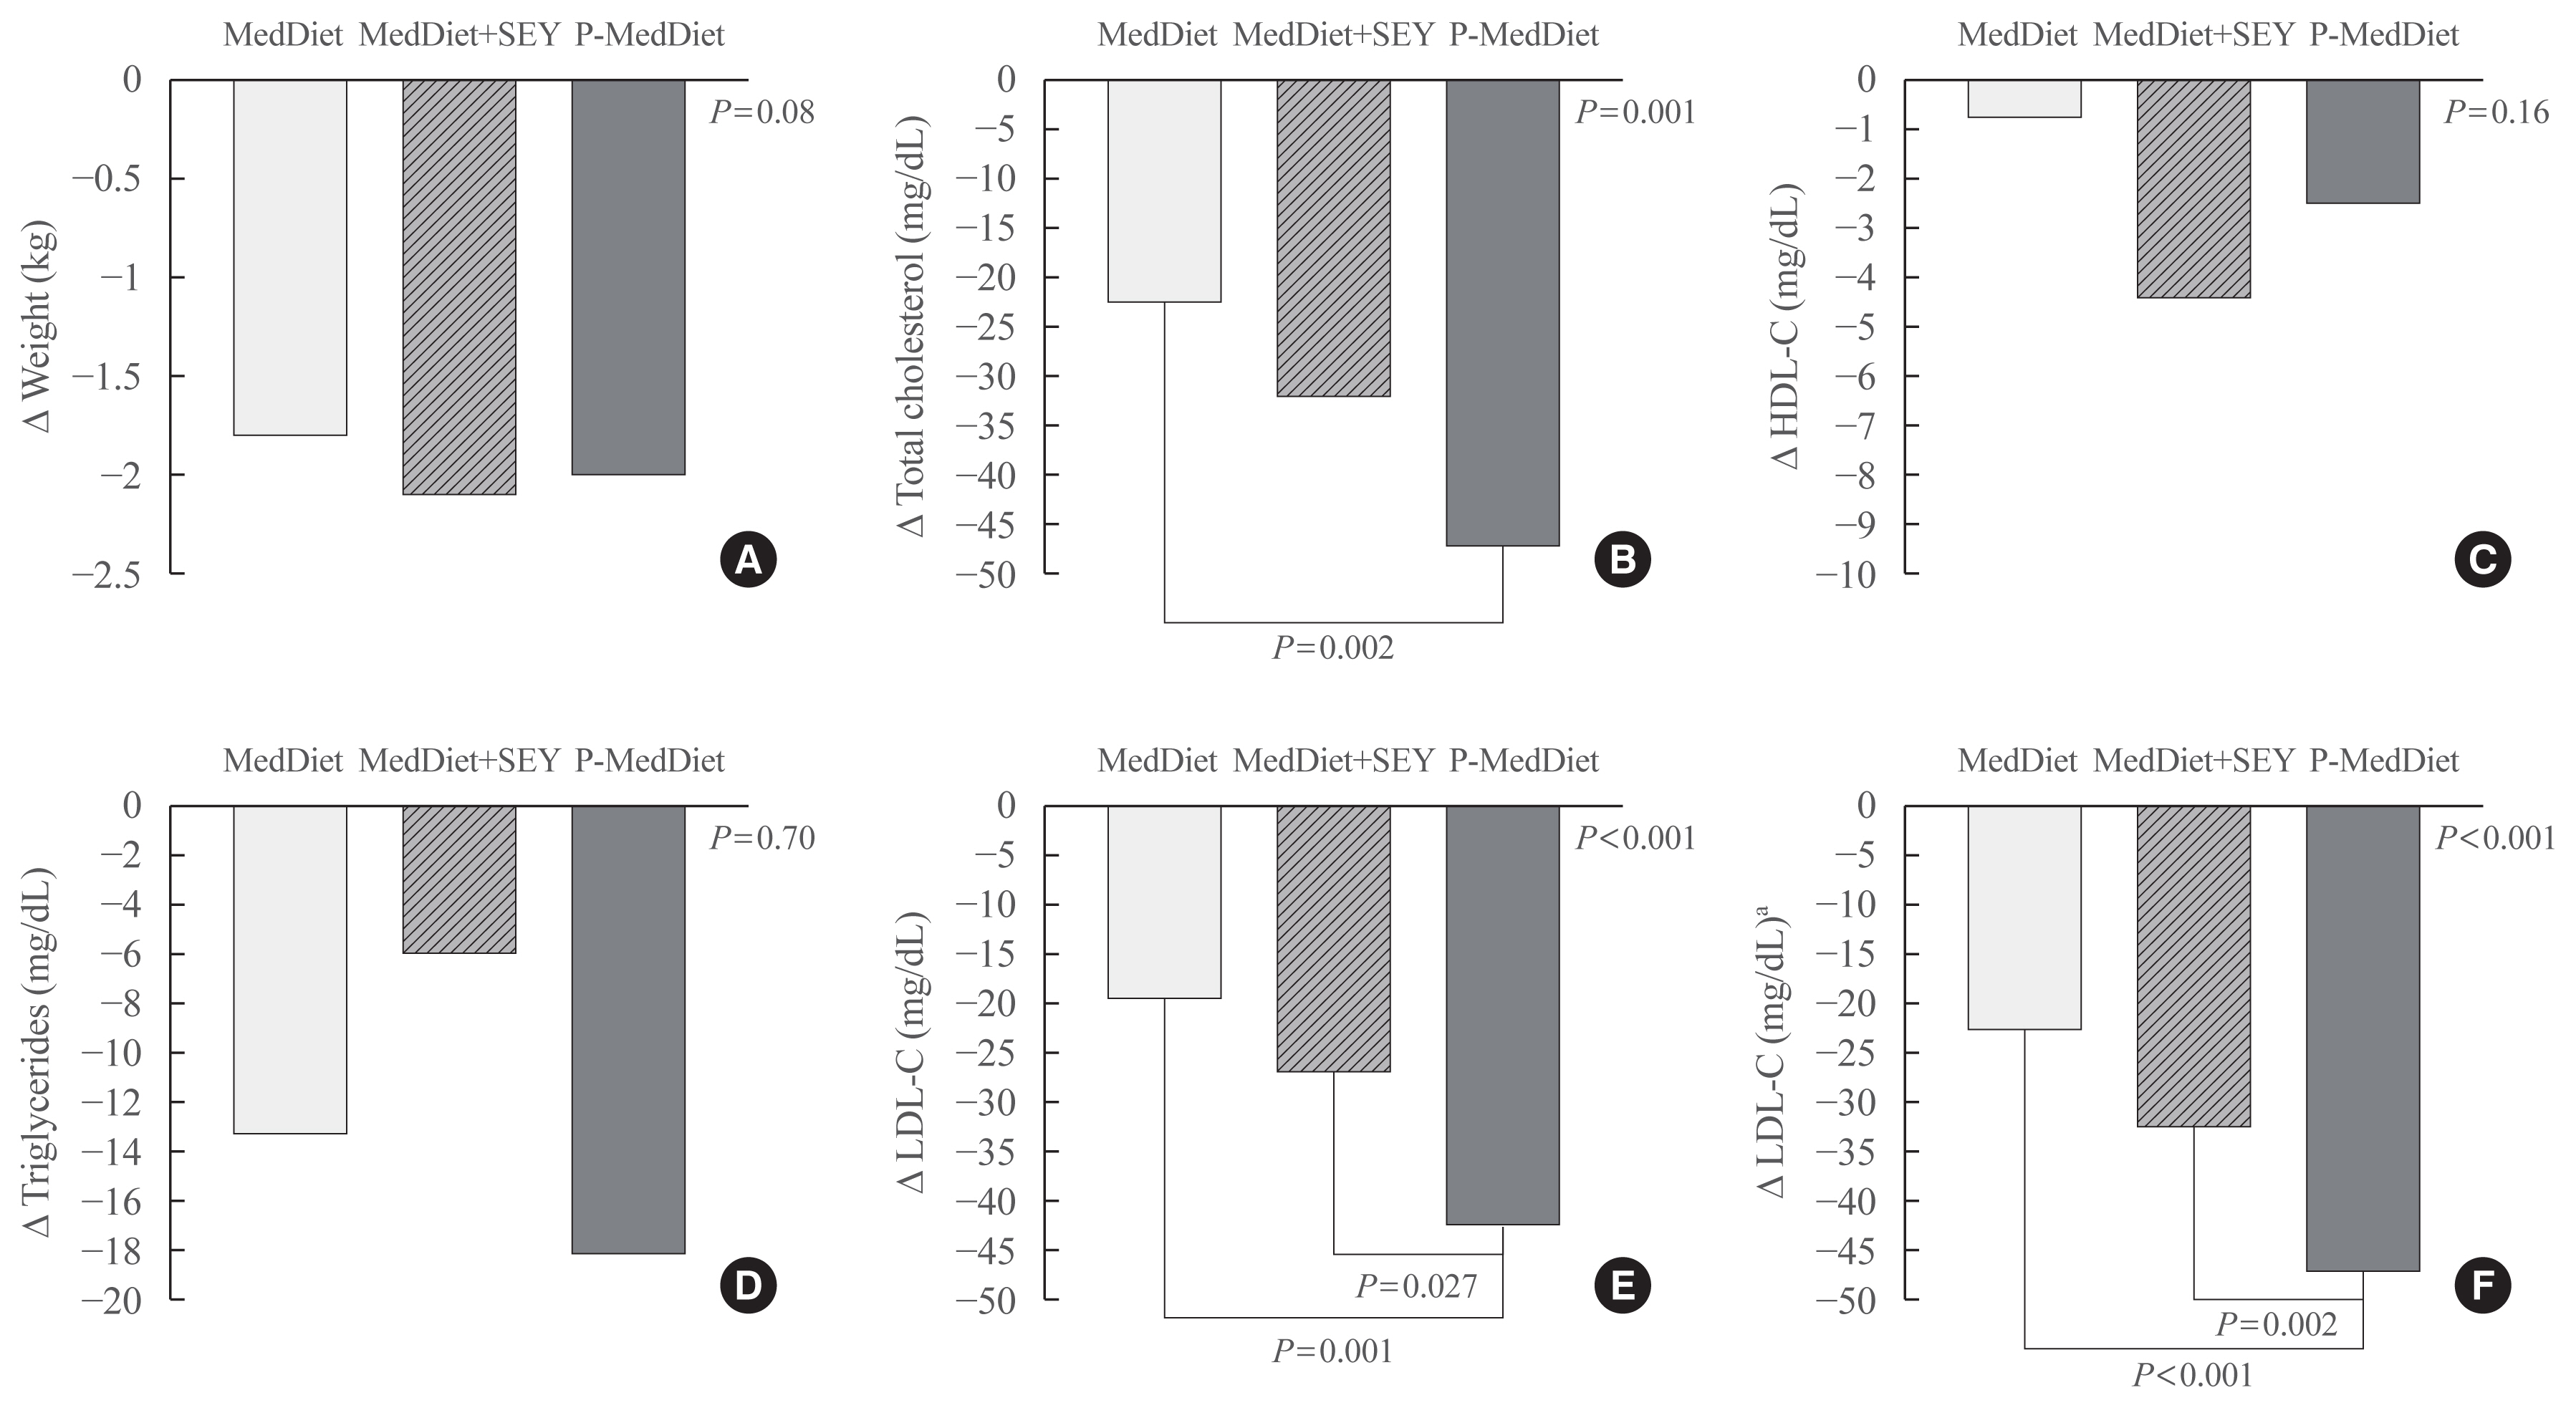
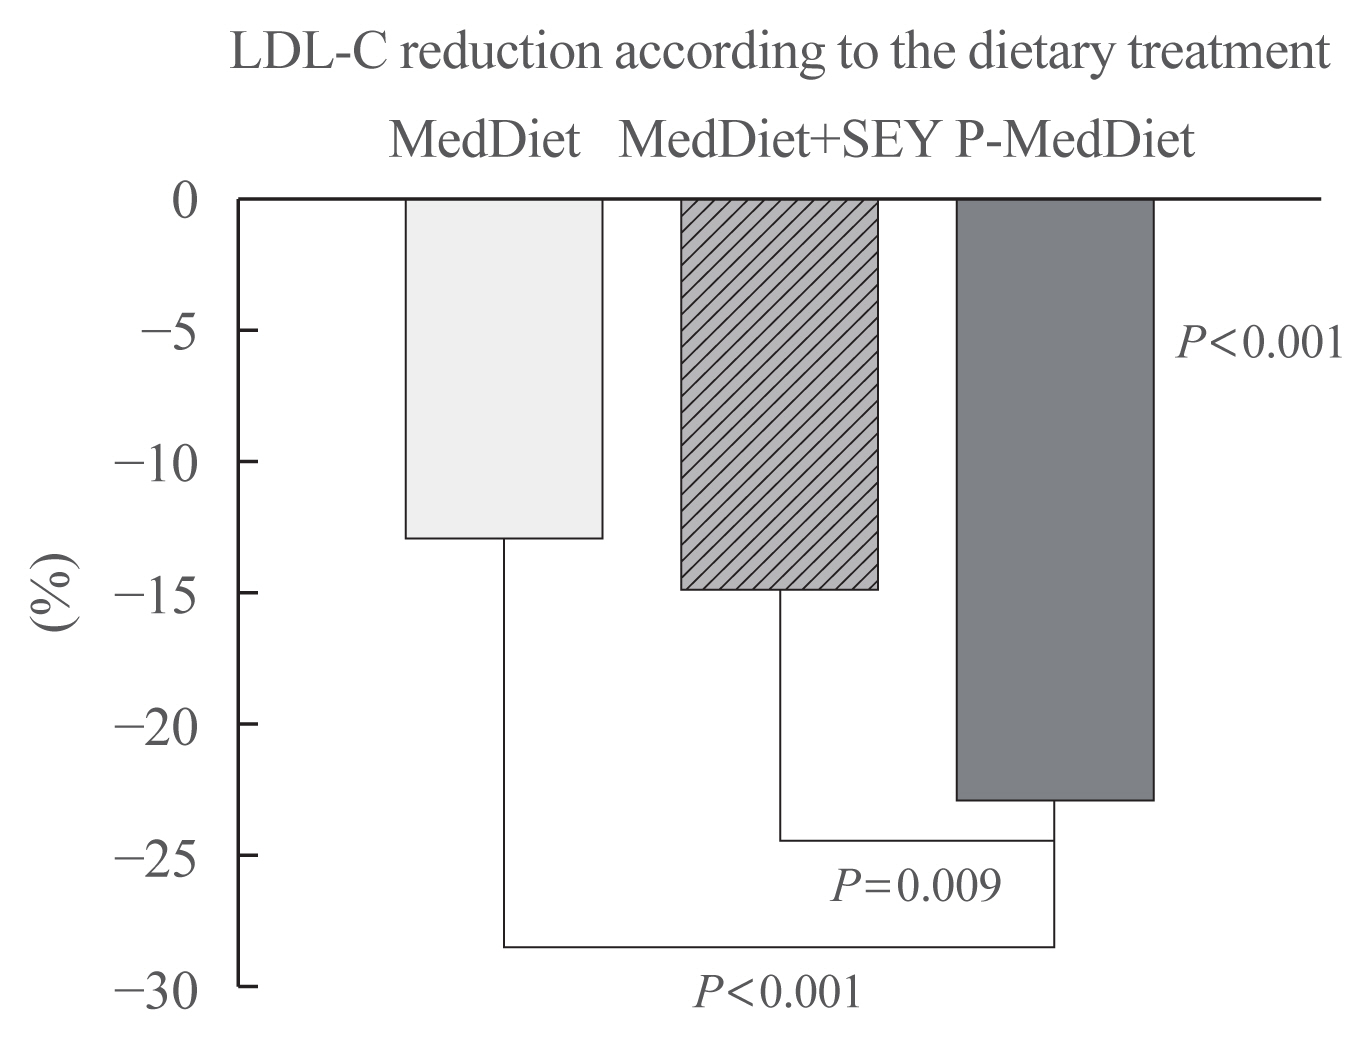
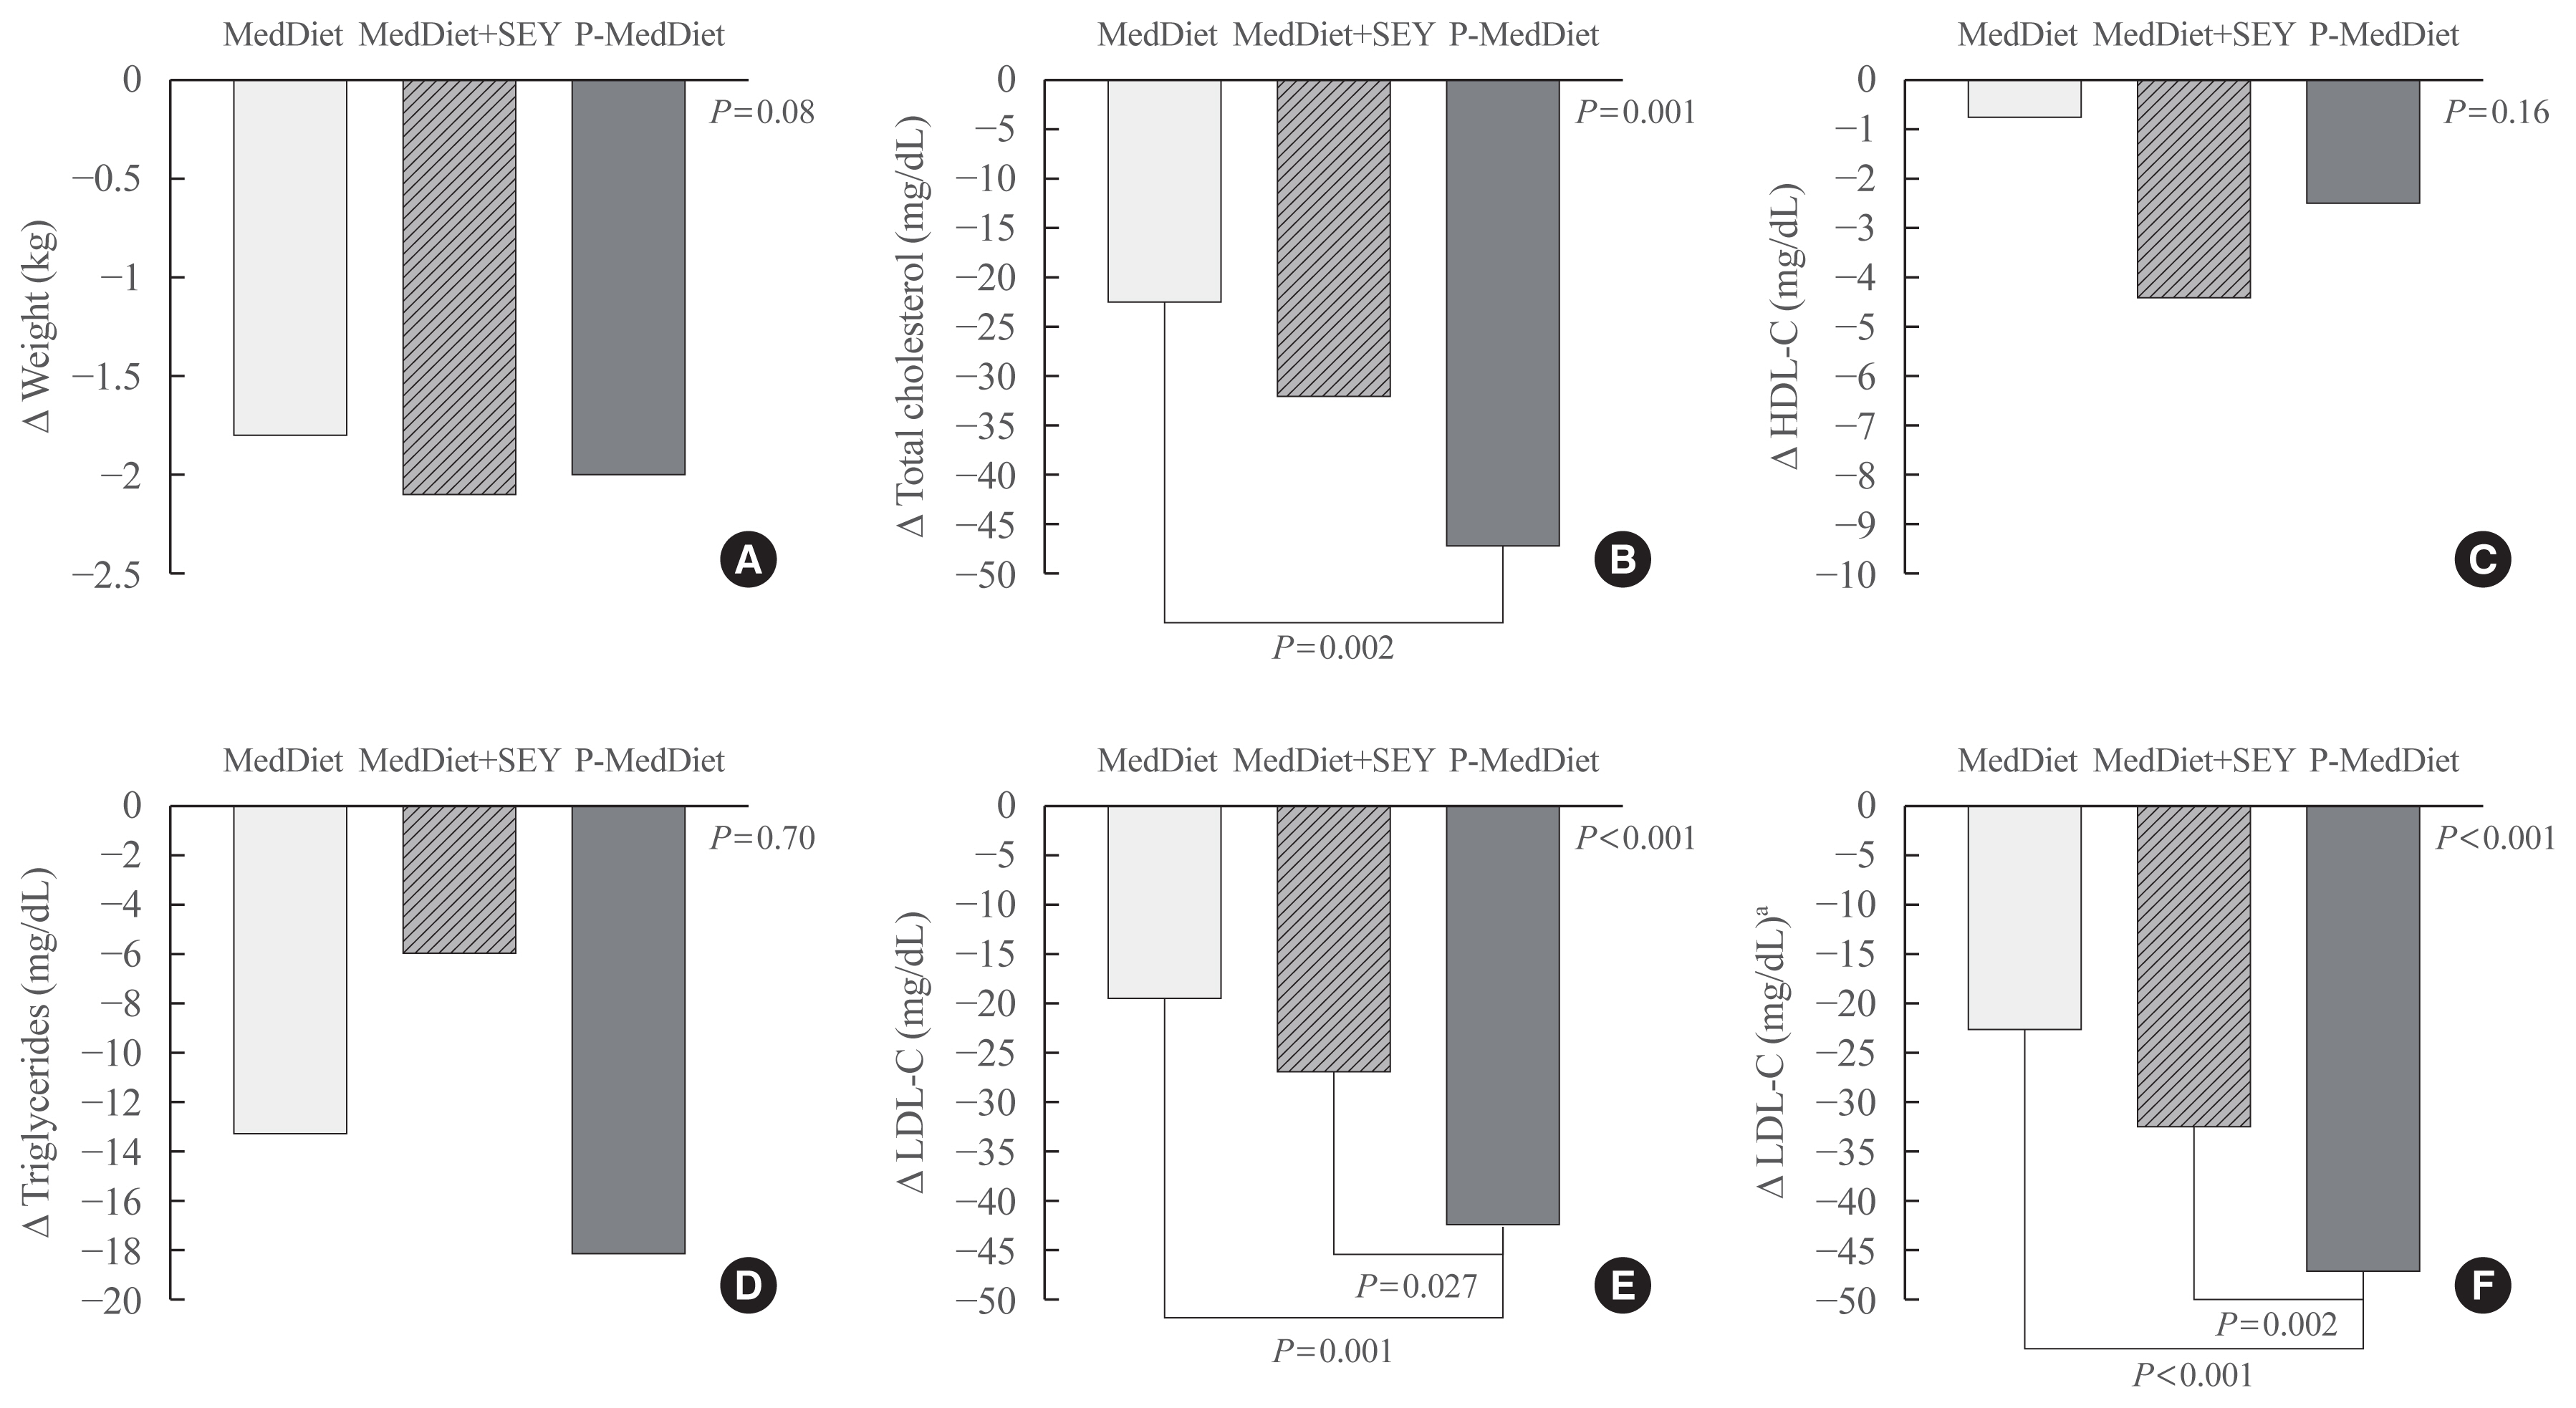
- Table 1 shows the clinical characteristics of participants according to the dietary treatment. At baseline, the groups were comparable for age, BMI, and basal LDL-C. A total of 56 individuals had hypercholesterolemia alone while 16 individuals had a diagnosis of mixed hyperlipidemia (Table 1). Table 2 shows the baseline and follow-up clinical characteristics of participants according to the treatment group. At baseline, the groups were comparable for all of the characteristics (see ANOVA test between dietary treatments). Creatinine and TSH were all in the normal range (not shown). LDL-C decreased at the second time point in the participants taking the P-MedDiet as well as in participants in the MedDiet group with or without a SEY (paired t test) (Table 2). However, the LDL-C reduction was significantly different between groups (see absolute change in Fig. 1). Since age, gender, weight change, follow-up duration, lipid disorders, and basal LDL-C were correlated with LDL-C reduction (univariate correlation; table not shown), we adjusted the LDL-C reduction for all these factors, which were −21±4, −23±4, and −44±4 mg/dL (Fig. 1; −13%, −14%, and −26% in the Fig. 2) in the MedDiet, MedDiet+SEY, and P-MedDiet, respectively, P<0.001 (MedDiet+SEY vs. P-MedDiet, P=0.027). No variables were significantly different between groups at the follow-up visit.
- In addition, there was a trend towards a lower triglyceride concentration with P-MedDiet than the control groups (−13, −6, −18 in the MedDiet, MedDiet+SEY, and P-MedDiet, respectively; P=0.70 [due to a large SD]). Supplemental Fig. S1 shows individual LDL-C changes for the participant in each groups. When we excluded participants with hypertriglyceridemia the LDL-C reduction was −22±17, −27±23, and −44±20 in the MedDiet alone, MedDiet+SEY and P-MedDiet, respectively (P<0.007). In the population with only mixed hyperlipidemia, plasma triglycerides improved only with P-MedDiet (−5, 0, −23 mg/dL in the MedDiet alone, MedDiet+SEY, and P-MedDiet, respectively) (data not shown in the tables).
- Dietary intake characteristics of participants at baseline and follow-up are showed in Table 3. At baseline, energy and nutrients intake were not significant different between groups. No nutrients significant differed at follow-up between groups except for saturated fats (absolute values 9, 9, and 6 g in the MedDiet, MedDiet+SEY, and P-MedDiet, respectively; P<0.001) (Table 3), polyunsaturated fats (6, 7, and 9 g in the MedDiet, MedDiet+SEY, and P-MedDiet, respectively; P<0.001), and plant sterols (not quantifiable vs. 1.6 and 1.4 g in the MedDiet, MedDiet+SEY, and P-MedDiet, respectively; P<0.001) and chitosan. Supplemental Fig. S2 shows the change in the nutrients intake for the participants in each group. There was a significant reduction in energy intake only in the MedDiet+SEY group (P=0.011, paired t test) (Supplemental Fig. S2A). Fats and monounsaturated fatty acid intake was reduced significantly in the MedDiet and P-MedDiet groups (paired t test) (Supplemental Fig. S2B, S2E). Polyunsaturated fats intake was lower in the MedDiet+SEY group (P=0.033) (Supplemental Fig. S2F) but significantly higher in the P-MedDiet (P=0.012) (Supplemental Fig. S2F) with a greater increase in the P-MedDiet group than in the controls (P=0.002 between group with ANOVA test). In all the dietary treatments the cholesterol and saturated fats intake decreased significantly during the study.
RESULTS
- The P-Diet, which includes a combination of ingredients with cholesterol-lowering properties (such as plant sterols/stanols, fibres from oats and barley, nuts and soy products), is a recognised alternative approach lowering cholesterol by 20% to 30% in individuals with hyperlipidemia [16]. In this study we assessed the feasibility of a new dietary approach to lowering cholesterol, combining a MedDiet with a P-Diet (resulting in a P-MedDiet). In Italy, where our study was conducted, the population already follows a Mediterranean style diet. Since the various core food groups of the P-Diet may be hard to consume on a consistent basis, we assessed the efficacy of a simplified P-MedDiet pattern, without nuts and soy and adding chitosan.
- This decision was also due to the fact that nuts and soy (or soy products) are rarely reported in our medical reports. In Italy, soy is not used to reduce LDL-C because the European food safety authority (EFSA) has not confirmed its cholesterol-lowering effect [12]. Due to the risk of allergies, we frequently observe that some patients refuse to consume nuts [25].
- We found that the LDL-C reduction was significantly different between groups (Fig. 1). However, in line with several previous studies [16,17], the LDL-C reduction was higher in the P-MedDiet group than in the control groups (−13%, −14%, and −25% in the MedDiet alone, MedDiet+SEY, and P-MedDiet, respectively) (Fig. 1). It has been demonstrated that a nutraceutical combination comprising red yeast rice, berberine, policosanol, astaxanthin, coenzyme Q10, and folic acid was effective in reducing LDL-C by 23 mg/dL and triglycerides by 13 mg/dL [26] while there was an LDL-C reduction of 44 mg/dL and a triglycerides reduction of 18 mg/dL with our P-MedDiet. To date, no studies exist on the effects of a similar diet, except for one carried out on patients with human immunodeficiency virus (HIV) dyslipidaemia [27].
- Our study was not designed to determine which of the foods were responsible for the effects observed, but to assess the combined impact of a MedDiet incorporating a combination of functional foods. However, we observed a significant change in the intake of nutrients during the study (Table 3, Supplemental Fig. S2). In particular, we found a greater intake of polyunsaturated fats in the P-MedDiet than in the control groups (Supplemental Fig. S2F). This finding is consistent with the concept that, in term of lowering LDL-C, a diet rich in monounsaturated fat is as effective as a diet rich in polyunsaturated fat [28].
- The cholesterol lowering effects induced by this diet may take place through, for example, reduced intestinal cholesterol absorption due to β-glucan, plant sterols, and chitosan [29,30], interference with transport-mediated processes of cholesterol uptake in liver by plant sterols [31], decreased hepatic cholesterol synthesis by green tea [32] and increased bile acid loss by the action of dietary fibre [33]. Furthermore, fish protein has been shown to decrease serum cholesterol by increasing fecal cholesterol and bile acid excretion [34].
- Another important finding of this study regards the plasma triglyceride level which improved only in the P-MedDiet group, as shown in a previous study on another type of P-Diet [17]. It is well known that there is a linear relationship between serum cholesterol levels and the risk of CV events [35]. The incremental decrease in LDL-C by non-pharmacological therapies can translate into reductions in CV event rates [12]; thus, our results are of important clinical significance.
- In this study, we tested several functional foods whose health claims relating to the cholesterol-lowering effect have already been approved by EFSA, including a SEY in the control group. We selected a SEY due to its wide commercialization and acceptability. Furthermore, the lipid-lowering effects of this SEY are well accepted and, most importantly, yogurt is consumed daily. The P-MedDiet includes key components of the MedDiet as well as the consumption of a SEY. Our P-MedDiet derives from the MedDiet as well as the P-Diet. We, thus, decided to compare our P-MedDiet with the other two dietary patterns to better understand the net effect of certain products (oats, barley, chitosan, green tea) with a lipid-lowering effect.
- In our study all groups lost weight to the same extent. This finding reinforces our hypothesis regarding the greater lipid-lowering effect obtained by combining functional foods in the MedDiet. While the results of this study cannot be generalized due to the type of sampling used, these results could still be useful in designing future intervention trials aimed at testing the efficacy of new combinations of functional foods. In addition, there have been several randomized, controlled trials combining the use of plant sterols and statin medications which show that in combination plant sterols have a significant additive effect [36]. Thus, we hypothesize that a P-MedDiet, used as an adjuvant to drug therapy, may be effective in reducing serum total and LDL-C.
- In this study, some weaknesses need to be addressed. Firstly, the nature of the study (pilot) and our sample make it difficult to generalize these results. Experimental designs or larger longitudinal studies would be necessary to confirm these findings. However, this type of study is helpful in detecting relationships among different phenomena, in order to generate hypothesis. Larger and more inclusive studies are needed on this important issue. Secondly, due to the study design, this investigation did not address P-MedDiet sustainability in the longer term. Despite these limitations, our study has strengths. Since the P-MedDiet differs from all other P-Diets tested to date, our study is original. For the first time, we demonstrated the feasibility of a new and simple dietary approach, namely the P-MedDiet, which involves consuming high amounts of legumes, fish, fruit, and vegetables, incorporating a new combination of functional foods with cholesterol-lowering properties, such as oats or barley, plant sterols, chitosan, and green tea, excluding soy and nuts, in reducing LDL-C by 25% in the short term in individuals with hypercholesterolemia.
DISCUSSION
Supplementary Information
-
CONFLICTS OF INTEREST
No potential conflict of interest relevant to this article was reported.
-
AUTHOR CONTRIBUTIONS
Conception or design: T.M. Acquisition, analysis, or interpretation of data: Y.F., E.M., E.S., R.P., A.C., A.P., T.M. Drafting the work or revising: R.S., P.D., C.G. Final approval of the manuscript: Y.F., E.M., M.S., E.S., S.G., R.S., P.D., R.P., A.C., C.G., A.P., T.M.
Article information

| Variable | MedDiet (n=24) | MedDiet+SEY (n=24) | P-MedDiet (n=24) | P valuea |
|---|---|---|---|---|
| Age, yr | 52±13 | 53±10 | 50±12 | 0.731 |
|
|
||||
| BMI, kg/m2 | 27.7±4 | 27.3±2 | 27.6±5 | 0.884 |
|
|
||||
| LDL-C, mg/dL | 163±29 | 160±17 | 176±37 | 0.121 |
|
|
||||
| Follow-up, day | 53±24 | 43±2 | 52±19 | 0.081 |
|
|
||||
| DC sessions | 1.7±1 | 2±0.5 | 1.7 ±0.5 | 0.242 |
|
|
||||
| Prevalenceb | ||||
| Female sex | 13 (52) | 14 (58) | 17 (71) | 0.243 |
| Menopause | 9 (56) | 11 (78) | 11 (51) | 0.801 |
| Smokers | 10 (42) | 13 (54) | 7 (29) | 0.389 |
| Hypercholesterolemia | 15 (63) | 24 (100) | 17 (71) | 0.491 |
| Mixed hyperlipidemia | 9 (38) | 0 | 7 (29) | 0.492 |
| Hypertension | 5 (21) | 6 (25) | 5 (21) | 1 |
| Diabetes | 0 | 0 | 2 (8) | 0.081 |
Values are expressed as mean±standard deviation or number (%).
MedDiet, Mediterranean Diet; SEY, sterol-enriched yogurt; P-MedDiet, Portfolio-Mediterranean Diet; BMI, body mass index; LDL-C, low density lipoprotein cholesterol; DC, dietary counselling.
a Difference between means by analysis of variance (ANOVA);
b Chi-square test.
| Variable | MedDiet | MedDiet+SEY | P-MedDiet | P valueb between groups (at basal) | Scheffé post hoc P value (at basal) | ||||||
|---|---|---|---|---|---|---|---|---|---|---|---|
|
|
|
|
|||||||||
| Basal (n=24) | Follow-up (n=24) | P valuea | Basal (n=24) | Follow-up (n=24) | P valuea | Basal (n=24) | Follow-up (n=24) | P valuea | |||
| Weight, kg | 73±15 | 71±14 | <0.001 | 74±10 | 72±10 | <0.001 | 70±12 | 68±11 | <0.001 | 0.442 | NS |
|
|
|||||||||||
| BMI, kg/m2 | 27.7±4 | 27.1±5 | <0.001 | 27.3±2 | 26.5±2 | <0.001 | 27.6±5 | 26.8 ±5 | <0.001 | 0.881 | NS |
|
|
|||||||||||
| WC, cm | 92±11 | 92±13 | 0.981 | 96±8 | 95±6 | 0.075 | 91±13 | 91±12 | 0.542 | 0.281 | NS |
|
|
|||||||||||
| HC, cm | 103±8 | 102±7 | 0.162 | 104±6 | 101±5 | <0.001 | 103±9 | 101±9 | <0.001 | 0.915 | NS |
|
|
|||||||||||
| Glucose, mg/dL | 90±7 | 94±10 | 0.050 | 92±10 | 92±20 | 0.951 | 91±9 | 95±12 | 0.143 | 0.881 | NS |
|
|
|||||||||||
| Total cholesterol, mg/dL | 244±33 | 221±40 | <0.001 | 242±19 | 210±27 | <0.001 | 259±47 | 212±46 | <0.001 | 0.182 | NS |
|
|
|||||||||||
| Triglycerides, mg/dL | 140±61 | 127±60 | 0.233 | 113±29 | 107±38 | 0.351 | 141±76 | 122±65 | 0.171 | 0.171 | NS |
|
|
|||||||||||
| HDL-C, mg/dL | 52±11 | 52±12 | 0.561 | 59±11 | 55±12 | <0.001 | 57±13 | 54±15 | 0.157 | 0.164 | NS |
|
|
|||||||||||
| LDL-C, mg/dL | 163±29 | 144±33 | <0.001 | 160±17 | 134±21 | <0.001 | 176±37 | 134±41 | <0.001 | 0.121 | NS |
|
|
|||||||||||
| AST, UI/L | 22±8 | 20±6 | 0.291 | 20±6 | 19±5 | 0.120 | 21±4 | 21±5 | 0.551 | 0.472 | NS |
|
|
|||||||||||
| ALT, UI/L | 27±17 | 22±11 | 0.031 | 23±12 | 18±6 | 0.018 | 20±8 | 20±8 | 0.783 | 0.776 | NS |
Values are expressed as mean±standard deviation.
MedDiet, Mediterranean Diet; SEY, sterol-enriched yogurt; P-MedDiet, Portfolio-Mediterranean Diet; NS, no significant; BMI, body mass index; WC, waist circumference; HC, hip circumference; HDL-C, high density lipoprotein cholesterol; LDL-C, low density lipoprotein cholesterol; AST, aspartate aminotransferase; ALT, alanine aminotransferase.
a Paired t test;
b Difference between means by analysis of variance (ANOVA).
| Variable | Baseline | Follow-up | ||||||||
|---|---|---|---|---|---|---|---|---|---|---|
|
|
|
|||||||||
| MedDiet (n=24) | MedDiet +SEY (n=24) | P-MedDiet (n=24) | P valuea | Scheffé post hoc P value | MedDiet (n=24) | MedDiet +SEY (n=24) | P-MedDiet (n=24) | P valuea | Scheffé post hoc P value | |
| Calories intake, kcal | 1,664±360 | 1,710±193 | 1,680±304 | 0.941 | NS | 1,528±161 | 1,571±152 | 1,558±80 | 0.814 | NS |
|
|
||||||||||
| Carbohydrates, g | 196±66 | 235±30 | 213±57 | 0.303 | NS | 236±18 | 225±29 | 236±20 | 0.596 | NS |
|
|
||||||||||
| Proteins, g | 66±17 | 72±10 | 70±27 | 0.751 | NS | 76±5 | 75±6 | 79±5 | 0.321 | NS |
|
|
||||||||||
| Fats, g | 64±4 | 57±19 | 66±11 | 0.442 | NS | 41±4 | 45±5 | 43±4 | 0.331 | NS |
|
|
||||||||||
| Cholesterol, g | 160±26 | 154±31 | 154±31 | 0.642 | NS | 92±4 | 91±5 | 90±4 | 0.703 | NS |
|
|
||||||||||
| Saturated fats, g | 15±2 | 19±13 | 20±7 | 0.604 | NS | 9±0.7 | 9±0.8 | 6±0.7 | <0.001 |
1 vs. 3 <0.001 2 vs. 3 <0.001 |
|
|
||||||||||
| Monounsaturated fatty acids, g | 34±4 | 28±10 | 33±8 | 0.281 | NS | 24±3 | 22±3 | 21±3 | 0.122 | NS |
|
|
||||||||||
| Polyunsaturated fats, g | 7±1 | 8±2 | 7±1 | 0.302 | NS | 6±0.7 | 7±0.7 | 9±0.4 | <0.001 |
1 vs. 3 <0.001 2 vs. 3 <0.001 |
|
|
||||||||||
| Plant sterols (added), g | - | - | - | NS | NS | - | 1.6±0.01 | 1.44±0.2 | NS | 2 vs. 3 <0.001 |
|
|
||||||||||
| Chitosan, g | - | - | - | NS | NS | - | - | 2.56±1 | NS | NS |
|
|
||||||||||
| Green tea, mL | - | - | - | NS | NS | - | - | 517±155 | NS | NS |
- 1. Richard C, Couture P, Desroches S, Charest A, Lamarche B. Effect of the Mediterranean diet with and without weight loss on cardiovascular risk factors in men with the metabolic syndrome. Nutr Metab Cardiovasc Dis 2011;21:628–35.ArticlePubMed
- 2. Escurriol V, Cofan M, Serra M, Bullo M, Basora J, Salas-Salvado J, et al. Serum sterol responses to increasing plant sterol intake from natural foods in the Mediterranean diet. Eur J Nutr 2009;48:373–82.ArticlePubMedPDF
- 3. Sofi F, Innocenti G, Dini C, Masi L, Battistini NC, Brandi ML, et al. Low adherence of a clinically healthy Italian population to nutritional recommendations for primary prevention of chronic diseases. Nutr Metab Cardiovasc Dis 2006;16:436–44.ArticlePubMed
- 4. Rodrigues SS, Caraher M, Trichopoulou A, de Almeida MD. Portuguese households’ diet quality (adherence to Mediterranean food pattern and compliance with WHO population dietary goals): trends, regional disparities and socioeconomic determinants. Eur J Clin Nutr 2008;62:1263–72.ArticlePubMedPDF
- 5. Expert Panel on Detection, Evaluation, and Treatment of High Blood Cholesterol in Adults. Executive summary of the third report of the National Cholesterol Education Program (NCEP) expert panel on detection, evaluation, and treatment of high blood cholesterol in adults (Adult Treatment Panel III). JAMA 2001;285:2486–97.ArticlePubMed
- 6. Pirro M, Vetrani C, Bianchi C, Mannarino MR, Bernini F, Rivellese AA. Joint position statement on “Nutraceuticals for the treatment of hypercholesterolemia” of the Italian Society of Diabetology (SID) and of the Italian Society for the Study of Arteriosclerosis (SISA). Nutr Metab Cardiovasc Dis 2017;27:2–17.ArticlePubMed
- 7. Phillips E, Saseen JJ. Current controversies with recent cholesterol treatment guidelines. J Pharm Pract 2016;29:15–25.ArticlePubMed
- 8. Bruckert E, Hayem G, Dejager S, Yau C, Begaud B. Mild to moderate muscular symptoms with high-dosage statin therapy in hyperlipidemic patients: the PRIMO study. Cardiovasc Drugs Ther 2005;19:403–14.ArticlePubMedPDF
- 9. Phillips PS. Ezetimibe and statin-associated myopathy. Ann Intern Med 2004;141:649.Article
- 10. Miller ML, Wright CC, Browne B. Lipid-lowering medications for children and adolescents. J Clin Lipidol 2015;9:S67–76.ArticlePubMed
- 11. Arca M, Pigna G. Treating statin-intolerant patients. Diabetes Metab Syndr Obes 2011;4:155–66.ArticlePubMedPMC
- 12. Silverman MG, Ference BA, Im K, Wiviott SD, Giugliano RP, Grundy SM, et al. Association between lowering LDL-C and cardiovascular risk reduction among different therapeutic interventions: a systematic review and meta-analysis. JAMA 2016;316:1289–97.ArticlePubMed
- 13. Anderson JW, Johnstone BM, Cook-Newell ME. Meta-analysis of the effects of soy protein intake on serum lipids. N Engl J Med 1995;333:276–82.ArticlePubMed
- 14. EFSA Panel on Dietetic Products, Nutrition and Allergies (NDA). Scientific opinion on the substantiation of a health claim related to isolated soy protein and reduction of blood LDL-cholesterol concentrations pursuant to Article 14 of Regulation (EC) No 1924/2006. EFSA J 2012;10:2555.Article
- 15. Dulin MF, Hatcher LF, Sasser HC, Barringer TA. Policosanol is ineffective in the treatment of hypercholesterolemia: a randomized controlled trial. Am J Clin Nutr 2006;84:1543–8.ArticlePubMedPDF
- 16. Chiavaroli L, Nishi SK, Khan TA, Braunstein CR, Glenn AJ, Mejia SB, et al. Portfolio dietary pattern and cardiovascular disease: a systematic review and meta-analysis of controlled trials. Prog Cardiovasc Dis 2018;61:43–53.ArticlePubMed
- 17. Kendall CW, Jenkins DJ. A dietary portfolio: maximal reduction of low-density lipoprotein cholesterol with diet. Curr Atheroscler Rep 2004;6:492–8.ArticlePubMedPDF
- 18. Catapano AL, Reiner Z, De Backer G, Graham I, Taskinen MR, Wiklund O, et al. ESC/EAS guidelines for the management of dyslipidaemias the task force for the management of dyslipidaemias of the European Society of Cardiology (ESC) and the European Atherosclerosis Society (EAS). Atherosclerosis 2011;217:3–46.ArticlePubMed
- 19. National Cholesterol Education Program (NCEP) Expert Panel on Detection, Evaluation, and Treatment of High Blood Cholesterol in Adults (Adult Treatment Panel III). Third report of the National Cholesterol Education Program (NCEP) expert panel on detection, evaluation, and treatment of high blood cholesterol in adults (Adult Treatment Panel III) final report. Circulation 2002;106:3143–421.ArticlePubMed
- 20. Mazza E, Fava A, Ferro Y, Rotundo S, Romeo S, Bosco D, et al. Effect of the replacement of dietary vegetable oils with a low dose of extravirgin olive oil in the Mediterranean Diet on cognitive functions in the elderly. J Transl Med 2018;16:10.ArticlePubMedPMCPDF
- 21. Montalcini T, De Bonis D, Ferro Y, Care I, Mazza E, Accattato F, et al. High vegetable fats intake is associated with high resting energy expenditure in vegetarians. Nutrients 2015;7:5933–47.ArticlePubMedPMC
- 22. Psaty BM, Furberg CD, Kuller LH, Bild DE, Rautaharju PM, Polak JF, et al. Traditional risk factors and subclinical disease measures as predictors of first myocardial infarction in older adults: the Cardiovascular Health Study. Arch Intern Med 1999;159:1339–47.ArticlePubMed
- 23. Roberts WC. The Friedewald-Levy-Fredrickson formula for calculating low-density lipoprotein cholesterol, the basis for lipid-lowering therapy. Am J Cardiol 1988;62:345–6.ArticlePubMed
- 24. Montalcini T, Gorgone G, Federico D, Ceravolo R, Emanuele V, Sesti G, et al. Association of LDL cholesterol with carotid atherosclerosis in menopausal women affected by the metabolic syndrome. Nutr Metab Cardiovasc Dis 2005;15:368–72.ArticlePubMed
- 25. Tang ML, Mullins RJ. Food allergy: is prevalence increasing? Intern Med J 2017;47:256–61.ArticlePubMed
- 26. Pirro M, Mannarino MR, Bianconi V, Simental-Mendia LE, Bagaglia F, Mannarino E, et al. The effects of a nutraceutical combination on plasma lipids and glucose: a systematic review and meta-analysis of randomized controlled trials. Pharmacol Res 2016;110:76–88.ArticlePubMed
- 27. Stradling C, Thomas GN, Hemming K, Frost G, Garcia-Perez I, Redwood S, et al. Randomised controlled pilot study to assess the feasibility of a Mediterranean Portfolio dietary intervention for cardiovascular risk reduction in HIV dyslipidaemia: a study protocol. BMJ Open 2016;6:e010821.ArticlePubMedPMC
- 28. Mensink RP, Katan MB. Effect of a diet enriched with monounsaturated or polyunsaturated fatty acids on levels of low-density and high-density lipoprotein cholesterol in healthy women and men. N Engl J Med 1989;321:436–41.ArticlePubMed
- 29. Calpe-Berdiel L, Escola-Gil JC, Blanco-Vaca F. New insights into the molecular actions of plant sterols and stanols in cholesterol metabolism. Atherosclerosis 2009;203:18–31.ArticlePubMed
- 30. Zhang J, Liu J, Li L, Xia W. Dietary chitosan improves hypercholesterolemia in rats fed high-fat diets. Nutr Res 2008;28:383–90.ArticlePubMed
- 31. Chen JT, Wesley R, Shamburek RD, Pucino F, Csako G. Meta-analysis of natural therapies for hyperlipidemia: plant sterols and stanols versus policosanol. Pharmacotherapy 2005;25:171–83.ArticlePubMed
- 32. Singh DK, Banerjee S, Porter TD. Green and black tea extracts inhibit HMG-CoA reductase and activate AMP kinase to decrease cholesterol synthesis in hepatoma cells. J Nutr Biochem 2009;20:816–22.ArticlePubMed
- 33. Jenkins DJ, Wolever TM, Rao AV, Hegele RA, Mitchell SJ, Ransom TP, et al. Effect on blood lipids of very high intakes of fiber in diets low in saturated fat and cholesterol. N Engl J Med 1993;329:21–6.ArticlePubMed
- 34. Hosomi R, Fukunaga K, Arai H, Kanda S, Nishiyama T, Yoshida M. Fish protein decreases serum cholesterol in rats by inhibition of cholesterol and bile acid absorption. J Food Sci 2011;76:H116–21.ArticlePubMed
- 35. Stamler J, Wentworth D, Neaton JD. Is relationship between serum cholesterol and risk of premature death from coronary heart disease continuous and graded? Findings in 356,222 primary screenees of the Multiple Risk Factor Intervention Trial (MRFIT). JAMA 1986;256:2823–8.ArticlePubMed
- 36. Miettinen TA, Strandberg TE, Gylling H. Noncholesterol sterols and cholesterol lowering by long-term simvastatin treatment in coronary patients: relation to basal serum cholestanol. Arterioscler Thromb Vasc Biol 2000;20:1340–6.ArticlePubMed
References
Figure & Data
References
Citations
- Intrinsic and environmental basis of aging: A narrative review
Carla Navarro, Juan Salazar, María P. Díaz, Maricarmen Chacin, Raquel Santeliz, Ivana Vera, Luis D′Marco, Heliana Parra, Mary Carlota Bernal, Ana Castro, Daniel Escalona, Henry García-Pacheco, Valmore Bermúdez
Heliyon.2023; 9(8): e18239. CrossRef - Application of small angle X‐ray scattering in exploring the effect of edible oils with different unsaturation FAs on bioaccessibility of stigmasterol oleate
Ying Wang, Tao Wang, Zhangtie Wang, Yiwen Guo, Ruijie Liu, Ming Chang
Journal of the Science of Food and Agriculture.2023; 103(15): 7764. CrossRef - Phyto-Enrichment of Yogurt to Control Hypercholesterolemia: A Functional Approach
Harsh Kumar, Kanchan Bhardwaj, Natália Cruz-Martins, Ruchi Sharma, Shahida Anusha Siddiqui, Daljeet Singh Dhanjal, Reena Singh, Chirag Chopra, Adriana Dantas, Rachna Verma, Noura S. Dosoky, Dinesh Kumar
Molecules.2022; 27(11): 3479. CrossRef - Familial Hypercholesterolemia and Its Current Diagnostics and Treatment Possibilities: A Literature Analysis
Kristina Zubielienė, Gintarė Valterytė, Neda Jonaitienė, Diana Žaliaduonytė, Vytautas Zabiela
Medicina.2022; 58(11): 1665. CrossRef - Mediterranean Diet a Potential Strategy against SARS-CoV-2 Infection: A Narrative Review
Yvelise Ferro, Roberta Pujia, Samantha Maurotti, Giada Boragina, Angela Mirarchi, Patrizia Gnagnarella, Elisa Mazza
Medicina.2021; 57(12): 1389. CrossRef
 PubReader
 ePub Link
 Cite
Cite