Articles
- Page Path
- HOME > Endocrinol Metab > Volume 35(1); 2020 > Article
-
Review ArticleUnmet Clinical Needs in the Treatment of Patients with Thyroid Cancer
-
Won Bae Kim
 , Min Ji Jeon, Won Gu Kim, Tae Yong Kim, Young Kee Shong
 -
Endocrinology and Metabolism 2020;35(1):14-25.
DOI: https://doi.org/10.3803/EnM.2020.35.1.14
Published online: March 19, 2020
Department of Internal Medicine, Asan Medical Center, University of Ulsan College of Medicine, Seoul, Korea.
- Corresponding author: Won Bae Kim. Department of Internal Medicine, Asan Medical Center, University of Ulsan College of Medicine, 88 Olympic-ro 43-gil, Songpa-gu, Seoul 05505, Korea. Tel: +82-2-3010-3913, Fax: +82-2-3010-6962, kimwb@amc.seoul.kr
• Received: January 29, 2020 • Revised: February 17, 2020 • Accepted: February 24, 2020
Copyright © 2020 Korean Endocrine Society
This is an Open Access article distributed under the terms of the Creative Commons Attribution Non-Commercial License (http://creativecommons.org/licenses/by-nc/4.0/) which permits unrestricted non-commercial use, distribution, and reproduction in any medium, provided the original work is properly cited.
- ABSTRACT
- INTRODUCTION
- EPIDEMIOLOGY OF THYROID CANCER
- EPIDEMIOLOGY OF THYROID CANCER IN KOREA
- KNOWN PROGNOSTIC MARKERS OF THYROID CANCER
- SEARCHING FOR NOVEL PROGNOSTIC MARKERS OF THYROID CANCER
- NOVEL THERAPEUTIC TARGETS IN THYROID CANCER
- UNDERSTANDING OF TUMOR-HOST INTERACTIONS TO IMPROVE THE TREATMENT OF THYROID CANCER
- CONCLUSIONS
- Article information
- References
ABSTRACT
- The increased incidence of thyroid cancer is a worldwide phenomenon; however, the issue of overdiagnosis has been most prominent in South Korea. The age-standardized mortality rate of thyroid cancer in Korea steeply increased from 1985 to 2004 (from 0.17 per 100,000 to 0.85 per 100,000), and then decreased until 2015 to 0.42 per 100,000, suggesting that early detection reduced mortality. However, early detection of thyroid cancer may be cost-ineffective, considering its very high prevalence and indolent course. Therefore, risk stratification and tailored management are vitally important, but many prognostic markers can only be evaluated postoperatively. Discovery of preoperative marker(s), especially for small cancers, is the most important unmet clinical need for thyroid cancer. Herein, we discuss some such factors that we recently discovered. Another unmet clinical need is better treatment of radioiodine-refractory (RAIR) differentiated thyroid cancer (DTC) and undifferentiated cancers. Although sorafenib and lenvatinib are available, better drugs are needed. We found that phosphoglycerate dehydrogenase, a critical enzyme for serine biosynthesis, could be a novel therapeutic target, and that the lymphocyte-to-monocyte ratio is a prognostic marker of survival in patients with anaplastic thyroid carcinoma or RAIR DTC. Deeper insights are needed into tumor-host interactions in thyroid cancer to improve treatment.
- Thyroid nodules are very common, and their clinical importance lies in the fact that approximately 5% of thyroid nodules are malignant [1]. Using high-resolution ultrasonography (US), thyroid nodules were detected in 19% to 68% of randomly selected adults, with a higher prevalence in women and aged persons [2].
- Due to the increasing use of neck US and other imaging modalities, the incidence of thyroid cancer has been increasing in most countries during recent decades, and much of this increase has been due to clinically occult disease [34]. The sharply increased detection rate of thyroid cancer may impose major medical costs on patients diagnosed with cancer, increasing their risk of bankruptcy [5]. In 1996, the American Thyroid Association (ATA) published treatment guidelines for patients with thyroid nodules and differentiated thyroid carcinoma (DTC) [6]. These guidelines were highly helpful for the clinical care of patients with thyroid nodules and cancers, but clinical controversies emerged regarding several issues, mainly due to the insufficient amount of high-quality clinical trials in the field of thyroid cancer.
- In the revised ATA guideline published in 2015 [7], a major goal was to minimize potential harm from over-treatment in the majority of patients at low risk for disease-specific mortality and morbidity, while appropriately treating and monitoring those patients at higher risk. The revised guideline is characterized by (1) a more conservative approach toward small thyroid nodules; (2) a proposal for less than total thyroidectomy for most intrathyroidal thyroid cancers; (3) a proposal that patients with fewer than five affected lymph nodes, or incidental metastasis <2 mm in diameter, might be considered to be at a low risk of recurrence; (4) the suggestion of more restricted indications for radioiodine (RAI) therapy; and (5) for radioiodine-refractory (RAIR) DTC, the recommendation of a more rapid transition to other options, such as tyrosine kinase inhibitors. These recommendations are characterized by a more individualized approach to patients with DTC, which is expected to improve their quality of life, reduce their disease-related anxiety, and diminish health-related costs.
- Patients with differentiated thyroid cancer (DTC) refractory to RAI have a poorer prognosis than those with RAI-avid disease. Recently, lenvatinib and sorafenib have been approved for the treatment of rapidly progressive RAIR DTC [89]. These new medications led to major changes in clinical practice, but they are not curative, meaning that the risks and benefits of treatment must be carefully assessed before starting therapy. There are many promising novel strategies for the treatment of thyroid cancer, such as immunotherapy and targeting B type Raf kinase (BRAF), tropomycin receptor kinase (TRK), or rearranged in transformation (RET).
- Nonetheless, there continue to be many unmet clinical needs in the management of patients with thyroid cancer; in this review, we discuss these needs and our suggestions based on our recent research on thyroid cancer.
INTRODUCTION
- Thyroid cancer is the most common endocrine malignancy, and it more frequently affects women than men. The rise in the incidence of thyroid cancer—mostly of papillary thyroid carcinoma (PTC)—over the last decades is a worldwide phenomenon that has ignited a debate on the overdiagnosis of thyroid cancer based on the absence of a significant change in thyroid cancer mortality during the same period [10]. The introduction and widespread use of thyroid US and fine needle aspiration of thyroid nodules, the increasingly frequent use of many medical imaging modalities such as computed tomography, magnetic resonance imaging, and positron emission tomography scans in medical practice, and the overall increase in thyroid surgery for various reasons are all potential causes of the increased chance of thyroid cancer detection [1112]. The trends in thyroid cancer incidence and mortality in the United States during 1974 to 2013 based on the Surveillance, Epidemiology, and End Results-9 cancer registry showed that the incidence of thyroid cancer increased by 3% annually (from 4.56 per 100,000 person-years in 1974 to 1977 to 14.42 per 100,000 person-years in 2010 to 2013), with an increase in the mortality rate for advanced-stage papillary cancer [13]. The incidence-based mortality rate of thyroid cancer increased, on average, by 1.1% (95% confidence interval [CI], 0.6% to 1.6%) annually during 1994–2013, from 0.40 (95% CI, 0.36 to 0.44) per 100,000 person-years in 1994–1997 to 0.46 (95% CI, 0.43 to 0.50) per 100,000 person-years in 2010–2013. An annual increase in incidence-based mortality was observed only for PTC, but not for other types of thyroid cancers. This result suggests that there might have been a true increase in thyroid cancer. However, considering the dramatic increase in the incidence of thyroid cancer during these decades, the relatively small changes in thyroid cancer mortality over the same period suggest that overdiagnosis may have been the most common cause of the increased incidence of thyroid cancer. Nonetheless, there have been debates on whether there a true increase in the incidence of thyroid cancer occurred. For instance, several environmental risk factors might be responsible for a true increase in incidence. Plausible factors include the increased incidence of obesity [14]; the decreased prevalence of smoking, which is known to reduce the risk of thyroid cancer [15]; iodine excess (for PTC) in the setting of iodine supplementation in some areas [16]; and endocrine-disrupting chemicals [17].
- However, the fact that the majority of cases that account for the increased incidence of thyroid cancer are PTCs, especially small PTCs [18], and the fact that the incidence of thyroid cancer among screened children and adolescents was approximately 30 times as high as the national average only a few months after US screening began after the nuclear accident in Fukushima in Japan in 2011 [19] suggest that increased detection seems to be the most important factor responsible for the recent surge in thyroid cancer. Vaccarella et al. [20] found that the overdiagnosis of thyroid cancer increased in many countries between 1988 and 2007. Based on thyroid cancer incidence data reported for 2003 to 2007, they estimated that overdiagnosis in women accounted for 90% of thyroid cancer cases in South Korea, 70% to 80% in the United States, Italy, France, and Australia, and 50% in Japan, the Nordic countries, and England.
- A closer look into trends in thyroid cancer incidence and mortality worldwide revealed that the age-standardized mortality rate (ASMR) from thyroid cancer has been declining in most countries between 1970 and 2012, both in men and women, while the incidence of thyroid cancer (mainly PTC) has increased steadily since the 1980s in most countries [18]. This finding suggest that increased detection might be responsible for most of the recent rise in thyroid cancer incidence, rather than there having been a true increase.
- This opposing trends in the incidence of and mortality from thyroid cancer, as well as the possibility of overdiagnosis, make it very important to distinguish high-risk patients who need treatment from low-risk patients in whom treatment may not be necessary.
EPIDEMIOLOGY OF THYROID CANCER
- A nationwide hospital-based cancer registry known as the Korea Central Cancer Registry (KCCR) was launched in 1980 in Korea, collecting 80% to 90% of cancer cases annually from 180 hospitals throughout South Korea. In 1999, the KCCR extended cancer registration to cover the whole population under the Population-Based Regional Cancer Registry Program, which yielded the Korea National Cancer Incidence Database (KNCI DB) [21]. Thereafter, KCCR is known to have complete cancer incidence data, as it collects 97% to 98% of cancer cases, and its cancer incidence data have been linked to mortality data and population registration data from Ministry of the Interior of South Korea [22].
- Based on the KCCR data, thyroid cancer incidence in Korea increased from 6.3 per 100,000 persons in 1999 to 62.5 per 100,000 persons, showing an annual percentage change (APC) of 22.3% in both men and women; this was higher than the APC of any other cancer type. Thyroid cancer was the most common type of cancer from 2009 to 2012 in South Korea, and its incidence in Korea was the highest worldwide [21]. The increase in thyroid cancer incidence was more prominent in South Korea than in other countries, primarily due to widespread US screening of thyroid nodules [232425]. These trends ignited debates about overdiagnosis, and diagnostic practices were criticized based on data showing that the screening rate and thyroid cancer incidence showed a significant correlation across various parts of the country, but there was no correlation between the regional screening rates and regional thyroid cancer mortality rates [24].
- We reported that the ASMR from thyroid cancer per 100,000 from 1985 to 2015 obtained from Statistics Korea increased from 1985 to 2004 (from 0.17 per 100,000 in 1985 to 0.85 per 100,000 in 2004) and then steadily decreased from 2004 to 2015 to 0.42 per 100,000 (Fig. 1) [26]. The reasons for the increase in mortality due to thyroid cancer between 1985 and 2004 in Korea are unclear. There might have been a true increase in thyroid cancer during this period in Korea. Although the reasons for such an increase in incidence are not fully clear, the increased prevalence of obesity [1427], the more common use of medical radiation over that period, and higher mean serum thyroid-stimulating hormone (TSH) levels in the general population of Korea [28] might have been responsible. The reason for the decrease in mortality between 2004 and 2015 likewise has not been conclusively established, but the effects of screening for thyroid cancer are the most likely possibility [26]. However, if we consider the recent explosive increase in the incidence of thyroid cancer in Korea, which started in 1999 and peaked at 87.4 per 100,000, the early detection of thyroid cancer does not seem to be cost-effective. This is because a more than 10-fold increase in detected cases was needed to reduce thyroid cancer mortality by half. Therefore, the risk stratification of thyroid cancer based on prognostic markers is of the utmost importance for selecting patients who need active treatment and to determine the optimal timing of treatment in individual cases. This appears to be the most important clinical need that has yet to be met in the management of patients with thyroid cancer.
EPIDEMIOLOGY OF THYROID CANCER IN KOREA
- Based on the epidemiology of thyroid cancer, it is clear that we need to identify prognostic markers of thyroid cancer to select patients who need active treatment, particularly for those with smaller tumors. Factors predicting disease-specific mortality are the most relevant prognostic markers in cancer patients in general, and this is also the case in thyroid cancer. However, the relatively long clinical course of thyroid cancer and its very low mortality rate make this approach challenging for thyroid cancer. Instead, factors predicting recurrence after initial therapy have been used as surrogate markers for predicting thyroid cancer-specific mortality. Based on follow-up data from 952 patients who received standard treatment for PTC for a median of 9.7 years, we reported that the independent prognostic factors predicting recurrence were male sex, tumor size, extrathyroidal invasion, and cervical lymph node metastasis [29]. Among eight commonly used staging systems for thyroid cancer, risk stratification according to the ATA guideline was had the strongest predictive power for recurrence of PTC (proportion of variation in the survival time explained, 88.6%). However, as the ATA risk stratification system depends on factors that might only possible to evaluate after surgery (tumor multifocality; number, location, or extra-nodal extension of metastatic regional lymph nodes; and the presence and/or extent of vascular, capsular, or extra-thyroidal invasion by the tumor) [7], it is of limited usefulness for preoperative risk stratification. Instead, we need to find novel factor(s) predicting recurrence or mortality that can be assessed before surgery.
- Specific mutations associated with thyroid cancer have been proposed as potential prognostic markers. For instance, the BRAF V600E mutation has been reported to be a potential poor prognostic marker in PTC, but its high prevalence in Korea makes it difficult to adopt as a prognostic factor when assessing an individual patient [30]. We reported that although the BRAF V600E mutation was associated with a higher risk of clinical recurrence in low-risk conventional PTC patients, it was not an independent predictor [31]. So far, the best prognostic genetic marker in thyroid cancer, which have been widely accepted by most researchers, is the coexistence of the BRAF V600E and human telomerase reverse transcriptase (TERT) promoter mutations [3233]. However, the prevalence of TERT promoter mutations is low in PTCs in general (around 10%) [34], and even lower in micro-PTC [35]. Therefore, it is likely to define only a very small subgroup of patients with the highest risk. Moreover, since TERT promoter mutations are mainly found in larger tumors and/or in older patients, these events appear to be late events in thyroid carcinogenesis. There is a clear need to discover prognostic marker(s), including genetic marker(s), that can be identified in earlier stages of cancer.
KNOWN PROGNOSTIC MARKERS OF THYROID CANCER
- To identify preoperative poor prognostic markers, we analyzed the mutational profile of micro-papillary thyroid carcinomas (PTMCs) with extensive lymph node metastases using targeted next-generation sequencing (NGS) [36]. We also investigated possible differences in the mutational profile between the primary PTMC and the cancer present in its metastatic lymph node. We enrolled 16 PTMC patients with lateral cervical lymph node metastasis who underwent surgery at Asan Medical Center; the median number of metastatic nodes per patient was 11 (range, 7 to 16), the median value of the maximum diameter of node metastasis was 1.4 cm (range, 1.1 to 1.8), and three of the patients also had distant metastasis. DNA from formalin-fixed, paraffin-embedded archival tissues (comprising 16 sets of normal thyroid tissue, the primary PTMC, and the largest metastatic lymph node) were evaluated by targeted NGS using the MiSeq platform (Illumina, San Diego, CA, USA) with OncoPanel AMC version 3 (OP_AMCv3) targeting a total of 382 genes, including the entire exons of 199 genes, 184 hot spots, and the partial introns of eight genes that are often rearranged in cancer. Mutations were found in the BRAF, activin receptor 2A (ACVR2A), RET, anaplastic lymphoma kinase (ALK), ROS proto-oncogene 1 (ROS1), lysine (K)-specific methyltransferase 2A (KMT2A), Janus kinase 2 (JAK2), and RAF1 genes. The BRAF V600E mutation was the most common, and was observed in 23 samples, including 12 primary PTMCs (75%) and 11 metastatic LNs (69%). Moreover, the mutational status of the primary tumor and that of metastatic LNs showed very similar patterns in individual patients. The mutational frequency of PTMCs was strikingly low, with a mean number of mutations per sample of only 1.1 (range, 0 to 4). These findings strongly suggest that genetic alterations play a minor role in the progression of PTMC and that epigenetic changes seem to be more important for cancer progression.
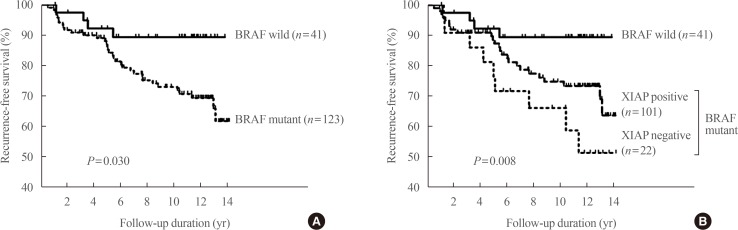
- We also attempted to identify factors associated with a poor prognosis that can be assessed before initial surgery. The first one we reported was the X-linked inhibitor of apoptosis protein (XIAP), which is known to be associated with carcinogenesis, cancer progression, and metastasis through inhibition of the caspase-mediated apoptotic pathway [36]. Immunohistochemical staining demonstrated positive XIAP expression in 128 of 164 patients (75%). The frequency of lateral cervical lymph node metastasis was significantly higher in patients with XIAP-negative tumors (31%) than in those with XIAP-positive tumors (11%, P=0.01). The BRAF V600E mutation was significantly associated with cancer recurrence (hazard ratio, 2.98; P=0.039). Patients with PTCs positive for the BRAF V600E mutation and negative for XIAP expression had a significantly higher rate of recurrence (hazard ratio, 4.53; P=0.012) (Fig. 2). This finding emphasizes that XIAP expression could be used as an independent prognostic marker in areas such as Korea, where the BRAF mutation rate is high in PTCs.
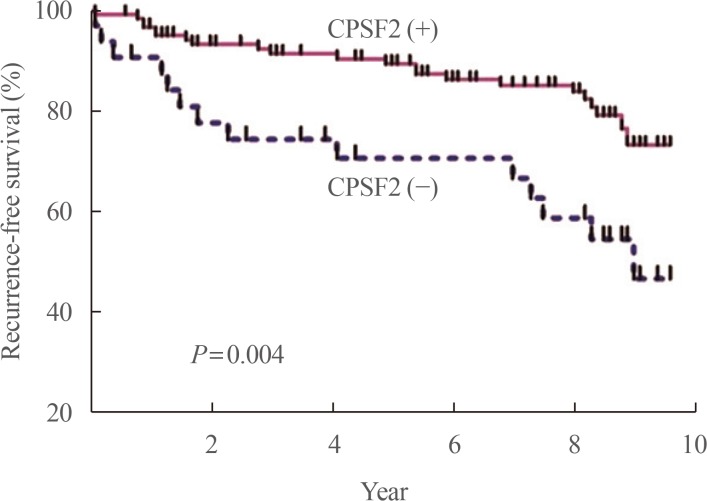
- We reported that cleavage and polyadenylation specific factor 2 (CPSF2) expression predicted poor clinical outcomes in patients with PTC [37]. CPSF2 is the 100 kDa subunit of CPSF, which is involved in cleavage of the 3′ signaling region from a newly synthesized pre-mRNA molecule during gene transcription, and we investigated it because a recent study found that loss of CPSF2 gene expression is related to mortality in patients with PTC on the basis of genome-wide expression analyses. We found that negative protein expression of CPSF2 was observed in 34 (21.3%) of the 159 PTCs. In multivariate analysis, negative CPSF2 expression was significantly associated with the presence of cervical lymph node metastasis (odds ratio [OR], 2.56; P=0.28) and distant metastasis (OR, 3.48; P=0.02). After adjustment for age, sex, tumor size, extrathyroidal extension, lymphovascular invasion, and the BRAF V600E mutation, CPSF2-negative patients showed significantly shorter recurrence-free survival than CPSF2-positive patients (hazard ratio, 2.14; P=0.03) (Fig. 3).
- We also recently reported that Slit2 plays a role as a tumor suppressor, making it a novel prognostic and potential therapeutic target for thyroid cancer [38]. Axon guidance molecules, originally found to regulate the growth and positioning of neurons in the developing brain, have been shown to play important roles during cancer progression. Slit1-3, which transmit signals through their Roundabout (Robo) transmembrane receptors (Robo1-4), are representative axon guidance molecules [39]. A genome-wide linkage analysis was conducted of families with high frequencies of PTC [40], identifying the Slit-Robo rho GTPase activating protein 1 (SRGAP1) gene as a candidate gene for PTC susceptibility and suggesting that Slit-Robo signaling may play a role in PTC. When we evaluated the protein expression of Slit2 in PTCs, 24 of 160 PTCs (15%) were negative for Slit2 protein expression, and those patients had significantly higher risks of cervical lymph node metastasis (P<0.001), distant metastasis (P<0.001), and recurrence of PTC (P<0.001) (Fig. 4) [38]. Therefore, we found evidence for the possibility that the Slit-Robo system might be another preoperative prognostic marker for PTC patients. We also confirmed the tumor suppressor role of Slit2 by showing that Slit2 knockdown activated the migration and invasion of thyroid cancer cells and transcriptional activity of β-catenin. Fragment Slit2 treatment inhibited thyroid cancer cell proliferation in a dose-dependent manner, and inhibited migration and invasion.
- These recent studies conducted by our group have clearly demonstrated the possibility of stratifying clinical risk based on protein expression of prognostic markers in thyroid cancers using FNA samples or preoperative biopsy samples. However, as these studies were conducted in different sets of patients, multiple markers should be simultaneously investigated as a panel to improve the risk stratification of patients. For clinical applications, we need further studies with a systematic approach, and we must elucidate the underlying genetic or epigenetic mechanisms of such changes.
SEARCHING FOR NOVEL PROGNOSTIC MARKERS OF THYROID CANCER
- Another important unmet clinical need is the treatment of de-differentiated DTC, which refers to DTC, Hürthle cell cancers, and poorly differentiated carcinomas (PDTCs) that lose their capability to take up and concentrate RAI during the course of tumor progression, a characteristic known as RAI refractoriness. RAI refractoriness occurs in approximately 60% to 70% of metastatic thyroid cancers, but in fewer than 5% of all thyroid cancers. RAIR DTC patients have a poorer prognosis than those with RAI-avid DTC, with a mean life expectancy of 3 to 5 years [41]. Moreover, there is no effective treatment modality for anaplastic thyroid carcinoma (ATC). The management of patients with these kinds of thyroid cancers remains an unresolved, challenging clinical problem.
- Patients with DTC or medullary thyroid cancer are usually initially treated with surgical resection of the tumor and metastatic disease in the neck and upper mediastinum if surgically resectable. DTC treated by surgery (total thyroidectomy) might require subsequent RAI therapy based on the presence—confirmed or possible—of metastatic or residual disease. During the monitoring after initial management, recurrence or distant metastasis might be found. In DTC patients, if the lesions are RAI-avid, RAI therapy is the treatment of choice, but many patients with recurrence or metastasis show RAI refractoriness.
- The current management options for patients with RAIR thyroid cancer are (1) watchful waiting in asymptomatic, non-progressive lesions; (2) local therapies, such as external beam radiation therapy [42] or stereotactic radiosurgery [43], ablation of tumor tissue with radiofrequency thermal ablation/cryoablation/laser ablation [444546], endotracheal stenting [47], percutaneous interventions such as chemoembolization, US-guided ethanol injection into lymph nodes, or bone cementoplasty [48], and metastectomy for bone and lung metastasis [49]; and (3) systemic therapies such as conventional chemotherapeutic agents, tyrosine kinase inhibitors, immune checkpoint inhibitors, and specific inhibitors of signaling pathways, such as the NTRK (tropomyosin receptor kinase), BRAF, mitogen-activated protein kinase–extracellular signal-regulated kinase (MAPK-ERK) kinase (MEK), RET receptor, and mammalian target of rapamycin (mTOR) pathways.
- The Food and Drug Administration-approved systemic agents for the treatment of thyroid cancer (DTC/ATC) are (1) doxorubicin (1980, for DTC), (2) sorafenib (2013, for RAIR DTC) [9], (3) lenvatinib (2015, for RAIR DTC) [8], (4) pembrolizumab (2015, for solid cancers with high microsatellite instability or those with defective mismatch repair) [50], (5) combination therapy of dabrafenib and trametinib (2018, for ATC with the BRAF V600E mutation) [51], and (6) larotrectinib (2018, for thyroid cancer with the NTRK fusion gene). However, of all these systemic agents, a significant prolongation of overall survival has only been documented for a subset of patients (>65 years) treated with lenvatinib. Because of the significant toxicity and high costs of these medications, physicians should consider several factors, such as the progression rate of the tumor, tumor burden, symptoms, location(s) of metastasis, age, and genetic profile of the tumor before initiating treatment with systemic agents.
- Based on the efficacy and safety of the available systemic therapeutic agents, it is clearly necessary to develop more effective agents to treat patients with RAIR thyroid cancer.
- Although substantial changes in cancer therapy have occurred in the last decade, the majority of newly approved molecular-targeted drugs failed to result in significant and long-lasting improvements of therapeutic efficacy. This is partially explained by the hallmark genomic instability of malignant cells, which results in an impressive propensity to adapt to and, ultimately, resist the inactivation of purportedly ‘cancer-specific’ signaling pathways [52]. Inhibiting processes that are absolutely essential and non-redundant for tumor cell proliferation is a promising strategy to improve cancer therapy. One such possibility is targeting tumor-specific metabolism.
- Metabolic reprogramming of cancer cells is an essential hallmark of cancer [53], and is regulated by both oncogenic signaling and tumor suppressor genes associated with critical signaling pathways in metabolism. These changes provide energy, substrates for cell growth and proliferation, and a favorable microenvironment; furthermore, they are important for redox balancing in cancer cells [53]. Recent advance in several tools for evaluating the comprehensive metabolic profiles of cancer cells have enabled researchers to identify the metabolic weak points of various cancers, including thyroid cancer.
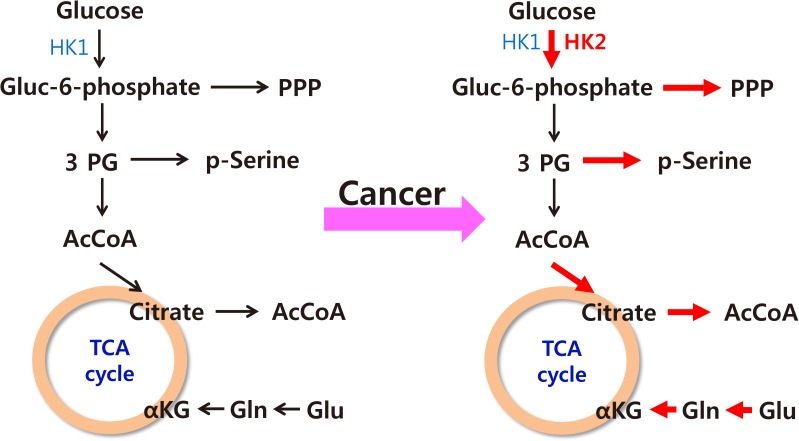
- The characteristics of cancer cell metabolism can be summarized as (1) increased uptake of glucose and glutamine; (2) activation of the pentose phosphate pathway, which requires glucose 6-phosphate as its starting material; (3) activation of the serine synthetic pathway, which requires 3-phosphoglycerate as its starting material; and (4) an increased output of citrate from the mitochondria for the synthesis of fatty acids (Fig. 5) [54]. The common goal of such changes seems to be the activation of synthesis of macromolecules such as lipids, proteins, and nucleic acids, which comprise the predominant proportion of cellular mass.
- We performed metabolic fingerprinting of thyroid cancer tissue (in PTCs) to find specific metabolic changes, and found similar changes to those that had been observed in other solid cancers. We found that the pathway for serine synthesis was frequently activated in thyroid cancer tissue, showing increased expression of phosphoglycerate dehydrogenase (PHGDH) and phosphoserine phosphatase (PSPH), which was observed in all types of thyroid cancer, including DTC, PDTC, and ATC. PTCs with a higher expression of PHGDH showed a larger primary tumor size (P<0.05), more frequent LN metastasis (PHGDH-negative group, 7 of 29 vs. PHGDH-positive group, 61 of 131; P<0.05) and more frequent distant metastasis (PHGDH-negative group, 0 of 29 vs. PHGDH-positive group, 18 of 131; P<0.05) (unpublished results). There was no significant difference in the proportion of tumors that were BRAF mutation-positive between the PHGDH-negative group and the PHGDH-positive. Suppression of PHGDH by short hairpin RNA markedly decreased cancer cell growth and clonogenic activity in several thyroid cancer cell lines (irrespective of the driver mutations of the cell lines), and suppressed tumor growth in a xenograft model of thyroid cancer. PTC tissues from patients showed close correlations between the expression of PHGDH and stem cell markers such as sex determining region Y (SRY)-box 2 (Sox2), Krueppel-like factor 4 (KLF4), octamer-binding transcription factor 4 (Oct4), Nanog, and B lymphoma Mo-MLV insertion region 1 homolog (Bmi). These findings suggest that the activation of PHGDH may be a key metabolic feature characterizing cancer cell stemness and that it may function as a prognostic marker and novel therapeutic target of thyroid cancer. Based on our in vitro data, it is highly likely that agents blocking PHGDH activity and those blocking oncogenic signaling may work synergistically in killing tumor cells, irrespective of the mutational status of the tumor.
NOVEL THERAPEUTIC TARGETS IN THYROID CANCER
- Thyroid cancer is unique in that the patient's age is a prognostic factor in various cancer staging systems, including the tumor, node, metastasis (TNM) staging system [55]. The underlying mechanism of why advanced age adversely affects patients' outcome has not been clearly documented. Proposed explanations for this relationship include poor uptake or response to RAI therapy, age-related increases in serum TSH concentrations, decreased immune system activity, and higher rates of the BRAF V600E mutation in tumors [56]. A recent retrospective study showed associations of the neutrophil-to-lymphocyte ratio and the platelet-to-lymphocyte ratio with disease recurrence, suggesting that an aging-induced decrease in immune system activity may be the most plausible mechanism [57].
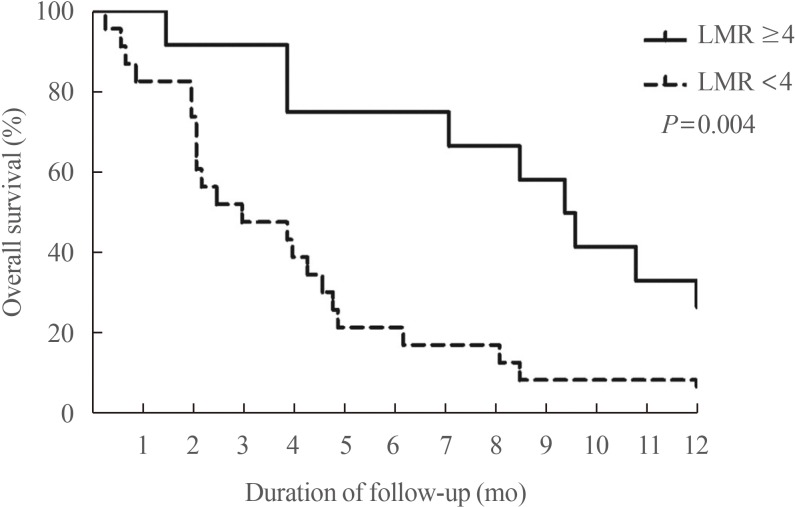
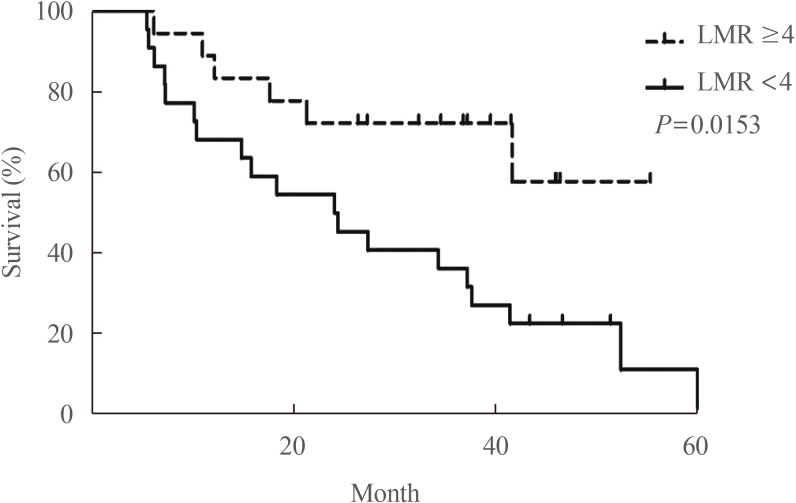
- Our group recently found that the lymphocyte-to-monocyte ratio (LMR), which is reflective of tumor-infiltrating immune cell status and host immunity, is a prognostic marker capable of predicting the survival of patients with ATC (Fig. 6) [58] and RAIR DTC patients treated with sorafenib (Fig. 7) [59]. A low LMR might be a reflection of both lymphopenia, which is a marker of weak immunity, and an elevated monocyte count in the peripheral blood, which reflects elevated tumor-associated macrophage density in cancer tissue (corresponding to favorable conditions for tumor progression) [60].
- These findings suggest that tumor-host interactions, including tumor immunity, play an important role in the process of tumor progression, with effects on patients' outcomes. However, few studies have taken these factors into account when evaluating the outcomes of patients with thyroid cancer. To improve our understanding of thyroid cancer and to provide better treatment for patients, we need to obtain deeper insights into tumor-host interactions in our future research on thyroid cancer.
UNDERSTANDING OF TUMOR-HOST INTERACTIONS TO IMPROVE THE TREATMENT OF THYROID CANCER
- The recent worldwide increase in the incidence of thyroid cancer, together with a decreasing trend in mortality from thyroid cancer, raise the possibility of overdiagnosis, making it critically important to differentiate high-risk patients who need treatment from low-risk patients. As most previously established risk factors can only be evaluated after the surgical removal of tumors, identifying preoperative risk factors is urgently needed for clinical applications. We found that specific genetic changes in the tumor are not likely to be candidates for such prognostic factors, and that epigenetic changes or protein markers might be more appropriate. We have recently found some candidates, but a more systemic approach is needed to improve the stratification of patients. Active surveillance might be a reasonable alternative for small DTCs, but the documentation of long-term oncological safety and the definition of optimal candidates are necessary prior to routine clinical applications.
- For the treatment of patients with dedifferentiated DTC, poorly differentiated thyroid carcinoma, and ATC, it is clearly necessary to develop more effective agent(s). Agents targeting tumor-specific changes in metabolism or immunotherapeutic agents might be promising candidates, and we recently found that PHGDH, a critical enzyme in tumor-specific metabolic changes, may be a novel therapeutic target in thyroid cancer.
- Finally, we need to obtain deeper insights into tumor-host interactions to improve our understanding of thyroid cancer and to provide better treatment for patients.
CONCLUSIONS
-
CONFLICTS OF INTEREST: No potential conflict of interest relevant to this article was reported.
Article information
- 1. Burman KD, Wartofsky L. Thyroid nodules. N Engl J Med 2016;374:1294–1295.Article
- 2. Ezzat S, Sarti DA, Cain DR, Braunstein GD. Thyroid incidentalomas. Prevalence by palpation and ultrasonography. Arch Intern Med 1994;154:1838–1840. ArticlePubMed
- 3. Leenhardt L, Bernier MO, Boin-Pineau MH, Conte Devolx B, Marechaud R, Niccoli-Sire P, et al. Advances in diagnostic practices affect thyroid cancer incidence in France. Eur J Endocrinol 2004;150:133–139. ArticlePubMed
- 4. Brito JP, Al Nofal A, Montori VM, Hay ID, Morris JC. The Impact of subclinical disease and mechanism of detection on the rise in thyroid cancer incidence: a population-based study in Olmsted County, Minnesota during 1935 through 2012. Thyroid 2015;25:999–1007. ArticlePubMedPMC
- 5. Aschebrook-Kilfoy B, Schechter RB, Shih YC, Kaplan EL, Chiu BC, Angelos P, et al. The clinical and economic burden of a sustained increase in thyroid cancer incidence. Cancer Epidemiol Biomarkers Prev 2013;22:1252–1259. ArticlePubMed
- 6. Singer PA, Cooper DS, Daniels GH, Ladenson PW, Greenspan FS, Levy EG, et al. Treatment guidelines for patients with thyroid nodules and well-differentiated thyroid cancer. American Thyroid Association. Arch Intern Med 1996;156:2165–2172. ArticlePubMed
- 7. Haugen BR, Alexander EK, Bible KC, Doherty GM, Mandel SJ, Nikiforov YE, et al. 2015 American Thyroid Association management guidelines for adult patients with thyroid nodules and differentiated thyroid cancer: the American Thyroid Association guidelines task force on thyroid nodules and differentiated thyroid cancer. Thyroid 2016;26:1–133. ArticlePubMedPMC
- 8. Schlumberger M, Tahara M, Wirth LJ, Robinson B, Brose MS, Elisei R, et al. Lenvatinib versus placebo in radioiodine-refractory thyroid cancer. N Engl J Med 2015;372:621–630. ArticlePubMed
- 9. Brose MS, Nutting CM, Jarzab B, Elisei R, Siena S, Bastholt L, et al. Sorafenib in radioactive iodine-refractory, locally advanced or metastatic differentiated thyroid cancer: a randomised, double-blind, phase 3 trial. Lancet 2014;384:319–328. ArticlePubMedPMC
- 10. Kilfoy BA, Zheng T, Holford TR, Han X, Ward MH, Sjodin A, et al. International patterns and trends in thyroid cancer incidence, 1973-2002. Cancer Causes Control 2009;20:525–531. ArticlePubMedPDF
- 11. Davies L, Welch HG. Increasing incidence of thyroid cancer in the United States, 1973-2002. JAMA 2006;295:2164–2167. ArticlePubMed
- 12. Sosa JA, Hanna JW, Robinson KA, Lanman RB. Increases in thyroid nodule fine-needle aspirations, operations, and diagnoses of thyroid cancer in the United States. Surgery 2013;154:1420–1426. ArticlePubMed
- 13. Lim H, Devesa SS, Sosa JA, Check D, Kitahara CM. Trends in thyroid cancer incidence and mortality in the United States, 1974-2013. JAMA 2017;317:1338–1348. ArticlePubMedPMC
- 14. Schmid D, Ricci C, Behrens G, Leitzmann MF. Adiposity and risk of thyroid cancer: a systematic review and meta-analysis. Obes Rev 2015;16:1042–1054. ArticlePubMed
- 15. Kitahara CM, Linet MS, Beane Freeman LE, Check DP, Church TR, Park Y, et al. Cigarette smoking, alcohol intake, and thyroid cancer risk: a pooled analysis of five prospective studies in the United States. Cancer Causes Control 2012;23:1615–1624. ArticlePubMedPMCPDF
- 16. Blomberg M, Feldt-Rasmussen U, Andersen KK, Kjaer SK. Thyroid cancer in Denmark 1943-2008, before and after iodine supplementation. Int J Cancer 2012;131:2360–2366. ArticlePubMed
- 17. Pellegriti G, Frasca F, Regalbuto C, Squatrito S, Vigneri R. Worldwide increasing incidence of thyroid cancer: update on epidemiology and risk factors. J Cancer Epidemiol 2013;2013:965212. ArticlePubMedPMCPDF
- 18. La Vecchia C, Malvezzi M, Bosetti C, Garavello W, Bertuccio P, Levi F, et al. Thyroid cancer mortality and incidence: a global overview. Int J Cancer 2015;136:2187–2195. ArticlePubMed
- 19. Tsuda T, Tokinobu A, Yamamoto E, Suzuki E. Thyroid cancer detection by ultrasound among residents ages 18 years and younger in Fukushima, Japan: 2011 to 2014. Epidemiology 2016;27:316–322. ArticlePubMedPMC
- 20. Vaccarella S, Franceschi S, Bray F, Wild CP, Plummer M, Dal Maso L. Worldwide thyroid-cancer epidemic? The increasing impact of overdiagnosis. N Engl J Med 2016;375:614–617. ArticlePubMed
- 21. Jung KW, Won YJ, Kong HJ, Oh CM, Cho H, Lee DH, et al. Cancer statistics in Korea: incidence, mortality, survival, and prevalence in 2012. Cancer Res Treat 2015;47:127–141. ArticlePubMedPMCPDF
- 22. Jung KW, Won YJ, Kong HJ, Lee ES. Cancer statistics in Korea: incidence, mortality, survival, and prevalence in 2016. Cancer Res Treat 2019;51:417–430. ArticlePubMedPMCPDF
- 23. Ahn HS, Kim HJ, Welch HG. Korea's thyroid-cancer “epidemic”: screening and overdiagnosis. N Engl J Med 2014;371:1765–1767. ArticlePubMed
- 24. Ahn HS, Kim HJ, Kim KH, Lee YS, Han SJ, Kim Y, et al. Thyroid cancer screening in South Korea increases detection of papillary cancers with no impact on other subtypes or thyroid cancer mortality. Thyroid 2016;26:1535–1540. ArticlePubMed
- 25. Park S, Oh CM, Cho H, Lee JY, Jung KW, Jun JK, et al. Association between screening and the thyroid cancer “epidemic” in South Korea: evidence from a nationwide study. BMJ 2016;355:i5745. ArticlePubMedPMC
- 26. Choi YM, Kim WG, Kwon H, Jeon MJ, Han M, Kim TY, et al. Changes in standardized mortality rates from thyroid cancer in Korea between 1985 and 2015: analysis of Korean national data. Cancer 2017;123:4808–4814. ArticlePubMed
- 27. Han JM, Kim TY, Jeon MJ, Yim JH, Kim WG, Song DE, et al. Obesity is a risk factor for thyroid cancer in a large, ultrasonographically screened population. Eur J Endocrinol 2013;168:879–886. ArticlePubMed
- 28. Kim WG, Kim WB, Woo G, Kim H, Cho Y, Kim TY, et al. Thyroid stimulating hormone reference range and prevalence of thyroid dysfunction in the Korean population: Korea National Health and Nutrition Examination Survey 2013 to 2015. Endocrinol Metab (Seoul) 2017;32:106–114. ArticlePubMedPMC
- 29. Kim WG, Kim EY, Yim JH, Han JM, Jeon MJ, Kim TY, et al. Comparison of different staging systems for predicting recurrence of papillary thyroid carcinoma. Endocrinol Metab (Seoul) 2011;26:53–61.Article
- 30. Chung KW, Yang SK, Lee GK, Kim EY, Kwon S, Lee SH, et al. Detection of BRAFV600E mutation on fine needle aspiration specimens of thyroid nodule refines cyto-pathology diagnosis, especially in BRAF600E mutation-prevalent area. Clin Endocrinol (Oxf) 2006;65:660–666. ArticlePubMed
- 31. Kim TY, Kim WB, Rhee YS, Song JY, Kim JM, Gong G, et al. The BRAF mutation is useful for prediction of clinical recurrence in low-risk patients with conventional papillary thyroid carcinoma. Clin Endocrinol (Oxf) 2006;65:364–368. ArticlePubMed
- 32. Liu R, Bishop J, Zhu G, Zhang T, Ladenson PW, Xing M. Mortality risk stratification by combining BRAF V600E and TERT promoter mutations in papillary thyroid cancer: genetic duet of BRAF and TERT promoter mutations in thyroid cancer mortality. JAMA Oncol 2017;3:202–208. ArticlePubMed
- 33. Xing M. Genetic-guided risk assessment and management of thyroid cancer. Endocrinol Metab Clin North Am 2019;48:109–124. ArticlePubMedPMC
- 34. Liu R, Xing M. TERT promoter mutations in thyroid cancer. Endocr Relat Cancer 2016;23:R143–R155. ArticlePubMedPMC
- 35. Jeon MJ, Chun SM, Lee JY, Choi KW, Kim D, Kim TY, et al. Mutational profile of papillary thyroid microcarcinoma with extensive lymph node metastasis. Endocrine 2019;64:130–138. ArticlePubMedPDF
- 36. Yim JH, Kim WG, Jeon MJ, Han JM, Kim TY, Yoon JH, et al. Association between expression of X-linked inhibitor of apoptosis protein and the clinical outcome in a BRAF V600E-prevalent papillary thyroid cancer population. Thyroid 2014;24:689–694. ArticlePubMedPMC
- 37. Sung TY, Kim M, Kim TY, Kim WG, Park Y, Song DE, et al. Negative expression of CPSF2 predicts a poorer clinical outcome in patients with papillary thyroid carcinoma. Thyroid 2015;25:1020–1025. ArticlePubMed
- 38. Jeon MJ, Lim S, You MH, Park Y, Song DE, Sim S, et al. The role of Slit2 as a tumor suppressor in thyroid cancer. Mol Cell Endocrinol 2019;483:87–96. ArticlePubMed
- 39. Biankin AV, Waddell N, Kassahn KS, Gingras MC, Muthuswamy LB, Johns AL, et al. Pancreatic cancer genomes reveal aberrations in axon guidance pathway genes. Nature 2012;491:399–405. ArticlePubMedPMCPDF
- 40. He H, Bronisz A, Liyanarachchi S, Nagy R, Li W, Huang Y, et al. SRGAP1 is a candidate gene for papillary thyroid carcinoma susceptibility. J Clin Endocrinol Metab 2013;98:E973–E980. ArticlePubMedPMCPDF
- 41. Durante C, Haddy N, Baudin E, Leboulleux S, Hartl D, Travagli JP, et al. Long-term outcome of 444 patients with distant metastases from papillary and follicular thyroid carcinoma: benefits and limits of radioiodine therapy. J Clin Endocrinol Metab 2006;91:2892–2899. ArticlePubMedPDF
- 42. Hamilton SN, Tran E, Berthelet E, Wu J. The role of external beam radiation therapy in well-differentiated thyroid cancer. Expert Rev Anticancer Ther 2017;17:905–910. ArticlePubMed
- 43. Dunne EM, Fraser IM, Liu M. Stereotactic body radiation therapy for lung, spine and oligometastatic disease: current evidence and future directions. Ann Transl Med 2018;6:283. ArticlePubMedPMC
- 44. Choy PY, Koea J, McCall J, Holden A, Osbourne M. The role of radiofrequency ablation in the treatment of primary and metastatic tumours of the liver: initial lessons learned. N Z Med J 2002;115:U128. PubMed
- 45. Mazzeo S, Cervelli R, Elisei R, Tarantini G, Cappelli C, Molinaro E, et al. mRECIST criteria to assess recurrent thyroid carcinoma treatment response after radiofrequency ablation: a prospective study. J Endocrinol Invest 2018;41:1389–1399. ArticlePubMedPDF
- 46. Hay ID, Lee RA, Davidge-Pitts C, Reading CC, Charboneau JW. Long-term outcome of ultrasound-guided percutaneous ethanol ablation of selected “recurrent” neck nodal metastases in 25 patients with TNM stages III or IVA papillary thyroid carcinoma previously treated by surgery and 131I therapy. Surgery 2013;154:1448–1454. ArticlePubMed
- 47. Ribechini A, Bottici V, Chella A, Elisei R, Vitti P, Pinchera A, et al. Interventional bronchoscopy in the treatment of tracheal obstruction secondary to advanced thyroid cancer. J Endocrinol Invest 2006;29:131–135. ArticlePubMedPDF
- 48. Deschamps F, de Baere T. Cementoplasty of bone metastases. Diagn Interv Imaging 2012;93:685–689. ArticlePubMed
- 49. Moneke I, Kaifi JT, Kloeser R, Samson P, Haager B, Wiesemann S, et al. Pulmonary metastasectomy for thyroid cancer as salvage therapy for radioactive iodine-refractory metastases. Eur J Cardiothorac Surg 2018;53:625–630. ArticlePubMedPDF
- 50. Mehnert JM, Varga A, Brose MS, Aggarwal RR, Lin CC, Prawira A, et al. Safety and antitumor activity of the anti-PD-1 antibody pembrolizumab in patients with advanced, PD-L1-positive papillary or follicular thyroid cancer. BMC Cancer 2019;19:196. ArticlePubMedPMCPDF
- 51. Subbiah V, Kreitman RJ, Wainberg ZA, Cho JY, Schellens JHM, Soria JC, et al. Dabrafenib and trametinib treatment in patients with locally advanced or metastatic BRAF V600-mutant anaplastic thyroid cancer. J Clin Oncol 2018;36:7–13. ArticlePubMed
- 52. Gillies RJ, Verduzco D, Gatenby RA. Evolutionary dynamics of carcinogenesis and why targeted therapy does not work. Nat Rev Cancer 2012;12:487–493. ArticlePubMedPMCPDF
- 53. Hanahan D, Weinberg RA. Hallmarks of cancer: the next generation. Cell 2011;144:646–674. ArticlePubMed
- 54. Cairns RA, Harris IS, Mak TW. Regulation of cancer cell metabolism. Nat Rev Cancer 2011;11:85–95. ArticlePubMedPDF
- 55. Dean DS, Hay ID. Prognostic indicators in differentiated thyroid carcinoma. Cancer Control 2000;7:229–239. ArticlePubMed
- 56. Haymart MR. Understanding the relationship between age and thyroid cancer. Oncologist 2009;14:216–221. ArticlePubMed
- 57. Lee KH, Seok EY, Kim EY, Yun JS, Park YL, Park CH. Different prognostic values of individual hematologic parameters in papillary thyroid cancer due to age-related changes in immunity. Ann Surg Treat Res 2019;96:70–77. ArticlePubMed
- 58. Ahn J, Song E, Oh HS, Song DE, Kim WG, Kim TY, et al. Low lymphocyte-to-monocyte ratios are associated with poor overall survival in anaplastic thyroid carcinoma patients. Thyroid 2019;29:824–829. ArticlePubMed
- 59. Ahn J, Song E, Kim WG, Kim TY, Kim WB, Shong YK, et al. Prognostic role of the lymphocyte-to-monocyte ratio for clinical outcomes of patients with progressive radioiodine-refractory differentiated thyroid carcinoma treated by sorafenib. Clin Endocrinol (Oxf) 2020;92:71–76. ArticlePubMed
- 60. Stotz M, Pichler M, Absenger G, Szkandera J, Arminger F, Schaberl-Moser R, et al. The preoperative lymphocyte to monocyte ratio predicts clinical outcome in patients with stage III colon cancer. Br J Cancer 2014;110:435–440. ArticlePubMedPDF
References
Fig. 1
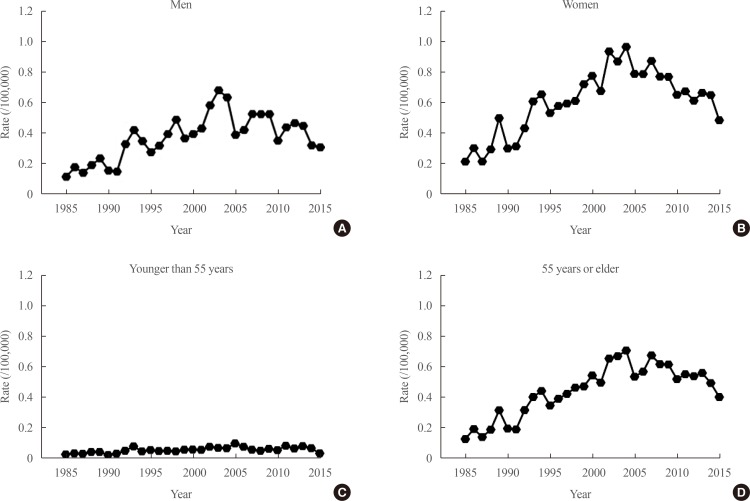
Age-standardized thyroid cancer mortality rates based on the World Health Organization standard population are illustrated from 1985 to 2015 in Korea among (A) men and (B) women and among patients (C) younger than <55 years and (D) aged 55 years and older. Adapted from Choi et al. [26], with permission from John Wiley and Sons (Licence No. 4751250684699).
Fig. 2

Recurrence-free survival according to B type Raf kinase (BRAF) V600E mutational status (A) and BRAF V600E mutational status and X-linked inhibitor of apoptosis protein (XIAP) expression (B) in patients with papillary thyroid carcinoma. The Kaplan-Meier method was used to establish survival curves, and log-rank testing was used to compare recurrence-free survival between groups. Adapted from Yim et al. [36], with permission from Mary Ann Liebert Inc. (publisher does not require authors of the content being used to obtain a license for their personal reuse of full article, charts/graphs/tables or text excerpt).
Fig. 3

Recurrence-free survival according to cleavage and polyadenylation specific factor 2 (CPSF2) protein expression status. The Kaplan-Meier method was used to establish survival curves, and log-rank testing was used to compare recurrence-free survival between groups. Adapted from Sung et al. [37], with permission from Mary Ann Liebert Inc. (publisher does not require authors of the content being used to obtain a license for their personal reuse of full article, charts/graphs/tables or text excerpt).
Fig. 4

Recurrence-free survival (RFS) of patients with papillary thyroid carcinoma (PTC) according to expression of Slit2. PTC patients negative for Slit2 expression had poorer RFS than those positive for Slit2 expression. Adapted from Jeon et al. [38], with permission from Elsevier (License No. 4753570662104).
Fig. 5

Summary of changes in the metabolic characteristics of cancer cells. Red arrows indicate increased activity of various metabolic pathways in cancer. HK, hexokinase; Gluc-6-phosphate, glucose-6-phosphate; PPP, pentose phosphate pathway; 3PG, 3-phosphoglycerate; AcCoA, acetyl coenzyme A; TCA, tricarboxylic acid; αKG, alpha-ketoglutarate; Gln, glutamate; Glu, glutamine.
Fig. 6

Overall survival (OS) based on the lymphocyte-to-monocyte ratio (LMR) in patients with anaplastic thyroid carcinoma. The solid line represents the OS rate of the high LMR group (≥4) (n=12, 34%), while the dotted line represents the OS rate of the low LMR group (<4) (n= 23, 66%). A significant difference was found in the OS between the two groups (P=0.004). Adapted from Ahn et al. [58], with permission from Mary Ann Liebert Inc. (publisher does not require authors of the content being used to obtain a license for their personal reuse of full article, charts/graphs/tables or text excerpt).
Fig. 7

Overall survival based on the lymphocyte-to-monocyte ratio (LMR) in patients with progressive radioiodine-refractory differentiated thyroid carcinoma treated with sorafenib. Adapted from Ahn et al. [59], with permission from John Wiley and Sons (License No. 4757610873680).
Figure & Data
References
Citations
Citations to this article as recorded by 
- Lenvatinib Compared with Sorafenib as a First-Line Treatment for Radioactive Iodine-Refractory, Progressive, Differentiated Thyroid Carcinoma: Real-World Outcomes in a Multicenter Retrospective Cohort Study
Mijin Kim, Meihua Jin, Min Ji Jeon, Eui Young Kim, Dong Yeob Shin, Dong Jun Lim, Bo Hyun Kim, Ho-Cheol Kang, Won Bae Kim, Young Kee Shong, Hee Kyung Kim, Won Gu Kim
Thyroid.2023; 33(1): 91. CrossRef - Serum thyroglobulin testing after thyroid lobectomy in patients with 1–4 cm papillary thyroid carcinoma
Ahreum Jang, Meihua Jin, Chae A Kim, Min Ji Jeon, Yu-Mi Lee, Tae-Yon Sung, Tae Yong Kim, Won Bae Kim, Young Kee Shong, Won Gu Kim
Endocrine.2023; 81(2): 290. CrossRef - Integration of ultrasound-based radiomics with clinical features for predicting cervical lymph node metastasis in postoperative patients with differentiated thyroid carcinoma
Fengjing Fan, Fei Li, Yixuan Wang, Zhengjun Dai, Yuyang Lin, Lin Liao, Bei Wang, Hongjun Sun
Endocrine.2023;[Epub] CrossRef - Transcriptomic Analysis of Papillary Thyroid Cancer: A Focus on Immune-Subtyping, Oncogenic Fusion, and Recurrence
Seung-Jin Park, Yea Eun Kang, Jeong-Hwan Kim, Jong-Lyul Park, Seon-Kyu Kim, Seung-Woo Baek, In Sun Chu, Shinae Yi, Seong Eun Lee, Young Joo Park, Eun-Jae Chung, Jin Man Kim, Hye Mi Ko, Je-Ryong Kim, Seung-Nam Jung, Ho-Ryun Won, Jae Won Chang, Bon Seok Koo
Clinical and Experimental Otorhinolaryngology.2022; 15(2): 183. CrossRef - Prognosis of Patients with 1–4 cm Papillary Thyroid Cancer Who Underwent Lobectomy: Focus on Gross Extrathyroidal Extension Invading Only the Strap Muscles
Ahreum Jang, Meihua Jin, Won Woong Kim, Min Ji Jeon, Tae-Yon Sung, Dong Eun Song, Tae Yong Kim, Ki-Wook Chung, Won Bae Kim, Young Kee Shong, Yu-Mi Lee, Won Gu Kim
Annals of Surgical Oncology.2022; 29(12): 7835. CrossRef - Carboxy terminus of HSP70‐interacting protein (CHIP) attenuates the stemness of thyroid cancer cells through decreasing OCT4 protein stability
Ying Xu, Gang Xu, Huimin Dang, Wei Qu, Dan Chang, Xin He, Minmin Li, Qian Wang
Environmental Toxicology.2021; 36(4): 686. CrossRef - Lactate Dehydrogenase A as a Potential New Biomarker for Thyroid Cancer
Eun Jeong Ban, Daham Kim, Jin Kyong Kim, Sang-Wook Kang, Jandee Lee, Jong Ju Jeong, Kee-Hyun Nam, Woong Youn Chung, Kunhong Kim
Endocrinology and Metabolism.2021; 36(1): 96. CrossRef - Clinical implications of age and excellent response to therapy in patients with high‐risk differentiated thyroid carcinoma
Meihua Jin, Jonghwa Ahn, Yu‐Mi Lee, Tae‐Yon Sung, Dong Eun Song, Tae Yong Kim, Ki‐Wook Chung, Jin‐Sook Ryu, Won Bae Kim, Young Kee Shong, Min Ji Jeon, Won Gu Kim
Clinical Endocrinology.2021; 95(6): 882. CrossRef - CD73 Overexpression Promotes Progression and Recurrence of Papillary Thyroid Carcinoma
Young Mun Jeong, Haejin Cho, Tae-Min Kim, Yourha Kim, Sora Jeon, Andrey Bychkov, Chan Kwon Jung
Cancers.2020; 12(10): 3042. CrossRef - The Role of Exosomes in Thyroid Cancer and Their Potential Clinical Application
Kaixiang Feng, Runsheng Ma, Lele Zhang, Hongqiang Li, Yifeng Tang, Gongbo Du, Dongpeng Niu, Detao Yin
Frontiers in Oncology.2020;[Epub] CrossRef
 PubReader
 ePub Link
 Cite
Cite