Articles
- Page Path
- HOME > Endocrinol Metab > Volume 34(1); 2019 > Article
-
Original ArticleRetrospective Analysis of the Efficacy of Dapagliflozin in Patients with Type 2 Diabetes in a Primary Clinic in Korea
 Audioslide
 -
Sang Hyun Park1, Young Ju Choi2, Eun-Jung Rhee1
 , Kab Bum Huh2
 -
Endocrinology and Metabolism 2019;34(1):70-79.
DOI: https://doi.org/10.3803/EnM.2019.34.1.70
Published online: March 21, 2019
1Division of Endocrinology and Metabolism, Department of Internal Medicine, Kangbuk Samsung Hospital, Sungkyunkwan University School of Medicine, Seoul, Korea.
2Huh's Diabetes Center and 21st Century Diabetes and Vascular Research Institute, Seoul, Korea.
- Corresponding author: Eun-Jung Rhee. Division of Endocrinology and Metabolism, Department of Internal Medicine, Kangbuk Samsung Hospital, Sungkyunkwan University School of Medicine, 29 Saemunan-ro, Jongno-gu, Seoul 03181, Korea. Tel: +82-2-2001-2485, Fax: +82-2-2001-1588, hongsiri@hanmail.net
- Corresponding author: Kab Bum Huh. Huh's Diabetes Center and 21st Century Diabetes and Vascular Research Institute, 120 Sinchon-ro, Mapo-gu, Seoul 04101, Korea. Tel: +82-2-718-1827, Fax: +82-2-704-5750, huh7181827@hanmail.net
Copyright © 2019 Korean Endocrine Society
This is an Open Access article distributed under the terms of the Creative Commons Attribution Non-Commercial License (http://creativecommons.org/licenses/by-nc/4.0/) which permits unrestricted non-commercial use, distribution, and reproduction in any medium, provided the original work is properly cited.
ABSTRACT
-
Background
- We aimed to retrospectively analyze the efficacy of 10 mg dapagliflozin (DAPA), which is a sodium-glucose cotransporter-2 inhibitor, in Korean patients with type 2 diabetes who visited a primary diabetes clinic.
-
Methods
- In total, 83 patients with type 2 diabetes, who received treatment with DAPA for the first time in a primary diabetes clinic between January 2015 and October 2015, were included in the study. The effect of DAPA in lowering glycosylated hemoglobin (HbA1c) levels was evaluated via chart review at 6 months follow-up. The patients were categorized into five groups according to add-on to or switched from other glucose-lowering agents: add-on to metformin (MET, n=10), add-on to MET+dipeptidyl peptidase 4 inhibitor (DPP4i, n=12), switched from sulfonylurea (SU, n=13), switched from DPP4i (n=11), and switched from thiazolidinedione (TZD, n=37). All the participants had already used MET for their regimen.
-
Results
- Treatment with DAPA reduced HbA1c level by 1.2%±0.8%. Moreover, a significant decrease was observed in all subgroups: add-on to MET, −1.2%±0.7%; add-on to MET+DPP4i, −1.4%±0.8%; switched from SU, −1.4%±0.7%; switched from DPP4i, −0.5%±0.7%; and switched from TZD, −1.2%±0.9% (P<0.01). A significant decrease in body weight (−3.1±2.6 kg, P<0.001) was observed after DAPA administration. Estimated glomerular filtration rate and urine microalbumin were significantly decreased after 6 months of treatment with DAPA (−4.0±13.5 mL/min/1.73 m2, P=0.03; −23.6±45.9 mg/L, P<0.001).
-
Conclusion
- Treatment with DAPA, whether added to or switched from other glucose-lowering agents, significantly decreased HbA1c levels in Korean patients with type 2 diabetes who visited a single primary diabetes clinic. DAPA can be considered as an optimal second-line treatment for patients with type 2 diabetes, as supported by real-world evidence studies.
- According to the Diabetes Atlas 2017, 425 million individuals present with diabetes worldwide, and data from the Diabetes Fact Sheet 2018 in Korea have shown that approximately 14% of Koreans present with diabetes based on the Korean National Health and Nutrition Survey 2016 [12]. As the prevalence of type 2 diabetes is markedly increasing, the optimal selection of anti-diabetic agents that could prevent complications is required.
- Since 2011, metformin (MET) has been recommended as the first-line oral medication in individuals who do not achieve their target glycosylated hemoglobin (HbA1c) level after lifestyle management [3]. In terms of second-line anti-diabetic agents, recent guidelines have highlighted the importance of individualizing pharmacologic therapy. This year, the American Diabetes Association (ADA) and European Association for the Study of Diabetes (EASD) released a consensus report on new recommendations for the selection of second-line anti-diabetic agents after MET; thus, the patients were categorized into two large categories (with and without established cardiovascular disease [CVD]), and this indicates that the selection of anti-diabetic agents must be according to the presence or absence of baseline CVD and heart failure (HF) [4]. In this guideline, sodium-glucose cotransporter-2 inhibitor (SGLT2i) and glucagon-like peptide-1 agonist were recommended as the second-line anti-diabetic medication after MET for patients with CVD, HF, and underlying chronic kidney disease.
- SGLT2i blocks the re-uptake of glucose in the renal tubules, inducing urinary glucose excretion, and it does not only lower blood glucose levels but also decrease body weight and blood pressure (BP) [5]. According to randomized clinical trials (RCTs) and real-world evidence studies [6789], SGLT2is have cardiovascular benefits; they significantly decrease the rate of mortality from CVD and hospitalization due to HF, which is observed across the classes of these agents [10]. Although unclear, the mechanisms underlying the cardiovascular benefits of such agents were almost certainly attributable to not just glucose lowering but also the metabolic effects of weight reduction, natriuresis, and decrease in BP [11].
- Several SGLT2is are available in the market [12]. Dapagliflozin (DAPA) was the second SGLT2i that was approved by the U.S. Food and Drug Administration. In Korea, the prescription of DAPA has increased rapidly. In this study, we retrospectively analyzed the efficacy of DAPA in patients with type 2 diabetes in a single primary clinical in Korea.
INTRODUCTION
- Study design/patient selection
- Patients with type 2 diabetes who received treatment with 10 mg DAPA for the first time between January 2015 and October 2015 were included in this retrospective study. The patients visited the outpatient clinic of Huh's Diabetes Center and 21st Century Diabetes and Vascular Research Institute, Seoul, Korea, at an interval of 2 months for a total of three visits.
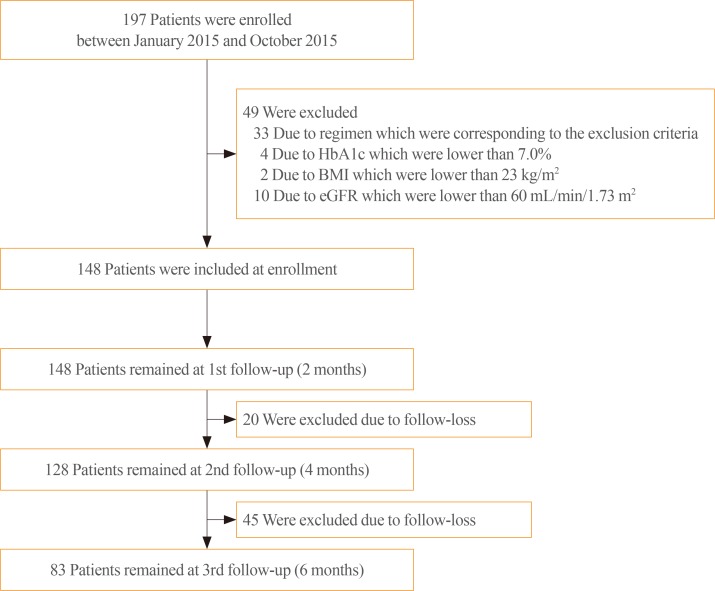
- Initially, we screened patients who received treatment with DAPA for the first time and whose age was between 19 and 70 years. However, patients with an HbA1c level <7.0%, body mass index (BMI) <23 kg/m2, and estimated glomerular filtration rate (eGFR) <60 mL/min/1.73 m2; those who had used more than three different kinds of anti-diabetic medication or insulin or had a regimen that was not indicated by the Korea Health Insurance Review and Assessment Service; those who voluntarily discontinued their treatment with DAPA; and those who were lost to follow-up were excluded (Fig. 1).
- Patients were subdivided into five groups: DAPA added on to MET group, DAPA added on to MET+dipeptidyl peptidase 4 inhibitor (DPP4i) group, DAPA switched from sulfonylurea (SU) group, DAPA switched from DPP4i group, and switched from thiazolidinedione (TZD) group.
- Outcomes
- The primary outcome was the change in fasting plasma glucose (FPG) and HbA1c levels at 6 months follow-up. The secondary outcomes were the change in BP, BMI, waist circumference, lipid profile, eGFR, spot urine albumin level, C-peptide and rate constant for plasma glucose disappearance (Kitt %/min), FPG level, and HbA1c level over time.
- Explanatory variables and outcome measures
- Height (cm) and body weight (kg) were measured to the nearest 0.1 cm and 0.1 kg, respectively, while the participants were barefoot and wearing light clothing. BMI was calculated as weight divided by height squared (kg/m2). Waist circumference was measured to the nearest 0.1 cm at the narrowest point between the lower limit of the ribcage and iliac crest. BP was measured using a mercury sphygmomanometer using the right arm while the participant was in sitting position. Two readings were recorded at an interval of 5 minutes, and the mean value was used.
- After a 14-hour overnight fast, venous blood samples were drawn from the antecubital vein between 7:00 AM and 9:00 AM. Plasma was separated immediately by centrifugation (2,000 rpm, 20 minutes, at 4℃), and biochemical measurements were determined immediately. FPG, total cholesterol, triglyceride, and high density lipoprotein cholesterol (HDL-C) and low density lipoprotein cholesterol (LDL-C) levels were measured enzymatically using the Hitachi 747 chemical analyzer (Hitatchi, Tokyo, Japan). The HbA1c level was determined using a high-performance liquid chromatography method (Variant II, Greencross, Seoul, Korea). Fasting and 2-hour postprandial C-peptide levels were measured using the double-antibody radioimmunoassay (DiaSorin, Stillwater, MN, USA).
- Insulin sensitivity was directly assessed via a short insulin tolerance test (SITT) as Kitt %/min. SITT was performed at 8-hour after overnight fasting. Two intravenous cannulas (one for blood sampling and the other for insulin injection) were utilized. After 15 minutes of rest, venous blood samples were collected at 0, 3, 6, 9, 12, and 15 minutes after an intravenous bolus injection of prediluted regular insulin (Humulin R, Eli Lilly, Indianapolis, IN, USA) at a dose of 0.1 U/kg. Plasma glucose concentrations were immediately determined after sampling using the Beckman Glucose Analyzer II (Beckman Instruments, Fullerton, CA, USA), and Kitt was calculated from the slope of the decrease in the log-transformed plasma glucose values between 3 and 15 minutes.
- Renal function was assessed by eGFR and urine microalbumin level. The eGFR was calculated with Chronic Kidney Disease Epidemiology Collaboration (CKD-EPI) creatinine equation [13].
- Visceral fat thickness (VFT) was measured using a high-resolution ultrasonographic system with a 3.5 MHz convex probe (OGIQ 7, GE, Milwaukee, WI, USA) and was defined as the distance between the anterior wall of the aorta and internal face of the rectoabdominal muscle perpendicular to the aorta.
- Statistical analysis
- All measurements were expressed as mean±standard deviation (SD). Paired Student t test was carried out to compare the changes in characteristics (FPG level, HbA1c level, BP, weight, BMI, waist circumference, lipid profile, eGFR, spot urine albumin level, C-peptide, and rate constant for plasma glucose disappearance) at 6 months follow-up. Repeated measures analysis of variance was carried out to compare the changes of FPG level and HbA1c level over time. The normality was tested using a graphical approach. Results were considered statistically significant when the P value was <0.05. The SPSS for Windows version 24.0 was used for statistical analysis (IBM Co., Armonk, NY, USA).
- Ethical statement
- This clinical trial was in accordance with the Declaration of Helsinki. The trial protocol was reviewed and approved by the Institutional Review Board (IRB) of Kangbuk Samsung Hospital (KBSMC: 2018-08-041-001). The need for patient consent was waived by the IRB since this was a retrospective, chart review study, and analyses were performed using de-identified data.
METHODS
- Selection and baseline characteristics of patients
- Initially, we screened 197 patients who received DAPA for the first time and whose age was between 19 and 70 years (Fig. 1). However, four patients whose HbA1c level was <7.0%, two patients whose BMI was <23 kg/m2, and 10 patients whose eGFR were <60 mL/min/1.73 m2 were excluded. Moreover, 33 patients were not included because they had used more than three different kinds of diabetes medication or insulin or had a regimen that was not indicated by the Korea Health Insurance Review and Assessment Service. Then, 148 patients were included upon enrollment. Among them, 65 had missing data due to loss to follow-up and they were then excluded. Finally, 83 patients were included in the analysis.
- The mean age of the participants was 54.4±9.2 years. Of the participants, 44 (53%) were women, and their mean BMI was 28.3±3.1 kg/m2. The mean fasting glucose level of the participants was 180.5±49.9 mg/dL, and their mean HbA1c level was 8.4%±1.1%.
- All participants had already used MET for their regimen. A total of 10, 12, 13, 11, and 37 patients were included in the add-on to MET, add-on to MET+DPP4i, switched from SU, switched from DPP4i, and switched from TZD groups, respectively.
- Age, BMI, FBG level, HbA1c level, waist circumference, BP, lipid profile, eGFR, fasting C-peptide level, Kitt, VFT, skeletal muscle mass, fat mass, and urine microalbumin level were expressed as mean±SD, and gender was presented as number and percentage (Table 1).
- ΔHbA1c and ΔFPG before and after the administration of DAPA
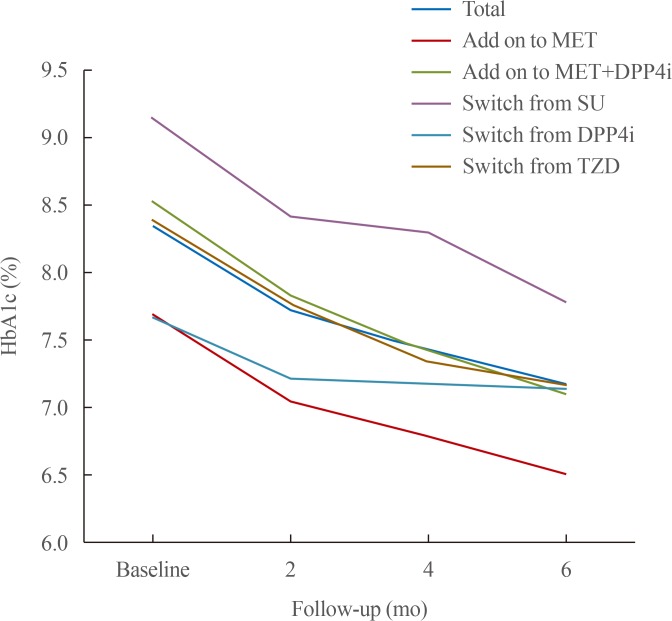
- After the administration of DAPA, the HbA1c level of all the groups significantly decreased by −1.2% at 6 months follow-up, and the add-on to MET+DPP4i and switched from SU groups had the highest decrease in HbA1c level at 1.4% (Table 2). However, after the administration of DAPA, the FPG level of all the groups except the switched from DPP4i group significantly decreased (ΔFPG: −12.4±28.7 mg/dL, P=0.184). The ΔFPG of all the participants was −37.7±44.1 mg/dL (P<0.001). Fig. 2 shows the graphs of the HbA1c changes over time. As time passed, the HbA1c level of all the patients and subgroups continued to decrease gradually.
- Changes in the characteristics of the participants before and after the administration of DAPA
- Some data about the secondary outcomes were missing. The analyses were conducted using only the measured values. Significant decreases in body weight and BMI were observed after the administration of DAPA (−3.1 kg and −1.2 kg/m2, respectively; P<0.001) (Table 3). Table 4 shows weight change by all the patients and subgroups at 6 months follow-up. Moreover, waist circumference, VFT, skeletal muscle mass, and fat mass significantly decreased. After the administration of DAPA, systolic and diastolic blood pressure (SBP and DBP) significantly decreased (−12.5±12.1, P<0.001; and −2.9±11.8, P=0.029, respectively). In terms of lipid profile, only HDL-C level significantly changed (2.1±8.1 mg/dL, P=0.019). Meanwhile, other lipid profiles, including LDL-C level, did not significantly change. After the administration of DAPA, eGFR significantly decreased (−4.0±13.5 mL/min/1.73 m2, P=0.03). In addition, a remarkable decrease in the urine microalbumin level was observed (−23.6±45.9 mg/g, P≤0.001).
- Adverse events
- As this was not a prospective study, the actual number of patients with adverse events could not be accurately determined. However, treatment with DAPA was discontinued in 24 of 197 patients. Discontinuation of the medication was due to poor glucose control (n=7), dehydration with symptoms, such as thirst and lethargy (n=6), genital infection (n=3), recurrence of cystitis (n=1), sarcopenia (n=3), refusal to treatment (n=4), increased appetite (n=1), constipation (n=1), and urinary frequency (n=2), respectively. The differences in the number of adverse events in the different groups were not identified.
RESULTS
- In this study, the treatment outcomes of DAPA in patients at a single primary diabetes clinic were analyzed for an average duration of 6 months. The patients were classified into five groups according to their initial regimen. After the administration of DAPA, significant improvements in HbA1c levels and FPG levels were observed. Furthermore, weight loss, decrease in BP, increase in HDL level, and regression of microalbuminuria were observed after the administration of DAPA.
- Treatment with DAPA for 6 months decreased the mean HbA1c level of the participants from 8.4% to 7.2%. The decrease may be larger than that observed in a previous RCT that included other ethnic groups. Previous RCTs have reported that the decreases of HbA1c were −0.50% to 0.80% from a baseline of 7.90% to 9.20% after the administration of DAPA [1415161718]. The effect of DAPA was affected by baseline HbA1c level and eGFR [19]. Our patients' baseline HbA1c level was not higher than that of previous trials. The relatively better kidney function in our study compared with previous studies might have affected the efficacy of DAPA. In addition, the HbA1c level had decreased linearly over time. Prior real-world evidence studies have shown a similar pattern after the administration of DAPA. [2021]. The decrease in HbA1c level would continue after 6 months. However, owing to the short follow-up period, the efficacy of DAPA after 6 months could not be confirmed.
- Compared to other subgroups, the efficacy of DAPA was the worst in the group switched from DPP4i group among the groups. The change in HbA1c level was statistically significant. However, the difference was smaller than that of other subgroups. Patients who received the greatest glucose-lowering effect with SGLT2i treatment were those with preserved renal function and high baseline HbA1c levels [19]. The baseline HbA1c level of the groups with DAPA switched from DPP4i group was lower than that of other subgroups, which could also relatively affect the minimal decrease in HbA1c level. According to ASSIGN-K study which had examined the efficacy of ipragliflozin, baseline HbA1c level, switching treatment and duration of diabetes were significant factors influencing the change of HbA1c in multiple regression analysis [22]. In the switching groups, patients replaced the previously used drug with DAPA, and the effect of the previous drug was no longer observed. In the DAPA switched from DPP4i group, the disappearance of the effect of DPP4i could relatively affect the minimal decrease in HbA1c level.
- In terms of weight, previous studies have reported a difference of 1.5 to 3 kg from the baseline weight of 80 to 95 kg [7141516172021222324]. In this study, a similar weight change was observed. The patients' lost weight from 76.5 to 73.3 kg, which has a difference of 3.1 kg. According to ASSIGN-K study, higher baseline HbA1c and lower baseline BMI were associated with less weight loss [22]. In this study, similar association was observed. In this study, decrease in weight was the smallest in the switched from SU group and the largest in the switched from DPP4i group. In the DAPA switched from SU group, baseline BMI was the lowest and baseline HbA1c level was the highest. Otherwise, in DAPA switched from DPP4i group, baseline BMI was the highest and baseline HbA1c level was the lowest.
- In this study, both muscle and fat mass decreased. This result was contrary to that of a previous study showing that a decrease in body weight due to treatment with DAPA was primarily the result of decreased fat mass rather than muscle mass [25]. This unfavorable result implies that DAPA should be prescribed cautiously in patients who are at high risk of sarcopenia [26].
- In terms of BP, both SBP and DBP decreased significantly. The difference in SBP was higher than that of previous studies (−3.6 to 6.7 mm Hg from a baseline of 126.0 to 140.5 mm Hg) [71517232427]. Data from real-world evidence studies have shown that the mean change in SBP decreases with time [2128]. Because the follow-up period of this study was 6 months, which is shorter than that of real-world evidence study, the effects of the treatment duration might not be reflected.
- LDL-C is the most powerful determinant of cardiovascular events in patients with type 2 diabetes [29]. Generally, SGLT2is, including DAPA, increase cholesterol levels, including both HDL-C and LDL-C [3031]. In this study, HDL-C level significantly increased, whereas LDL-C level decreased. According to a meta-analysis, although the cause was unclear, an increase in LDL-C level was not observed in individuals receiving DAPA compared with those receiving other SGLT2is [32]. In addition, a report from Japan has shown that LDL level had not changed after the administration of DAPA [33]. Considering that patients with type 2 diabetes in East Asia have traits different from those of Caucasians, DAPA could have been more effective in Asian patients [34].
- In this study, in terms of renal outcome, both albumin level and eGFR decreased after the administration of DAPA. The result was consistent with previous results from large clinical trials and also with the recommendation of the ADA/EASD consensus report [10]. The mechanism for this renoprotective effect of SGLT2is is primarily explained by natriuresis and tubule glomerular feedback [5]. As SGLT2i causes osmotic diuresis and dehydration, the initial decrease in eGFR could be observed, which eventually resolved during the long-term follow-up. By contrast, a decrease in albumin level reflects a decrease in hyperfiltration, which is observed in the initial stages of type 2 diabetes [5]. These renoprotective effects of SGLT2i are assumed to be a class effect, which is consistently observed across all SGLT2i [10].
- The C-peptide level decreased significantly, and this might be secondary to the decrease in FPG level. The change in Kitt was not statistically significant. Although some studies have shown that SGLT2i could be associated with improved insulin resistance, the relationship between SGLT2i and insulin resistance has not been validated [3536]. In this study, Kitt value was only measured in 26.5% of patients. It could be possible that the numbers were extremely small to produce meaningful results.
- The following are the strengths of this study. Data were collected from a primary diabetes clinic in real-world settings. Although the prescription of DAPA is gradually increasing, the efficacy of DAPA in actual clinical settings in Korea is limited. Moreover, although a considerable number of Korean patients with type 2 diabetes were enrolled in CVD-REAL 2, this study was based on the information from the National Health Insurance database, which has some bias regarding the definition of the disease and analytic method [8]. However, the results of our study were based on data obtained from chart reviews in clinical settings. Our study results showed that DAPA effectively reduced plasma glucose level and had good metabolic effect.
- This study also had several limitations. First, this was a retrospective study, and a control group was not included. Second, a small number of patients were included, and several data values were lost. Third, information about concomitant medication, period of diabetes, and side effect of DAPA was limited. Finally, the follow-up period was relatively short that the cardiovascular effect of DAPA could not be evaluated. However, considering that the present study is more likely to prove the efficacy of DAPA in actual clinical settings, the results could provide useful evidence for the Korean population.
- In conclusion, treatment with DAPA was significantly effective in patients with type 2 diabetes in a primary diabetes clinic in Korea (add-on and switched groups). The effect size was similar to or greater than that reported in previous RCTs that included other ethnic groups, indicating that DAPA might be more effective in Korean patients with type 2 diabetes. In addition, the metabolic effect of DAPA was evident, which is similar to the results observed in previous studies. Although the number of participants was small, our study results could provide information regarding the efficacy of DAPA in actual clinical settings, and this helps primary physicians in prescribing DAPA to patients with type 2 diabetes.
DISCUSSION
-
CONFLICTS OF INTEREST: No potential conflict of interest relevant to this article was reported.
-
AUTHOR CONTRIBUTIONS:
Article information
- 1. International Diabetes Federation. Key messages [Internet]; Brussels: IDF; 2019. cited 2019 Feb 5. Available from: http://diabetesatlas.org/key-messages.html.
- 2. Korean Diabetes Association. Diabetes fact sheet in Korea 2018 (ver. English) [Internet]; Seoul: KDA; 2018. cited 2019 Feb 5. Available from: http://www.diabetes.or.kr/pro/news/admin.php?category=A&code=admin&number=1615&mode=view.
- 3. American Diabetes Association. Standards of medical care in diabetes: 2012. Diabetes Care 2012;35(Suppl 1):S11–S63. ArticlePubMed
- 4. Davies MJ, D'Alessio DA, Fradkin J, Kernan WN, Mathieu C, Mingrone G, et al. Management of hyperglycemia in type 2 diabetes, 2018. A consensus report by the American Diabetes Association (ADA) and the European Association for the Study of Diabetes (EASD). Diabetes Care 2018;41:2669–2701. ArticlePubMedPMC
- 5. Heerspink HJ, Perkins BA, Fitchett DH, Husain M, Cherney DZ. Sodium glucose cotransporter 2 inhibitors in the treatment of diabetes mellitus: cardiovascular and kidney effects, potential mechanisms, and clinical applications. Circulation 2016;134:752–772. ArticlePubMed
- 6. Neal B, Perkovic V, Mahaffey KW, de Zeeuw D, Fulcher G, Erondu N, et al. Canagliflozin and cardiovascular and renal events in type 2 diabetes. N Engl J Med 2017;377:644–657. ArticlePubMed
- 7. Zinman B, Wanner C, Lachin JM, Fitchett D, Bluhmki E, Hantel S, et al. Empagliflozin, cardiovascular outcomes, and mortality in type 2 diabetes. N Engl J Med 2015;373:2117–2128. ArticlePubMed
- 8. Kosiborod M, Lam CSP, Kohsaka S, Kim DJ, Karasik A, Shaw J, et al. Cardiovascular events associated with sglt-2 inhibitors versus other glucose-lowering drugs: the CVD-REAL 2 study. J Am Coll Cardiol 2018;71:2628–2639. ArticlePubMed
- 9. Wiviott SD, Raz I, Bonaca MP, Mosenzon O, Kato ET, Cahn A, et al. Dapagliflozin and cardiovascular outcomes in type 2 diabetes. N Engl J Med 2019;380:347–357. ArticlePubMed
- 10. Zelniker TA, Wiviott SD, Raz I, Im K, Goodrich EL, Bonaca MP, et al. SGLT2 inhibitors for primary and secondary prevention of cardiovascular and renal outcomes in type 2 diabetes: a systematic review and meta-analysis of cardiovascular outcome trials. Lancet 2019;393:31–39. ArticlePubMed
- 11. Perrone-Filardi P, Avogaro A, Bonora E, Colivicchi F, Fioretto P, Maggioni AP, et al. Mechanisms linking empagliflozin to cardiovascular and renal protection. Int J Cardiol 2017;241:450–456. ArticlePubMed
- 12. U.S. Food and Drug Administration. FDA warns about rare occurrences of a serious infection of the genital area with SGLT2 inhibitors for diabetes [Internet]; Silver Spring: FDA; 2018. cited 2019 Feb 5. Available from: https://www.fda.gov/Drugs/DrugSafety/ucm617360.htm.
- 13. Levey AS, Stevens LA, Schmid CH, Zhang YL, Castro AF 3rd, Feldman HI, et al. A new equation to estimate glomerular filtration rate. Ann Intern Med 2009;150:604–612. ArticlePubMedPMC
- 14. Bailey CJ, Gross JL, Hennicken D, Iqbal N, Mansfield TA, List JF. Dapagliflozin add-on to metformin in type 2 diabetes inadequately controlled with metformin: a randomized, double-blind, placebo-controlled 102-week trial. BMC Med 2013;11:43ArticlePubMedPMCPDF
- 15. Bailey CJ, Gross JL, Pieters A, Bastien A, List JF. Effect of dapagliflozin in patients with type 2 diabetes who have inadequate glycaemic control with metformin: a randomised, double-blind, placebo-controlled trial. Lancet 2010;375:2223–2233. ArticlePubMed
- 16. Henry RR, Murray AV, Marmolejo MH, Hennicken D, Ptaszynska A, List JF. Dapagliflozin, metformin XR, or both: initial pharmacotherapy for type 2 diabetes, a randomised controlled trial. Int J Clin Pract 2012;66:446–456. ArticlePubMed
- 17. Jabbour SA, Hardy E, Sugg J, Parikh S. Study 10 Group. Dapagliflozin is effective as add-on therapy to sitagliptin with or without metformin: a 24-week, multicenter, randomized, double-blind, placebo-controlled study. Diabetes Care 2014;37:740–750. ArticlePubMed
- 18. Rosenstock J, Vico M, Wei L, Salsali A, List JF. Effects of dapagliflozin, an SGLT2 inhibitor, on HbA(1c), body weight, and hypoglycemia risk in patients with type 2 diabetes inadequately controlled on pioglitazone monotherapy. Diabetes Care 2012;35:1473–1478. ArticlePubMedPMC
- 19. Yagi S, Aihara KI, Kondo T, Kurahashi K, Yoshida S, Endo I, et al. Predictors for the treatment effect of sodium glucose co-transporter 2 inhibitors in patients with type 2 diabetes mellitus. Adv Ther 2018;35:124–134. ArticlePubMedPDF
- 20. Bolinder J, Ljunggren O, Johansson L, Wilding J, Langkilde AM, Sjostrom CD, et al. Dapagliflozin maintains glycaemic control while reducing weight and body fat mass over 2 years in patients with type 2 diabetes mellitus inadequately controlled on metformin. Diabetes Obes Metab 2014;16:159–169. ArticlePubMed
- 21. Wilding J, Bailey C, Rigney U, Blak B, Beekman W, Emmas C. Glycated hemoglobin, body weight and blood pressure in type 2 diabetes patients initiating dapagliflozin treatment in primary care: a retrospective study. Diabetes Ther 2016;7:695–711. ArticlePubMedPMCPDF
- 22. Iemitsu K, Iizuka T, Takihata M, Takai M, Nakajima S, Minami N, et al. Factors influencing changes in hemoglobin a1c and body weight during treatment of type 2 diabetes with ipragliflozin: interim analysis of the ASSIGN-K study. J Clin Med Res 2016;8:373–378. ArticlePubMedPMC
- 23. Ferrannini E, Ramos SJ, Salsali A, Tang W, List JF. Dapagliflozin monotherapy in type 2 diabetic patients with inadequate glycemic control by diet and exercise: a randomized, double-blind, placebo-controlled, phase 3 trial. Diabetes Care 2010;33:2217–2224. ArticlePubMedPMC
- 24. Matthaei S, Bowering K, Rohwedder K, Grohl A, Parikh S. Study 05 Group. Dapagliflozin improves glycemic control and reduces body weight as add-on therapy to metformin plus sulfonylurea: a 24-week randomized, double-blind clinical trial. Diabetes Care 2015;38:365–372. ArticlePubMed
- 25. Strojek K, Yoon KH, Hruba V, Elze M, Langkilde AM, Parikh S. Effect of dapagliflozin in patients with type 2 diabetes who have inadequate glycaemic control with glimepiride: a randomized, 24-week, double-blind, placebo-controlled trial. Diabetes Obes Metab 2011;13:928–938. ArticlePubMed
- 26. Sugiyama S, Jinnouchi H, Kurinami N, Hieshima K, Yoshida A, Jinnouchi K, et al. Dapagliflozin reduces fat mass without affecting muscle mass in type 2 diabetes. J Atheroscler Thromb 2018;25:467–476. ArticlePubMedPMC
- 27. Bouchi R, Terashima M, Sasahara Y, Asakawa M, Fukuda T, Takeuchi T, et al. Luseogliflozin reduces epicardial fat accumulation in patients with type 2 diabetes: a pilot study. Cardiovasc Diabetol 2017;16:32ArticlePubMedPMCPDF
- 28. Scheerer MF, Rist R, Proske O, Meng A, Kostev K. Changes in HbA1c, body weight, and systolic blood pressure in type 2 diabetes patients initiating dapagliflozin therapy: a primary care database study. Diabetes Metab Syndr Obes 2016;9:337–345. ArticlePubMedPMC
- 29. Turner RC, Millns H, Neil HA, Stratton IM, Manley SE, Matthews DR, et al. Risk factors for coronary artery disease in non-insulin dependent diabetes mellitus: United Kingdom Prospective Diabetes Study (UKPDS: 23). BMJ 1998;316:823–828. ArticlePubMedPMC
- 30. Cherney DZI, Cooper ME, Tikkanen I, Pfarr E, Johansen OE, Woerle HJ, et al. Pooled analysis of phase III trials indicate contrasting influences of renal function on blood pressure, body weight, and HbA1c reductions with empagliflozin. Kidney Int 2018;93:231–244. ArticlePubMed
- 31. Ptaszynska A, Hardy E, Johnsson E, Parikh S, List J. Effects of dapagliflozin on cardiovascular risk factors. Postgrad Med 2013;125:181–189.Article
- 32. Storgaard H, Gluud LL, Bennett C, Grondahl MF, Christensen MB, Knop FK, et al. Benefits and harms of sodium-glucose co-transporter 2 inhibitors in patients with type 2 diabetes: a systematic review and meta-analysis. PLoS One 2016;11:e0166125. ArticlePubMedPMC
- 33. Kaku K, Kiyosue A, Inoue S, Ueda N, Tokudome T, Yang J, et al. Efficacy and safety of dapagliflozin monotherapy in Japanese patients with type 2 diabetes inadequately controlled by diet and exercise. Diabetes Obes Metab 2014;16:1102–1110. ArticlePubMed
- 34. Yabe D, Seino Y, Fukushima M, Seino S. β Cell dysfunction versus insulin resistance in the pathogenesis of type 2 diabetes in East Asians. Curr Diab Rep 2015;15:602ArticlePubMedPDF
- 35. Merovci A, Mari A, Solis-Herrera C, Xiong J, Daniele G, Chavez-Velazquez A, et al. Dapagliflozin lowers plasma glucose concentration and improves β-cell function. J Clin Endocrinol Metab 2015;100:1927–1932. ArticlePubMedPMC
- 36. Merovci A, Solis-Herrera C, Daniele G, Eldor R, Fiorentino TV, Tripathy D, et al. Dapagliflozin improves muscle insulin sensitivity but enhances endogenous glucose production. J Clin Invest 2014;124:509–514. ArticlePubMedPMC
References
Flow chart of the selection of the study population. HbA1c, glycosylated hemoglobin; BMI, body mass index; eGFR, estimated glomerular filtration rate.
Changes in glycosylated hemoglobin (HbA1c) level in all patients and in the subgroups at 6 months follow-up. Repeated measures analysis of variance was used to test the significant difference (P<0.05). MET, metformin; DPP4i, dipeptidyl peptidase 4 inhibitor; SU, sulfonylurea; TZD, thiazolidinedione.

Baseline Characteristics of the Participants
Values are expressed as mean±SD or number (%).
MET, metformin; DPP4i, dipeptidyl peptidase 4 inhibitor; SU, sulfonylurea; TZD, thiazolidinedione; BMI, body mass index; WC, waist circumference; SBP, systolic blood pressure; DBP, diastolic blood pressure; FBG, fasting blood glucose; HbA1c, glycosylated hemoglobin; TC, total cholesterol; HDL-C, high density lipoprotein cholesterol; LDL-C, low density lipoprotein cholesterol; eGFR, estimated glomerular filtration rate.
Effects of Dapagliflozin on the Fasting Plasma Glucose Levels and HbA1c Level from Baseline to 6 Months
Values are expressed as mean±SD.
HbA1c, glycosylated hemoglobin; FPG, fasting plasma glucose; MET, metformin; DPP4i, dipeptidyl peptidase 4 inhibitor; SU, sulfonylurea; TZD, thiazolidinedione; oGLD, other glucose lowering drug.
aPaired Student t test was used to test the significant difference (P<0.05); bMET→MET+dapagliflozin (DAPA); cMET+DPP4→MET+DPP4+DAPA; dMET+SU±oGLD→MET+DAPA±oGLD; eMET+DPP4±oGLD→MET+DAPA±oGLD; fMET+TZD±oGLD→MET+DAPA±oGLD.
Changes in Other Patient Characteristics at 6 Months Follow-up
Values are expressed as mean±SD.
BMI, body mass index; WC, waist circumference; SBP, systolic blood pressure; DBP, diastolic blood pressure; TC, total cholesterol; HDL-C, high density lipoprotein cholesterol; LDL-C, low density lipoprotein cholesterol; eGFR, estimated glomerular filtration rate.
aPaired Student t test was used to test the significant difference (P<0.05).
Changes of Weight in All Patients and in the Subgroups at 6 Months Follow-up
Values are expressed as mean±SD.
MET, metformin; DPP4i, dipeptidyl peptidase 4 inhibitor; SU, sulfonylurea; TZD, thiazolidinedione; oGLD, other glucose lowering drug.
aPaired Student t test was used to test the significant difference (P<0.05); bMET→MET+dapagliflozin (DAPA); cMET+DPP4→MET+DPP4+DAPA; dMET+SU±oGLD→MET+DAPA±oGLD; eMET+DPP4±oGLD→MET+DAPA±oGLD; fMET+TZD±oGLD→MET+DAPA±oGLD.
Figure & Data
References
Citations
- The sodium glucose co-transporter 2 inhibitor dapagliflozin ameliorates the fluid-retaining effect of the endothelin A receptor antagonist zibotentan
Vandana Veenit, Hiddo J L Heerspink, Christine Ahlström, Peter J Greasley, Stanko Skritic, Natalie van Zuydam, Donald E Kohan, Pernille B L Hansen, Robert I Menzies
Nephrology Dialysis Transplantation.2023; 38(10): 2289. CrossRef
 PubReader
 ePub Link
 Cite
Cite