Rebound Feeding in the Wake of Short-Term Suspension of Food Intake Differs in the Presence of Estrous Cycle Peak versus Nadir Levels of Estradiol
Article information

Abstract
Background
Short-term interruption of feeding is ordinary in modern life but negatively impacts appetite control and body weight. Estradiol (E) imposes long-term inhibitory tonus on food consumption; however, E influence on energy repletion secondary to food deprivation (FD) is unclear. This study investigated the hypothesis that E signal strength regulates hyperphagic responses to FD of varying duration.
Methods
Ovariectomized female rats were implanted with E-containing silastic capsules (30 [E-30] or 300 µg [E-300]/mL) to replicate plasma concentrations at cycle nadir versus peak levels.
Results
Data show that food intake was increased equally in E-30 and E-300 rats after 12 hours of food deprivation (FD-12); yet, FD of 18 hours (FD-18) amplified refeeding by E-300 versus E-30. Caudal fourth ventricular administration of the 5′-monophosphate-activated protein kinase (AMPK) inhibitor compound C (Cc) did not modify FD-induced hyperphagia in E-30 (regardless of FD interval) or E-300 animals exposed to FD-12, but diminished refeeding after FD-18 in E-300 rats. Cc-reversible hyperglycemia occurred in refed FD-18 groups. Serum insulin was resistant to FD-12 plus refeeding, but was elevated by AMPK-dependent mechanisms in refed E-300 FD-18 rats; equivalent Cc-insensitive decrements in circulating leptin occurred in all FD groups.
Conclusion
Current results show that estrous cycle peak, but not baseline, E levels engage hindbrain AMPK signaling to intensify hyperphagia in response to prolongation of FD. Observations of hindbrain AMPK-dependent hyperglycemia, alongside elevated insulin secretion, in refed rats exposed to FD-18 implicate this sensor in insulin resistance mechanisms of glucose partitioning in response to this metabolic imbalance.
INTRODUCTION
The ovarian steroid hormone estradiol (E) regulates metabolic balance in female mammals via central and peripheral mechanisms that govern energy procurement, ingestion, metabolism, partitioning, storage, and expenditure [1]. Short-term abstinence from food intake, planned or unplanned, is unavoidable in modern life, but is negatively correlated with appetite control and obesity [23]. Our ongoing research aims to clarify the role of E in rebound feeding and energy storage secondary to interrupted consumption. We developed a 12-hour food deprivation (FD) paradigm that differs from the usual experimental practice of removing food for much longer periods, e.g., 1 day or more, but has physiological relevance to planned (dieting) or unplanned (meal delay) short-term food abstinences. We reported that E limits acute refeeding by ovariectomized (OVX) adult female rats after limited (12 hours) interruption of feeding (FD), but allows differential, i.e. intensified hyperphagia when FD coincides with hindbrain energy depletion, mimicked by caudal fourth ventricular (CV4) administration of the 5′-monophosphate-activated protein kinase (AMPK) activator 5-aminoimidazole-4-carboxamide-riboside (AICAR) [4]. These results suggest that E may enable discriminating feeding responses to discernibly distinct states of metabolic instability.
The ultrasensitive, evolutionarily-conserved energy sensor AMPK provides crucial input on brain cell adenosine triphosphate (ATP) availability to neural networks that safeguard systemic energy stability. This gauge is activated by phosphorylation in response to metabolic stressors that increase the intracellular adenosine monophosphate (AMP)/ATP ratio [56]. Phosphorylated AMPK (pAMPK) inhibits ATP-consuming biosynthetic pathways, while augmenting ATP-producing metabolic functions including fatty acid oxidation. AMPK is expressed in hypothalamic and hindbrain components of the widespread brain metabolic regulatory network. Caudal dorsomedial hindbrain AMPK regulates feeding [78] and circulating glucose and counter-regulatory hormone concentrations [9]. E acts on dorsal vagal complex (DVC) substrates to restrict feeding [10]. Evidence that caudal DVC (cDVC) A2 noradrenergic neurons express estrogen receptor-α (ERα) and -β (ERβ) proteins [9] and metabolo-sensory biomarkers, e.g., glucokinase, KATP, and AMPK [91112] suggests that these cells function as substrates for estrogenic input to neural pathways that control energy homeostasis. Indeed, E regulates A2 nerve cell Fos and pAMPK protein expression following CV4 administration of the AMP mimic AICAR [9]. In E, but not oil-implanted OVX rats, FD diminished cDVC AMPK activity relative to ad libitum controls, but combinatory FD and CV4 AICAR treatment increased cDVC pAMPK content. These divergent adjustments in sensor activation imply that neuro-protective, E-enabled energy-stabilizing activities elicited by mild/moderate metabolic imbalance may be insufficient to assuage energy deficits due to more severe metabolic dyshomeostasis [4].
In ovary-intact female rat, E secretion fluctuates over the 4-day estrous cycle with circulating hormone levels gradually increasing 4- to 5-fold from baseline (metestrus) to peak concentrations on proestrus afternoon prior to the luteinizing hormone (LH) pre-ovulatory surge [1314]. Circadian-driven food intake during the daily dark-phase varies over the estrous cycle, declining during the proestrus evening after the LH surge (the night of ovulation and behavioral estrus) [1516], whereas light-phase consumption is relatively constant over the cycle [17]. The present studies investigated the hypothesis that stage-specific patterns of E output over the rat estrous cycle exert differential effects on hyperphagic responses to energy imbalance. OVX female rats were implanted with E-containing silastic capsules designed to reproduce circulating E levels at cycle nadir versus peak concentrations [1418] prior to exposure to 12 hours of food deprivation (FD-12) or 18 hours (FD-18) duration. We assessed effects of CV4 administration of the AMPK inhibitor compound C (Cc) on refeeding to examine the role of hindbrain AMPK in E-dependent feeding responses to FD. Application of microlaser technology to optical systems provides an unparalleled means for selective procurement of pure nerve cell populations from native tissue environment for gene and/or protein expression analysis. Here, pure A2 nerve cell samples were obtained by single-cell laser-catapult microdissection for protein analysis by high-sensitivity Western blotting in order to determine if differential physiological patterns of E output in the female rat regulate A2 nerve cell AMPK, pAMPK, and dopamine-β-hydroxylase (DβH) protein responses to FD of varying duration.
Our previous studies showed that serum levels of the energy deficit-sensitive hormones leptin and insulin were correspondingly decreased or unaffected by FD-12 duration in OVX rats replaced with baseline E levels [19]. It is well documented that both hormones impose critical physiological restraint on food intake [202122]. The current work examined the premise that leptin and insulin secretory responses to rebound feeding after FD-12 versus FD-18 vary according to E concentration and, moreover, are governed by caudal dorsomedial hindbrain AMPK.
METHODS
Animals
Adult female Sprague Dawley rats (200 to 260 g body weight) were maintained under a 14 hour-light/10 hour-dark lighting schedule (light on at 7:00 AM), and allowed free access to standard laboratory rat chow (Harlan Teklad LM-485, Harlan Industries, Madison, WI, USA) and tap water. Rats were acclimated to daily handing over a 7-day period prior to experimentation. All protocols were conducted in accordance with National Institutes of Health guidelines for care and use of laboratory animals, with approval by the University of Louisiana Monroe Institutional Animal Care and Use Committee (11FEB-KPB-01).
Experimental design
On day 1, after induction of anesthesia with ketamine/xylazine (0.1 mL/100 g body weight intraperitoneal; 90 mg ketamine: 10 mg xylazine/mL; Henry Schein Inc., Melville, NY, USA), rats were implanted with a PE 20 polyethylene cannula aimed at the CV4 (coordinates: 6.6 mm ventral to skull surface; 0 mm lateral to midline; 13.3 mm posterior to bregma) and bilaterally OVX. After surgery, animals were transferred to individual cages. On day 7, animals were anesthetized with isoflurane prior to implantation of a subcutaneous capsule (10 mm/100 g body weight; 0.062 inches inner-diameter/0.125 inches outer-diameter) filled with 30 (E-30) or 300 (E-300) µg E/mL safflower oil. Our studies [18] show that these disparate E doses yield circulating hormone levels that correspond to plasma E levels measured on metestrus or proestrus, respectively, in ovary-intact female rats [13]. For FD-12, groups of E-30 or E-300 rats were assigned as (1) full-fed (FF) plus CV4 administration of the vehicle (V) dimethyl sulfoxide (DMSO) at time zero (to; 9:00 AM) on day 11 (n=6/group); (2) FD (initiated at 9:00 PM on day 10) plus CV4 V injection at 9:00 AM on day 11 (n=6/group); or (3) FD plus CV4 injection of Cc (5.0 µg/2.0 µL DMSO) at 9:00 AM on day 11 (n=6/group). Food intake was measured between 9:00 AM and 10:00 AM. For FD-18, separate groups of E-30 or E-300 animals were treated as described (e.g., FF+V, FD+V, and FD+Cc; n=6/group), except that intra-CV4 delivery of V or Cc was carried out at 3:00 PM and food intake was assessed between 3:00 PM and 4:00 PM. Animals were sacrificed at the conclusion of each 1 hour refeeding period for brain and trunk blood collection.
Western blot analysis of laser-catapult microdissected cDVC A2 noradrenergic neurons
Serial 10 µm-thick frozen sections were cut from the cDVC between −14.36 to −14.86 mm posterior to bregma, and mounted on polyethylene naphthalate membrane slides (Carl Zeiss MicroImaging Inc., Thornwood, NY, USA). After acetone fixation and blocking with 5% normal horse serum (Vectastain Elite ABC mouse IgG kit, Vector Laboratories Inc., Burlingame, CA, USA), tissues were incubated for 24 hours at 4℃ with mouse monoclonal primary antibody against tyrosine hydroxylase (TH) (prod. no. 22941, 1:1,000; ImmunoStar Inc., Hudson, WI, USA). Sections were sequentially incubated with Vectastain IgG Elite ABC mouse IgG kit biotinylated secondary antibody, ABC reagent, and Vector DAB kit reagents (Vector Laboratories) to visualize TH-immunoreactive (-ir) neurons. Individual TH-ir cells exhibiting a visible nucleus and complete labeling of the cytoplasmic compartment were harvested with a Zeiss P.A.L.M. UV-A microlaser (Carl Zeiss MicroImaging). For each protein of interest, a minimum of three separate pools of 50 TH-ir neurons per treatment group were collected into tissue lysis buffer (2% sodium dodecyl sulfate, 0.05 M dithiothreitol, 10% glycerol, 1 mM EDTA, 60 mM Tris HCl, pH 7.2). Denatured A2 nerve cell proteins were electrophoresed in 4% to 20% gradient Tris-glycine gels and transblotted to 0.45-µm polyvinylidene fluoride membranes. Membranes were pretreated with Quentix Western blot signal enhancer (Thermo Fisher Scientific, Rockford, IL, USA), then were blocked with 0.1% Tween-20 and 2% bovine serum albumin prior to overnight incubation at 4℃ with primary antisera rabbit anti-AMPKα1/2 (H-300), 1:500 (prod. no. sc-25792, Santa Cruz Biotechnology Inc., Santa Cruz, CA); rabbit anti-pAMPKα1/2 phospho (Thr172), 1:500 (prod. no. sc-33524, Santa Cruz Biotechnology Inc.); rabbit anti-DβH (H-213), 1:500 (prod. no. sc-15318, Santa Cruz Biotechnology Inc.); or mouse anti-α-tubulin, 1:1,000 (prod. no. CP06, Calbiochem, Gibbstown, NJ, USA) diluted in appropriate blocking solution. Membranes were subsequently incubated with peroxidase-conjugated goat anti-mouse (1:5,000; prod. no. NEF 822001EA, Perkin Elmer, Boston, MA, USA) or goat anti-rabbit (1:5,000; NEF812001EA, Perkin Elmer) secondary antisera, followed by SuperSignal West Femto Maximum Sensitivity substrate (prod. no. 34096, Thermo Fisher Scientific, Waltham, MA, USA). Protein band chemiluminesence imaging and densitometric analysis were performed using a Syngene G:Box Chemi and Genetool 4.01 software (Syngene, Frederick, MD, USA). Protein optical density measures were normalized to α-tubulin. Protein molecular weight markers were included in each analysis. Each protein was analyzed in triplicate at minimum. Each primary antiserum detected a single band protein as illustrated on representative blots.
Measurement of food intake
On day 8 to 10, animals were customized to the presence of laboratory chow-containing food jars inside their home cages and with regular removal of those jars for weighing. On day 11, immediately after intra-CV4 V or Cc injection, pre-weighed jars containing chow were placed in each cage and food intake over an ensuing 1 hour period was quantified. Consumption was determined as the difference between to and +1 hour chow weights after adjustment for weight of crumbs on underlying paper [23].
Glucose and hormone analyses
Blood glucose levels were measured using an AccuCheck Aviva-Plus glucometer (Roche Diagnostics, Indianapolis, IN, USA) [24]. Serum insulin and leptin concentrations were analyzed using EMD Millipore Rat/Mouse Insulin (prod. no. EZRMI-13K) and Rat Leptin (prod. no. EZRL-83K) enzyme-linked immunosorbent assay kit reagents. The insulin assay was characterized by sensitivity of 0.1 ng/mL, with intra- and inter-assay coefficients of variation (CV) 3.22% and 6.95%, respectively. Leptin assay sensitivity was 0.08 ng/mL; intra- and extra-assay CVs were 2.49% and 3.93%.
Statistical analyses
Measures of mean food intake, A2 nerve cell protein profiles, and circulating glucose and hormone concentrations were evaluated among FD-12 or FD-18 treatment groups by two-way analysis of variance and Duncan's multiple range post hoc test. Differences of P<0.05 were considered significant.
RESULTS
Fig. 1 depicts effects of FD-12 or FD-18 duration on food intake in E-30 versus E-300 animals. Data show that FD-12 increased food intake to an equivalent extent in E-30 and E-300 animals. These hyperphagic responses were not abolished by intra-CV4 administration of Cc. Exposure to FD-18 also increased feeding in E-30 and E-300 rats, but consumption was comparatively greater in the latter group statistically. Fig. 2 illustrates effects of Cc treatment on glycemic responses to FD-12 versus FD-18. Blood glucose levels were unchanged after exposure to FD-12, whereas FD-18 caused a Cc-reversible increase in circulating glucose in both E-30 and E-300 animals. Serum leptin levels were suppressed to an equal degree by FD-12 versus FD-18 (Fig. 3); this FD-induced decline was refractory to Cc. As shown in Fig. 4, FD-12 did not significantly modify circulating insulin levels in E-30 or E-300, but Cc reduced serum insulin in E-300 rats exposed to FD-12. Both E-30 and E-300 animals exhibited augmented insulin concentrations owing to FD-18, but this stimulatory response to this FD paradigm was reversed by Cc only in E-300 animals.

Effects of caudal fourth ventricular (CV4) administration of the adenosine 5′-monophosphate-activated protein kinase inhibitor compound C (Cc) on refeeding by estradiol (E)-treated ovariectomized (OVX) female rats after variable-length food deprivation (FD). Animals were exposed to FD (food was withdrawn at 9:00 PM) over a period of 12 (FD-12) or 18 (FD-18) hours, then injected into the CV4 with the vehicle (V; horizontal bars) or Cc (5.0 µg/2.0 µL DMSO; cross-hatched bars) prior to assessment of rebound feeding over a one hour period. Full-fed (FF; open bars) were treated by intra-CV4 V injection. Bars on the left side of the graph depict mean weight of consumed food±standard error of the mean after FD-12 by groups of 30 (E-30) or 300 (E-300) µg E/mL-implanted OVX rats treated by FF/V, FD/V, or FD/Cc (n=6 rats/group). On the right-hand side of the graph, bars show mean intake±SEM after FD-18 by groups of 30 (E-30) or 300 (E-300) µg E/mL-implanted OVX rats treated by FF/V, FD/V, or FD/Cc (n=6 rats/group). aP<0.05 vs. FF; bP<0.05 vs. FD+V; cP<E-30 FF+V.

Effects of compound C (Cc) on glycemic responses to refeeding by groups of 30 (E-30) or 300 (E-300) rats. Animals were exposed to 12 hours of food deprivation (FD-12; left side of graph) or 18 hours of food deprivation (FD-18; right side of graph) were injected into the caudal fourth ventricular (CV4) with vehicle (V; horizontal bars) or Cc (cross-hatched bars) before analysis of blood glucose at the conclusion of a 1 hour refeeding period. Full-fed (FF; open bars) were injected into the CV4 with V. On the left, bars show mean circulating glucose levels±standard error of the mean after refeeding by FF-12/V, FD-12/V, or FD-12/Cc groups of E-30 or E-300 rats (n=6 rats/group). Bars on the right illustrate mean blood glucose values±SEM after refeeding by groups of FF-18/V, FD-18/V, or FD-18/Cc E-30 or E-300 rats (n=6 rats/group). aP<0.05 vs. FF; bP<0.05 vs. FD+V.

Effects of compound C (Cc) on serum leptin concentrations in refed groups of 30 (E-30) or 300 (E-300) rats. Bars depict mean serum leptin levels±SEM 1 hour after refeeding in the following groups: left-hand side of graph: full-fed (FF)-12/vehicle (V; open bars), 12 hours of food deprivation (FD-12)/V (horizontal bars), or FD-12/Cc (cross-hatched bars) groups of E-30 or E-300 rats (n=6 rats/group); and right-hand side of graph: FF-18/V (open bars), 18 hours of food deprivation (FD-18)/V (horizontal bars), or FD-18/Cc (cross-hatched bars) E-30 or E-300 rats (n=6 rats/group). aP<0.05 vs. FF.

Effects of compound C (Cc) on serum insulin levels in refed groups of 30 (E-30) or 300 (E-300) rats. Bars depict mean serum insulin concentrations levels±SEM 1 hour after refeeding in the following groups: left-hand side of graph: full-fed (FF)-12/vehicle (V), 12 hours of food deprivation (FD-12)/V, or FD-12/Cc groups of E-30 or E-300 rats (n=6 rats/group); and right-hand side of graph: FF-18/V, 18 hours of food deprivation (FD-18)/V, or FD-18/Cc groups of E-30 or E-300 rats (n=6 rats/group). aP<0.05 vs. FF; bP<0.05 vs. FD+V.
Data in Fig. 5 illustrate effect of FD on A2 nerve cell AMPK, pAMPK, and DβH protein expression in E-30 versus E-300 rats. Data show that FD-12 did not alter A2 AMPK protein profiles (Fig. 5A). As shown in Fig. 5B, A2 pAMPK expression was significantly increased by FD-12 in E-300, but not E-30 animals; this positive response was abolished by Cc administration. In E-300, FD-18 did not further augment pAMPK levels relative to FF, but this protein was decreased in FD animals by Cc. A2 DβH protein levels were higher in FF E-300 sacrificed at 4:00 PM versus animals sacrificed earlier at 10:00 AM. This protein profile was refractory to FD, regardless of duration, in the presence of absence of Cc.
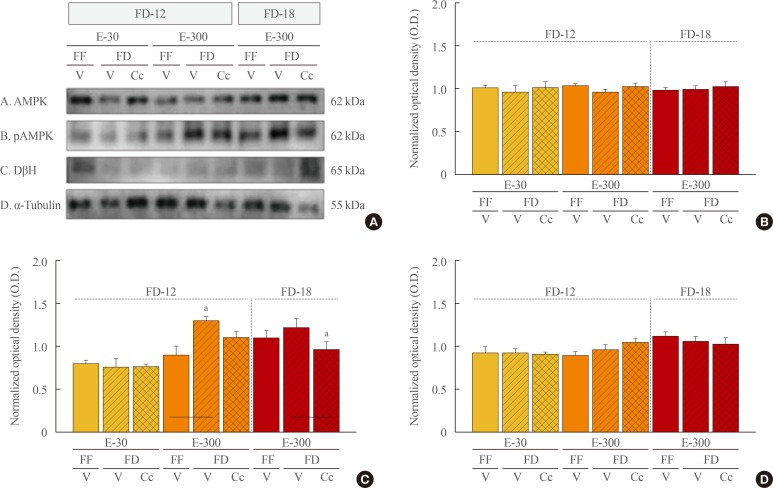
Effects of caudal fourth ventricular compound C (Cc) administration on hindbrain A2 nerve cell 5′-monophosphate-activated protein kinase (AMPK), phosphorylated AMPK (pAMPK), and dopamine-β-hydroxylase (DβH) protein responses to 12 hours of food deprivation (FD-12) or 18 hours (FD-18) in groups of 30 (E-30) or 300 (E-300) rats. (A) It depicts representative immunoblots of A2 AMPK (row A), pAMPK (row B), DβH (row C), and α-tubulin (row D). (B, C, D) These respectively illustrate mean optical density (O.D.) measures±SEM for A2 AMPK, pAMPK, and DβH protein profiles in groups of E-30 and E-300 animals exposed to FD-12 (left side of each graph) or FD-18 (right side of each graph) with or without Cc treatment. FF, full-fed; V, vehicle. aP<0.05 vs. FD-V.
DISCUSSION
Short-term abstinence from food intake, planned or unplanned, is an inevitable feature of modern life, but is negatively correlated with appetite control and obesity. The current study examined the impact of E on rebound feeding secondary to short-term interrupted consumption. In order to mimic the physiological context of meal omission(s) within a single day, our current design involved suspension of feeding for a period of 12 or 18 hours, beginning 2 hours after lights off. As elevation of E secretion from tonic baseline to mid-cyclic peak release is associated with reduced spontaneous feeding in ovary-intact female rats, we investigated here whether opposing extremes of hormone output over the estrous cycle differentially regulate refeeding in one or both short-term FD paradigms. Results show that E replacement at estrous cycle nadir versus maximum levels promoted equivalent increases in feeding following FD-12. FD-18 further amplified hyperphagia in high E dose-treated rats, by mechanisms reliant on caudal dorsomedial hindbrain AMPK. Insulin secretion was elevated at the conclusion of FD-18 (but not FD-12)-associated refeeding regardless of E dosage, but was positively regulated by hindbrain AMPK in E-300 animals exposed to FD of either extent. Serum leptin levels remained suppressed to an equivalent extent (and were refractory to Cc) in E-30 and E-300 rats despite rebound consumption. Current studies reveal that physiological peak E concentrations engage caudal dorsomedial hindbrain AMPK to amplify refeeding and associated insulin release in response to extended metabolic deprivation stress. Sensor-mediated up-regulation of systemic glycemic profiles in response to prolonged FD-induced rebound food intake may reflect, in part, hindbrain sensor-dependent development of insulin resistance for neuroprotective partitioning of glucose for brain utilization during extended FD.
In light of well-documented long-term inhibitory effects of E on food intake [1625], we did not foresee the present paradoxical finding that rebound consumption was amplified by extension of FD-12 to FD-18 in the presence of peak, but not nadir E levels. One explanation of these data is that E-300 rats eat more than E-30 after FD-18 because of greater energy deficiency. Studies analyzing energy balance over the rat estrous cycle indicate that fluctuations in whole-body energy state correlate with E secretion [26]. Net energy equilibrium shifts from positive imbalance (diestrus) to a balanced/slightly negative state (estrus) during escalation of E release from baseline to maximal. This amplified hormone signal inhibits food intake on proestrus evening despite a decline in caloric excess on that day; yet, the extent of this diminished consumption is likely mitigated by signals of decreased positivity of energy state. Thus, a relative lack of surplus bodily energy associated with elevated E may likely enhance vulnerability to negative metabolic imbalance, particularly when FD is extended to 18 hours. However, this premise remains speculative as we did not perform analyses of energy expenditure, fuel mobilization, and physical activity here. Yet, E improves cellular-level energy state by stimulating glucose transport, glycolysis, and mitochondrial oxidative respiration [27]; it is unclear if the extent of such beneficial effects increases in proportion to circulating E. Evidence for comparable hyperphagia in E-30 and E-300 rats after FD-12 supports the likelihood that energy balance may be similarly affected in these groups; ongoing work aims to determine if and how systemic and cellular energy state may change over a 6-hour period beyond FD-12 in the presence of peak versus baseline E.
An alternate explanation of augmented hyperphagia in E-300 versus E-30 animals after FD-18 relates to coincident timing of rebound feeding between 3:00 PM and 4:00 PM with unique feedback actions of peak E on the female brain within the same time frame. The proestrus rise in E causes positive-feedback stimulation of gonadotropin-releasing hormone (GnRH) output to the anterior pituitary, which produces the pre-ovulatory LH surge. The female neural network that controls GnRH generates a daily circadian clock-entrained stimulus for increased neuropeptide release in reaction to elevated E [28293031], which precisely times the LH surge between 2:00 PM and 4:00 PM [32]. Several orexigenic neurotransmitters function within this high E-sensitive circuitry, including neuropeptide Y (NPY) and galanin (GAL) [333435]. We posit that steroid positive-feedback activation of these pro-appetite neurochemical systems may heighten the drive to eat when food is presented at 3:00 PM, even if effects of FD-18 on energy state are similar in E-300 and E-30 rats. If, on the other hand, FD-18 causes greater negative energy imbalance in E-300 animals, E-sensitive orexigenic neurotransmitter signaling may be further amplified, and thus promote augmented rebound consumption. Both of these scenarios are predicated upon the assumption that positive-feedback–sensitive orexigenic neurochemical function as a common element in networks controlling reproductive neuroendocrine function and feeding behavior. Leptin inhibits orexigenic peptide, e.g., NPY- and GAL-induced feeding [3637]; here, similarity in serum leptin decrements in different E dosage groups exposed to FD-18 argues against a role for this hormone in dissimilar magnitude of refeeding by E-300 versus E-30 rats.
Present data establish a role for caudal dorsomedial hindbrain AMPK in heightened hyperphagia in E-300 rats exposed to FD-18, as well as hyperinsulinemia in E-300 animals engaged in refeeding after FD-12 or FD-18. These results imply that hindbrain AMPK input to neural circuits that control nutrient acquisition versus substrate fuel utilization is not pervasive, but suggest instead that sensor connectivity to ingestion behavior networks may be contingent on magnitude of metabolic stress imposed upon E concentration-dependent energy state. Current findings raise the question of whether hindbrain AMPK input to pathways governing specific behavioral and endocrine reactions to metabolic imbalance may be controlled by distinct thresholds of sensor activation. Blood glucose levels were significantly elevated by AMPK-dependent mechanisms, along increased insulin secretion, in refed animals exposed to FD-18, but not FD-12, irrespective of E dosage. These data suggest that prolonged FD (e.g., exceeding 12 hours) may promote insulin resistance, a response that can be plausibly viewed as a protective mechanism for diversion of glucose to the brain during negative energy balance [38]. Observed augmentation of circulating glucose was similar in refed E-30 versus E-300 animals, despite differences in food consumed; further work is needed to determine if degree of putative insulin resistance is comparable between these groups.
Current data show that FD-12 increased A2 pAMPK in E-300, but not E-30 animals, confirming previous reports that A2 pAMPK expression is refractory to FD-12 in the presence of nadir E levels [19]. Results moreover indicate that FD-12 augmentation of pAMPK protein was abolished by Cc. This observation implicates A2 sensor regulation of circulating insulin in E-300 rats exposed to FD-12 as well as circulating glucose in E-300 animals exposed to FD-18. While A2 pAMPK profiles were not directly compared between E-300 animals exposed to FD-12 versus FD-18, these protein profiles appeared to be analogous. The shorter FD paradigm caused a significant rise in pAMPK protein relative to FF controls. We speculate that FD-18 effects on this protein may have been obscured by the evident increase in baseline pAMPK expression in FF animals sacrificed at 4:00 PM versus 10:00 PM. A2 DβH protein was refractory to FD unpaired/paired with Cc. If the working premise that modified DβH expression is an accurate indirect reflection of altered norepinephrine (NE) signaling is correct, current data would imply that A2 cells do not convey hindbrain AMPK-initiated signals to networks regulating E-300 rat hyperphagic and glycemic responses to FD-18. As NE is co-expressed with other neurotransmitters, including NPY, neurotensin, and dynorphin, it is plausible that A2 neurons may communicate FD effects via non-noradrenergic stimuli. An alternative prospect is that alongside DβH protein insensitivity, FD-18 may control hindbrain AMPK-driven A2 NE signaling by control of NE metabolism, breakdown, and/or release within projection sites.
The continuum of growth and development over the female lifespan involves transition between distinct reproductive states, including juvenile quiescence, fecundity, and reproductive senescence, that exhibit unique patterns of ovarian E secretion. Long-term goals of our research include clarification of distinguishing features of diverse physiological patterns of E secretion, including low prepubertal estrogen secretion, dynamic fluctuation over the estrous/menstrual cycle, elevated ovarian hormone release during pregnancy, and significant decline in hormone output during old age on energy state and compensatory behavioral and physiological responses to recurring events of moderate or severe energy imbalance and potential effects on body weight. We also aspire to determine if and how reproductive state-specific patterns of secretion of another important ovarian steroid hormone, progesterone, may influence E actions on those parameters.
In summary, the current studies provide novel evidence that E signal strength governs rebound feeding after interruption of consumption for intervals less than 24 hours. Results show that estrous cycle peak (but not baseline) E levels engage hindbrain AMPK signaling to amplify hyperphagia in response to FD-18 duration. Observations of hindbrain AMPK-dependent hyperglycemia, alongside elevated insulin secretion, in refed rats exposed to FD-18 implicate this sensor in developed insulin resistance, which may confer beneficial partitioning of glucose to glucose-dependent tissues and organs during this specific metabolic stress paradigm. Current data indicate that E regulation of compensatory refeeding and fuel disposal secondary to disrupted consumption may likely vary over the estrous/menstrual cycle in adult female mammals. Further research is warranted to determine if and how rare versus frequent instances of interrupted patterns of feeding during the periovulatory period may negatively affect body weight and obesity over the long term.
ACKNOWLEDGMENTS
This study was funded by National Institutes of Health grant HD 083389.
Notes
CONFLICTS OF INTEREST: No potential conflict of interest relevant to this article was reported.