Serum Preadipocyte Factor 1 Levels Are Not Associated with Bone Mineral Density among Healthy Postmenopausal Korean Women
Article information

Abstract
Background
Multipotent mesenchymal stem cells can differentiate into adipocytes or osteoblasts through closely regulated lineage-control processes. However, adipocyte precursor cells release preadipocyte factor 1 (Pref-1), which inhibits the differentiation of mesenchymal stem cells into mature adipocytes and osteoblasts. Previous studies have also reported an inverse association between Pref-1 levels and bone mineral density (BMD) among patients with anorexia nervosa.
Methods
In this retrospective study, we examined the correlations between Pref-1 levels and BMD among 124 healthy postmenopausal women (>50 years old). The patients had provided information regarding their clinical characteristics, and underwent blood testing and serum Pref-1 testing.
Results
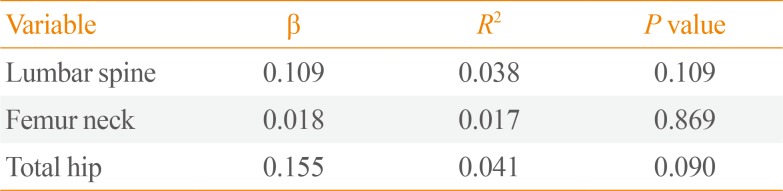
The subjects' mean age was 59.9±7.1 years and the median time since menopause onset was 9.1 years. A history of osteoporotic fracture was identified in 23 subjects (19%). Serum Pref-1 levels were not significantly correlated with BMD values at the lumbar spine (R2=0.038, P=0.109), femur neck (R2=0.017, P=0.869), and total hip (R2=0.041, P=0.09), and multivariate analyses with adjustment for age and body mass index also did not detect any significant correlations. Subgroup analyses according to a history of fracture also did not detect significant associations between Pref-1 levels and BMD values.
Conclusion
In our study population, it does not appear that serum Pref-1 levels are significantly associated with BMD values and osteoporosis.
INTRODUCTION
Osteoporosis is a pathological condition that is characterized by decreasing bone strength and bone mass, which increases the risk of vertebral and hip fractures. According to the 2008 to 2011 Korean National Health and Nutrition Examination Survey, the prevalence of osteoporosis among Korean women and men who were ≥50 years old were 38.0% and 7.3%, respectively [1]. Furthermore, given the effect of osteoporosis on public health, efforts have been made to identify subgroups of individuals who are susceptible to osteoporosis and osteoporotic fracture using serological markers.
Multipotent mesenchymal stromal cells (MSCs) in bone marrow differentiate into adipocytes or osteoblasts through closely-regulated lineage-control processes that occur at the precursor cell level [23]. Among the factors that affect MSC differentiation, preadipocyte factor 1 (Pref-1) is released from adipocyte precursor cells and inhibits the differentiation of MSC into adipocytes and osteoblasts [4]. In vivo studies have revealed that Pref-1 prevents chondrocyte maturation and osteoblast differentiation in mouse embryo fibroblasts, and its ablation and overexpression caused bone malformation [5]. High levels of circulating Pref-1 also enhance bone resorption and inhibited bone formation in vitro, and Pref-1 deficiency protected against bone loss in mice [6]. Moreover, patients with genetic mutations that are related to the Pref-1 protein experience abnormal bone metabolism syndromes [78].
Serum Pref-1 levels exhibit an inverse associated with bone mineral density (BMD) among young women with anorexia nervosa [9] and young women (18 to 35 years old) with hypothalamic amenorrhea [10]. However, there are no data regarding the effect of serum Pref-1 levels on BMD among postmenopausal women. Thus, the present study aimed to examine the associations between serum Pref-1 levels and BMD or fractures among healthy postmenopausal women from a previous study's cohort.
METHODS
Subjects
The present study retrospectively evaluated a previously formed cohort of 337 healthy postmenopausal women (>50 years old) who voluntarily underwent testing at Kangwon National University Hospital during June to October 2009 [11]. Serum Pref-1 levels were measured in 124 consecutive subjects. Menopause was defined as the absence of menstruation for ≥1 year. We excluded women who were receiving glucocorticoids and estrogen for >3 preceding months, women with diseases that could affect bone metabolism (e.g., Graves disease or Cushing syndrome), women who had undergone hysterectomy, and women who had undergone premenopausal bilateral ovariectomy. This study was approved by the Institutional Review Board of Kangwon National University Hospital (IRB number 09-07), and all women had provided their written informed consent to participate in the original study.
Laboratory tests
Areal BMD values (g/cm2) for all subjects were measured at the spine, femoral neck, and total hip using a Lunar Prodigy Vision dual-emission X-ray absorptiometry system (Lunar Corp., Madison, WI, USA). According to the World Health Organization definition, osteoporosis was defined as a T-score of ≤−2.5 standard deviations at any site. One investigator performed all densitometry testing and analyses for all subjects. Previous fracture histories were collected by a self-administered questionnaire. Serum Pref-1 levels were measured using a Human Pref-1/DLK-1/FA1Quantikine ELISA Kit (R&D Systems, Minneapolis, MN, USA), which has a mean minimum detection level of 0.012 ng/mL, an intra-assay variability of 3.7%, and an interassay variability of 6.2%.
Statistical analysis
The correlation between Pref-1 levels and other continuous variables were evaluated using Pearson correlation analyses. The actual BMD values were used for the bone mass analyses, rather than the T-scores or Z-scores. Multivariate analyses were performed with adjustment for age, body mass index (BMI), and systolic blood pressure. We also performed subgroup analyses, based on a fracture history, to examine any variation in the potential association between BMD scores and Pref-1 levels. Statistical analyses were performed using STATA software version 12.1 (StataCorp., College Station, TX, USA), all tests were two-tailed, and P values of <0.05 were considered statistically significant.
RESULTS
Clinical characteristics
Table 1 shows the subjects' baseline clinical characteristics. The 124 postmenopausal women had a mean age of 59.9±7.1 years and a mean BMI of 24.2±3.4 kg/m2 (Table 1). Twenty-three subjects (19%) had experienced an osteoporotic fracture. The median T-scores at the lumbar spine, femur neck, and total hip were −1.2, −0.7, and −0.4, respectively. All absolute BMD values at the three loci exhibited significant inverse correlations with the subjects' age (data not shown). There were no differences in the clinical characteristics of the patients who were included and excluded from this study (Supplemental Table S1).

Anthropometric and Laboratory Characteristics
Correlation between serum Pref-1 levels and BMD
Serum Pref-1 levels were not significantly correlated with the absolute BMD values at all three loci: lumbar spine (R2=−0.002, P=0.377), femur neck (R2=−0.005, P=0.508), and total hip (R2=−0.005, P=0.555). The other anthropometric and laboratory values also did not exhibit any significant correlations with Pref-1 levels (data not shown). The multivariate analyses with adjustment for age and BMI also failed to detect a significant association between Pref-1 levels and the absolute BMD scores (Table 2).

Adjusted Associations between Serum Preadipocyte Factor 1 Levels and Bone Mineral Densities
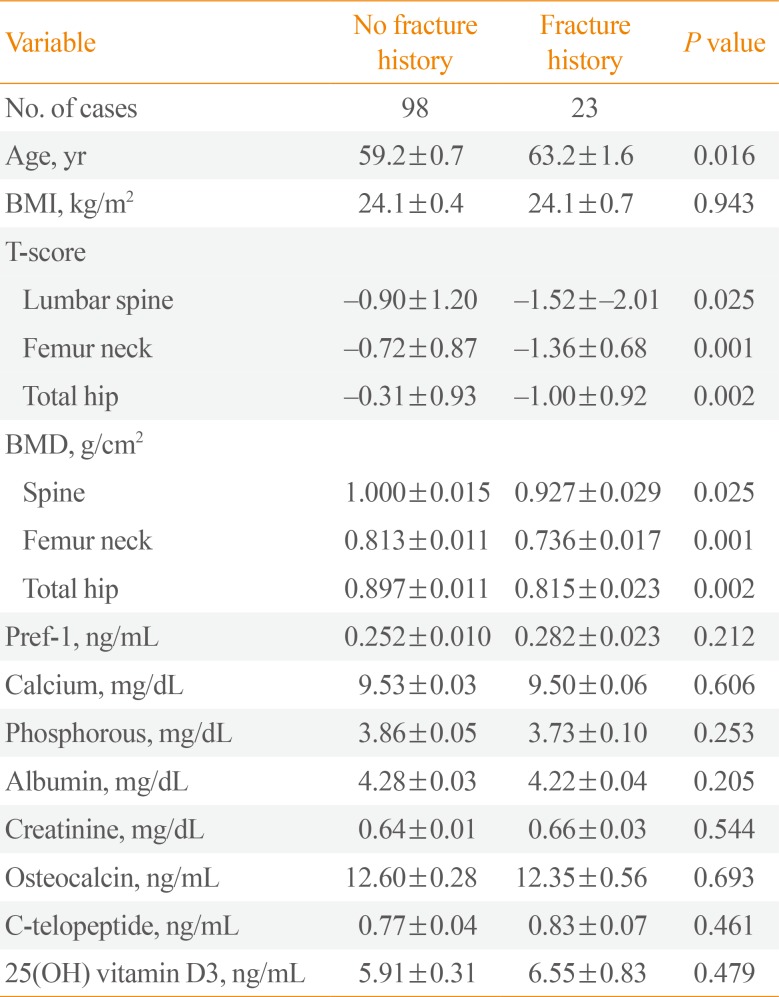
Subgroup analyses according to a fracture history and BMI
Table 3 shows that subjects with an osteoporotic fracture history were significantly older and had lower BMD values and T-scores, compared to subjects without a fracture history. However, there were no other significant differences between the two groups, including in their Pref-1 levels. Multivariate analyses also failed to detect a significant correlation between Pref-1 levels and BMD values in both groups (Table 4).

Bone Mineral Densities and Preadipocyte Factor 1 Levels according to a History of Fracture

Adjusted Correlations between Preadipocyte Factor 1 Levels and Bone Mineral Densities according to a History of Fracture
DISCUSSION
The close association between bone mass and fat tissue has been suggested by previous experimental studies, which identified several mechanisms that might control the differentiation of bone marrow MSCs into adipocytes and osteoblasts [2312]. Among these mechanisms, Pref-1 is a protein that inhibits MSC differentiation into adipocytes and osteoblasts [5]. For example, a clinical study of 20 women with anorexia nervosa revealed that they had elevated Pref-1 levels (vs. controls), an inverse association between Pref-1 levels and BMD scores, and a positive association between Pref-1 levels and marrow adipose tissue [9]. However, another study found similar Pref-1 levels in amenorrheic athletes, eumenorrheic athletes, and nonathletic controls, and the Pref-1 levels were only negatively associated with BMD and estimated bone strength in the nonathletic control group [13]. Mice with osteoblast-specific Pref-1 overexpression also exhibit significantly reduced BMD, although Pref-1 (−/−) mice experienced significant protection from ovariectomy-induced bone loss, compared to wild-type mice [6].
The effect of Pref-1 on bone metabolism is likely mediated by estrogen, as experimental results revealed that Pref-1-deficient mice did not exhibit significant bone loss after ovariectomy [6]. Furthermore, clinical trials of adolescent girls with anorexia nervosa revealed that estrogen replacement was associated with increased BMD, decreased Pref-1 levels, and decreased marrow fat tissue [1415]. Moreover, the role of estrogen in the association of Pref-1 levels with bone metabolism is further supported by the decreased Pref-1 levels and increasing BMD after estrogen replacement treatment [14]. In addition, an epidemiological study confirmed that Pref-1 levels were higher in postmenopausal women, compared to in premenopausal women, and that these levels decreased after estrogen replacement treatment [16].
Based on the previous data from experimental and clinical studies, we aimed to evaluate the association of Pref-1 levels with BMD among healthy postmenopausal women. In our results, the mean value of Pref-1 was 0.28 ng/mL, corresponding to the range of 0.26 to 0.38 ng/dL reported in previous human studies [1314]; however, we were unable to detect any meaningful association. Firstly, our insignificant results might result from small sample size. In fact, power analysis showed low statistical power less than 0.8, showing insufficient sample size to observe statistical significance. This absence of a significant association also may be related to the subjects' good estrogen status and relatively high BMI values (approximately 24 kg/m2). Given that postmenopausal women with higher BMI values have higher estrogen levels [17], our subjects likely had relatively sufficient estrogen status, which likely mitigated any association between Pref-1 levels and BMD. However, we were unable to account for estrogen levels in our analyses, as these data were not collected for our subjects, and only a low proportion of subjects had BMI values of <20 kg/m2. Furthermore, the subjects' generally good bone health condition might also explain the absence of significant association in our findings, as only 13.7% of our subjects had osteoporosis, compared to a prevalence of approximately 37.5% among the general population of Korean women. Thus, as previous studies have found that elevated Pref-1 levels were associated with significant decreases in bone mass, a larger study sample may be needed to identify any trivial associations between these factors among subjects with good baseline bone health. Therefore, large well-designed studies are warranted to evaluate the association between Pref-1 levels and BMD, and these studies should account for well-known factors that are associated with bone metabolism, such as estrogen levels, thyroid function, nutritional status, smoking, and alcohol consumption [18192021].
In conclusion, the present study failed to detect a significant correlation between serum Pref-1 levels and BMD scores among health postmenopausal women. Therefore, to clarify the association between Pref-1 levels and bone metabolism, larger studies of the general population are needed.
ACKNOWLEDGMENTS
This study was supported by research fund of Kangwon Branch of Korean Endocrine Society (2016).
Notes
CONFLICTS OF INTEREST: No potential conflict of interest relevant to this article was reported.
References
SUPPLEMENTARY MATERIAL
Supplemental Table S1
The Clinical and Laboratory Characteristics of the Included and Excluded Subjects