
Articles
- Page Path
- HOME > Endocrinol Metab > Volume 29(4); 2014 > Article
-
Case ReportIncidentally Detected Inoperable Malignant Pheochromocytoma with Hepatic Metastasis Treated by Transcatheter Arterial Chemoembolization
- Joong Keun Kim1, Bo Hyun Kim1,2, Sung Min Baek1, Dong Hun Shin1, Won Jin Kim1, Yun Kyoung Jeon1, Sang Soo Kim1, In Joo Kim1,2
-
Endocrinology and Metabolism 2014;29(4):584-589.
DOI: https://doi.org/10.3803/EnM.2014.29.4.584
Published online: December 29, 2014
1Department of Internal Medicine, Pusan National University School of Medicine, Busan, Korea.
2Medical Research Institute, Pusan National University School of Medicine, Busan, Korea.
- Corresponding author: Bo Hyun Kim. Division of Endocrinology and Metabolism, Department of Internal Medicine, Pusan National University Hospital, 179 Gudeok-ro, Seo-gu, Busan 602-739, Korea. Tel: +82-51-240-7678, Fax: +82-51-254-3217, pons71@hanmail.net
• Received: April 22, 2014 • Revised: May 28, 2014 • Accepted: June 23, 2014
Copyright © 2014 Korean Endocrine Society
This is an Open Access article distributed under the terms of the Creative Commons Attribution Non-Commercial License (http://creativecommons.org/licenses/by-nc/3.0/) which permits unrestricted non-commercial use, distribution, and reproduction in any medium, provided the original work is properly cited.
ABSTRACT
- Malignant pheochromocytoma (PCC) is a rare condition. Although the liver is the second most frequent site of metastasis in malignant PCC, no definite treatments have been established. Herein, we report a case of liver metastasis of PCC that was successfully treated by transcatheter arterial chemoembolization (TACE). A 69-year-old man was admitted to the Department of Gastroenterology for evaluation of an incidental hepatic mass in August 2013. He had undergone right adrenalectomy in May 2005 and PCC had been confirmed on the basis of histopathological findings. Liver biopsy was performed, and metastatic PCC was diagnosed. The lesion appeared inoperable because of invasion of the portal vein and metastases in the lymph nodes along the hepatoduodenal ligament. Thus, TACE was performed instead. After TACE, symptoms including dizziness and cold sweating improved, and the patient's serum catecholamine levels decreased. On the basis of this case, we believe that TACE may be a useful treatment for liver metastasis in malignant PCC.
- Pheochromocytoma (PCC) is a rare catecholamine-producing neuroendocrine tumor originating from the chromaffin cells of the adrenal medulla [1]. Even if a PCC is initially diagnosed as benign on the basis of histopathological findings, it is possible for metastasis to occur in other organs after resection [2]. Malignant PCC accounts for approximately 10% to 15% of all cases of PCC [3]. The standard treatments for malignant PCC include surgical resection, radiotherapy, local ablation, chemotherapy, radionuclide therapy (e.g., metaiodobenzylguanidine [MIBG]) and molecular targeted therapy. Although surgical resection constitutes the best treatment option, inoperable cases are much more common than operable cases. However, there is currently no consensus on the optimal treatment strategy for inoperable metastatic PCC. Accordingly, some patients are overtreated, while others are undertreated. Despite the liver being the second most frequent site of distant metastasis [3], reported cases of liver metastasis in PCC are relatively rare [2]. Additional case reviews and long-term studies are necessary to reach a consensus on the most appropriate treatment strategy for these lesions. Herein, we report a case of inoperable liver metastasis in PCC for which transcatheter arterial chemoembolization (TACE) was performed rather than other treatment modalities such as chemotherapy or radionuclide therapy.
INTRODUCTION
- A 69-year-old man was admitted to the Department of Gastroenterology for evaluation of an incidental hepatic mass in August 2013. In 2005, he had been admitted to the Department of Endocrinology because of cold sweating, facial flushing, and uncontrolled blood pressure. A ~7 cm right adrenal mass had been observed on computed tomography (CT) and there had been no distant metastasis on an MIBG scan. The patient had undergone laparoscopic right adrenalectomy due to PCC. After surgery, he had been followed up in the outpatient clinic until 2007. During that period, there was no evidence of metastasis in abdominal CT. The patient had also been treated for hypertension and type 2 diabetes mellitus for 3 years and had a history of coronary stent insertion for non-ST-elevation myocardial infarction in March 2012. At admission to the Department of Gastroenterology, he experienced dizziness, diaphoresis, general weakness, and poor oral intake; his blood pressure was 130/80 mm Hg and his heart rate was 78 bpm. Contrast-enhanced abdominal CT and magnetic resonance imaging (MRI) were performed. They revealed a ~10 cm hepatic mass in the right lobe of the liver that had a high signal intensity on T2-weighted images and early arterial enhancement and delayed washout on dynamic contrast-enhanced images. Also, it had a low signal intensity on the hepatobiliary phase and high cellularity on the diffusion phase (Fig. 1). The hepatic mass was considered to be hepatocellular carcinoma rather than malignant PCC. For these reasons, liver biopsy was performed to evaluate the incidental hepatic mass. The patient was given the α-adrenergic antagonist phenoxybenzamine to prevent a hypertensive crisis before biopsy because we could not completely rule out the possibility of metastatic PCC. However, during and after the liver biopsy, his vital signs were stable. PCC was finally confirmed on the basis of morphological and immunohistochemical findings, with the specimens staining positive for chromogranin A and synaptophysin. Laboratory tests revealed the following serum metabolite levels on the day of admission: aspartate aminotransferase, 29 IU/L (normal, 10 to 40); alanine aminotransferase, 24 IU/L (normal, 6 to 40); alkaline phosphatase, 97 IU/L (normal, 40 to 129); total bilirubin, 0.42 mg/dL (normal, 0.1 to 1.2); direct bilirubin, 0.16 mg/dL (normal, 0.09 to 0.30); and γ-glutamyltranspeptidase (GGT), 150 IU/L (normal, 11 to 73). These levels, obtained by performing a liver function test, were all in the normal ranges, except for the mild elevation of GGT. Hepatitis virus markers were negative and tumor markers for hepatocellular carcinoma (α-fetoprotein and protein induced by vitamin K absence or antagonist II) were in the normal ranges. Furthermore, at admission we measured the patient's serum/urine levels of catecholamines, which were as follows: serum epinephrine, 0.078 pg/mL (normal, <50); serum norepinephrine, 1.473 pg/mL (normal, 110 to 410); serum metanephrine, 2.47 nmol/L (normal, <0.5); serum normetanephrine, 44.97 nmol/L (normal, <0.5); 24-hour urine epinephrine, 43.8 µg (normal, 0 to 20 µg/day); 24-hour urine norepinephrine, 339 µg (normal, 12.1 to 85.5 µg/day); 24-hour urine metanephrine, 35.931 mg (normal, 0.0 to 1.3 mg/day); and 24-hour urine vanillylmandelic acid, 120 mg (normal, 1.20 to 6.52 mg/day). The total urine volume collected in one day was 1,900 mL, and contained 1,171.16 mg of creatinine. The serum and 24-hour urine catecholamine levels were high. An 131I-MIBG scan revealed increased uptake of 131I-MIBG in the right adrenal gland bed and adjacent liver parenchyma (Fig. 2). Surgical resection was impossible because the tumor had invaded the portal vein and the adjacent lymph nodes. Therefore, we planned radionuclide therapy. However, the isolated ward needed for that was not available for at least 6 weeks. Finally, TACE was performed for the liver metastasis. Celiac angiography showed a large mass in the right lobe of the liver. An emulsion of 10 mL of lipiodol and 50 mg of doxorubicin (an anticancer drug) was injected (Fig. 3A). The tumor was well lipiodolized, as observed by post-TACE imaging (Fig. 3B).
- Before the procedure, the patient continued to receive phenoxybenzamine. After TACE, he was transferred to the intensive care unit for 6 days for management of a hypertensive crisis and postembolization syndrome. His high blood pressure and tachycardia were strictly controlled by infusion of nitroprusside, nifedipine, and labetalol (Fig. 4). Abdominal CT was performed 2 weeks after TACE. Although the size of the metastatic hepatic mass had not decreased, it showed lipiodol uptake (Fig. 3C). However, follow-up abdominal CT 7 months after TACE showed that the diameter of the hepatic mass had decreased from 10 to 8.3 cm (Fig. 3D). Although the response was that of stable disease on the basis of modified RECIST criteria, the tumor seemed to have responded to TACE because of its decreased size. The patient's symptoms at admission, including dizziness and diaphoresis, improved substantially. The serum catecholamine levels were followed up 2 months after TACE and were as follows: serum epinephrine, 0.091 pg/mL; serum norepinephrine, 0.842 pg/mL; serum metanephrine, 4.26 nmol/L; and serum normetanephrine, 22.27 nmol/L. The serum norepinephrine and normetanephrine levels had decreased significantly (Fig. 5). The patient continues to be followed up and has shown no significant problems.
CASE REPORT
- PCCs and paragangliomas (PGLs) are catecholamine-producing tumors derived from the sympathetic or parasympathetic nervous system. They have an estimated incidence of 2 to 8 per million. They are the cause of hypertension in 0.2% to 0.6% of patients and are present in 4% of adrenal incidentalomas. While most PCCs/PGLs are benign, 10% to 15% of PCCs and 20% to 50% of PGLs are reportedly malignant [4,5]. Moreover, these tumors are likely to be underdiagnosed. According to the Mayo Clinic Autopsy study, conducted over a 50-year period, only 13 (24%) of 54 PCCs had been correctly diagnosed before death. It was also noted that 54% of the remaining 41 individuals reportedly experienced hypertension in their lifetime [6].
- The signs and symptoms of PCCs include sympathetic nervous system hyperactivity, including elevated heart rate, elevated blood pressure, palpitations, diaphoresis, and anxiety. The prognosis in malignant PCC is poor and is related to the metastatic site and the relative levels of circulating catecholamines. The 5-year survival rate is 44% to 57% [7]. The PCC of the adrenal gland scaled score (PASS score) is usually used to estimate the prognosis in PCC. Cases with a PASS score of ≥4 are classified as potentially malignant tumors [7].
- Several treatments for malignant PCCs have been reported, including surgical resection, chemotherapy, radiotherapy, 131I-MIBG therapy, TACE, and molecular targeted therapy. Some studies report that surgical resection, if possible, is the most effective treatment, while other studies recommend that chemotherapy be used as the first-line therapy for rapidly progressive metastatic PCC [8,9]. On the other hand, if progression is slower, 131I-MIBG therapy is preferred for patients with positive results on an MIBG scan [8]. However, there is currently no established standard therapeutic strategy for this malignancy. While MIBG therapy and chemotherapy are reported relatively frequently, reports of TACE for liver metastasis in PCC are rare.
- Herein, we reported a case of inoperable hepatic metastasis in PCC for which TACE was performed. Although the follow-up after TACE was short, it is clear that TACE was effective in our patient in terms of the improvement of symptoms and decreased levels of catecholamines. Therefore, we suggest that TACE may constitute a useful treatment option for hepatic metastases in PCC, especially for inoperable tumors.
- We would like to emphasize a few points. First, a definite diagnosis of metastatic PCC is necessary before treatment. Imaging modalities such as CT, MRI, and positron emission tomography are limited in terms of distinguishing metastatic lesions from the primary malignancy, and liver biopsy should not be performed when metastatic PCC is suspected. Appropriate laboratory measurements and an MIBG scan should be performed for correct diagnosis of PCC.
- Second, hypertensive crisis should be examined carefully during and after TACE. Similar to other treatments, such as surgical resection and chemotherapy, TACE may result in excretion of large amounts of catecholamines into the systemic circulation. In the present case, the patient suffered from a hypertensive crisis after the procedure. It was corrected by intravenous administration of antihypertensive agents.
- Third, routine follow-up, including both endocrinologic and imaging examinations, is necessary. In the present case, the patient was diagnosed with hepatic metastasis of PCC 8 years after adrenalectomy. Similarly, Morikawa et al. [10] reported a 30-year-old woman who developed a de novo hepatic tumor 10 years after resection for PCC of the left adrenal gland. She had been followed up annually by ultrasonography and examination of her plasma catecholamine levels, and she had no symptoms or endocrinologic abnormalities. However, a hepatic mass was detected through routine abdominal ultrasonography, indicating that follow-up by endocrinologic examination alone is insufficient to detect newly developed lesions. Therefore, the use of routine diagnostic imaging, as well as measuring catecholamine levels, is important during the follow-up period.
- Lastly, molecular analysis for hereditary or metastatic PCCs/PGLs is necessary. About 25% to 30% of patients with a malignant PCC/PGL have an inherited syndrome. Genetic mutations associated with PCCs and PGLs include mutations in the rearrangement during transfection (RET), von Hippel-Lindau (VHL), neurofibromatosis type 1 (NF1), succinate dehydrogenase (SDH), transmembrane protein 127 (TMEN127), MYC-associated factor X (MAX), and hypoxia-inducible factor 2α (EPAS/HIF2A) genes [11,12]. The correlation between genetic mutations and biochemical phenotype in PCCs/PGLs may provide an opportunity for earlier identification of malignant potential and novel targeted therapy. Because of the relatively high prevalence of familial syndromes among patients who present with PCCs or PGLs, it is useful to identify germline mutations in patients without a known family history [12]. Unfortunately, we did not test for germline mutations in the present case.
- In conclusion, this case report shows that TACE might be a useful treatment option for inoperable hepatic metastases in PCC. However, further evidence supporting the use of TACE is lacking. Therefore, additional case reports and long-term studies are necessary to reach a consensus on the optimal therapeutic strategy for malignant PCC.
DISCUSSION
- 1. Gruber M, Darr R, Eisenhofer G. Pheochromocytoma: update on diagnosis and therapy. Dtsch Med Wochenschr 2014;139:486–490. ArticlePubMedPDF
- 2. Hidaka S, Hiraoka A, Ochi H, Uehara T, Ninomiya T, Miyamoto Y, Hasebe A, Tanihira T, Tanabe A, Ichiryu M, Nakahara H, Tazuya N, Ninomiya I, Michitaka K. Malignant pheochromocytoma with liver metastasis treated by transcatheter arterial chemo-embolization (TACE). Intern Med 2010;49:645–651. ArticlePubMed
- 3. Hori T, Yamagiwa K, Hayashi T, Yagi S, Iida T, Taniguchi K, Kawarada Y, Uemoto S. Malignant pheochromocytoma: Hepatectomy for liver metastases. World J Gastrointest Surg 2013;5:309–313. ArticlePubMedPMC
- 4. Fishbein L, Orlowski R, Cohen D. Pheochromocytoma/paraganglioma: review of perioperative management of blood pressure and update on genetic mutations associated with pheochromocytoma. J Clin Hypertens (Greenwich) 2013;15:428–434. ArticlePubMedPMC
- 5. Martucci VL, Pacak K. Pheochromocytoma and paraganglioma: diagnosis, genetics, management, and treatment. Curr Probl Cancer 2014;38:7–41. ArticlePubMedPMC
- 6. Sutton MG, Sheps SG, Lie JT. Prevalence of clinically unsuspected pheochromocytoma. Review of a 50-year autopsy series. Mayo Clin Proc 1981;56:354–360. ArticlePubMed
- 7. Mlika M, Kourda N, Zorgati MM, Bahri S, Ben Ammar S, Zermani R. Prognostic value of Pheochromocytoma of the Adrenal Gland Scaled Score (Pass score) tests to separate benign from malignant neoplasms. Tunis Med 2013;91:209–215. PubMed
- 8. Scholz T, Eisenhofer G, Pacak K, Dralle H, Lehnert H. Clinical review: current treatment of malignant pheochromocytoma. J Clin Endocrinol Metab 2007;92:1217–1225. ArticlePubMedPDF
- 9. Hodin R, Lubitz C, Phitayakorn R, Stephen A. Diagnosis and management of pheochromocytoma. Curr Probl Surg 2014;51:151–187. ArticlePubMed
- 10. Morikawa T, Suzuki M, Unno M, Endo K, Katayose Y, Matsuno S. Malignant pheochromocytoma with hepatic metastasis diagnosed 10 years after a resection of the primary incidentaloma adrenal lesion: report of a case. Surg Today 2001;31:80–84. ArticlePubMedPDF
- 11. Gimenez-Roqueplo AP, Dahia PL, Robledo M. An update on the genetics of paraganglioma, pheochromocytoma, and associated hereditary syndromes. Horm Metab Res 2012;44:328–333. ArticlePubMedPDF
- 12. Lowery AJ, Walsh S, McDermott EW, Prichard RS. Molecular and therapeutic advances in the diagnosis and management of malignant pheochromocytomas and paragangliomas. Oncologist 2013;18:391–407. ArticlePubMedPMC
References
Fig. 1Abdominal computed tomography (A) and magnetic resonance imaging of the liver (B) at admission showed a ~10 cm mass in the right lobe of the liver that had a high signal intensity on T2-weighted images and early arterial enhancement and delayed washout on dynamic contrast-enhanced images. Also, the hepatic mass had a low signal intensity on the hepatobiliary phase and high cellularity on the diffusion phase (white arrows).
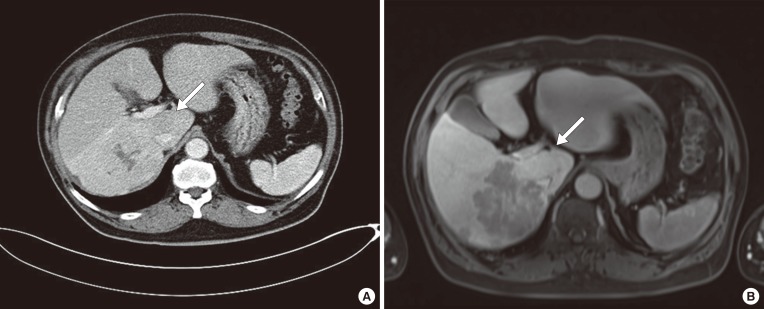
Fig. 2An 131I-metaiodobenzylguanidine scan showed increased uptake in the right adrenal gland bed and adjacent liver parenchyma.

Fig. 3Transcatheter arterial chemoembolization (TACE). (A) The hepatic mass was stained in the celiac angiogram. An emulsion of 10 mL of lipiodol and 50 mg of doxorubicin was injected. (B) The tumor was well lipiodolized, as observed by post-TACE imaging. Abdominal computed tomography scans taken (C) 2 weeks and (D) 7 months after TACE revealed partial lipiodol uptake and necrotic changes in the center of the liver mass. The size of the mass (white arrow) had decreased to 8.3 cm.
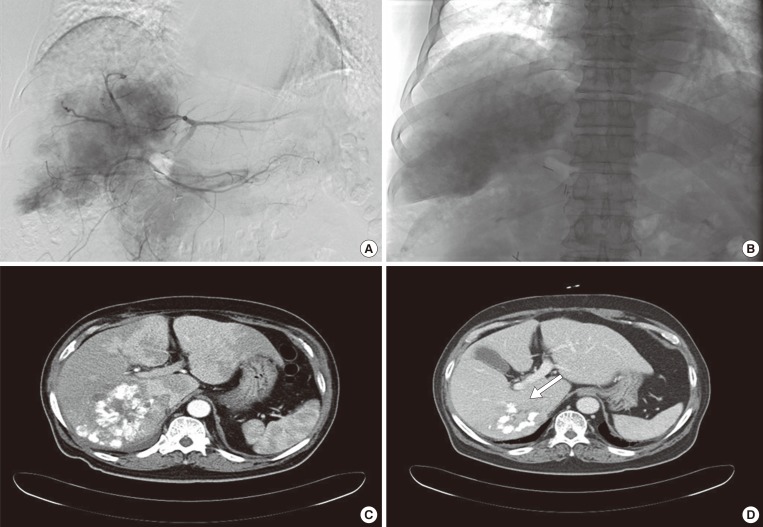
Fig. 4Vital signs during the first 6 days after transcatheter arterial chemoembolization (TACE). A hypertensive crisis was observed immediately after TACE. The arrows indicate the time of TACE. DBP, diastolic blood pressure; SBP, systolic blood pressure.
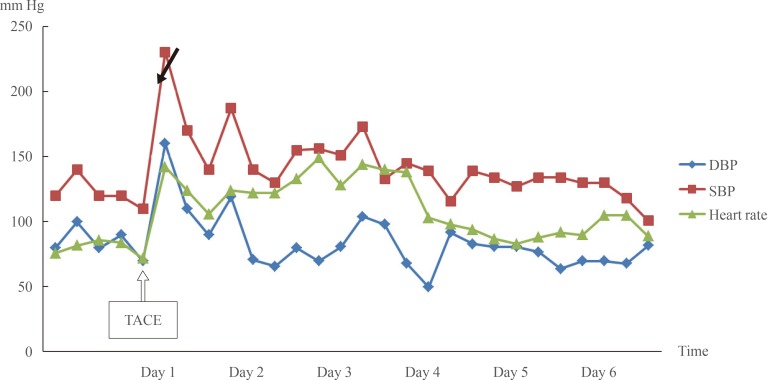
Fig. 5Relative estimates of pre- and post-transcatheter arterial chemoembolization (TACE) serum catecholamine levels. Marked decreases in (A) norepinephrine and (B) normetanephrine levels were observed 2 weeks after TACE. E, serum epinephrine (pg/mL); NE, norepinephrine (pg/mL); M, metanephrine (nmol/L); NM, normetanephrine (nmol/L).
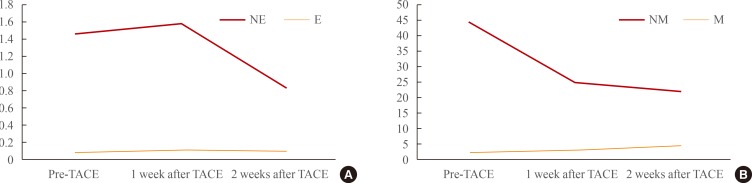
Figure & Data
References
Citations
Citations to this article as recorded by 
- ASTAXANTHIN INHIBITS CELL PROLIFERATION, MIGRATION, INVASION AND INDUCED APOPTOSIS VIA AMPK-mTOR SIGNALING PATHWAY IN HEPATOCELLULAR CARCINOMA HEP 3B CELLS
SHUJUN LU, YAJING ZHANG, WENLI YU
Cellulose Chemistry and Technology.2023; 57(9-10): 1001. CrossRef - Progressive metastatic pheochromocytoma induced by multiple endocrine neoplasia type 2A with a lethal outcome
Koshiro Nishimoto, Noriaki Lukas Santo, Masato Yonamine, Kazuhiro Takekoshi, Go Kaneko, Suguru Shirotake, Hisayo Fukushima, Yoshitaka Okada, Masanori Yasuda, Akihiro Sakurai, Masafumi Oyama, Kento Kanao
IJU Case Reports.2022; 5(6): 459. CrossRef - Astaxanthin Inhibits Proliferation and Induces Apoptosis of Human Hepatocellular Carcinoma Cells via Inhibition of Nf-Κb P65 and Wnt/Β-Catenin in Vitro
Jingjing Li, Weiqi Dai, Yujing Xia, Kan Chen, Sainan Li, Tong Liu, Rong Zhang, Jianrong Wang, Wenxia Lu, Yuqing Zhou, Qin Yin, Huerxidan Abudumijiti, Rongxia Chen, Yuanyuan Zheng, Fan Wang, Jie Lu, Yingqun Zhou, Chuanyong Guo
Marine Drugs.2015; 13(10): 6064. CrossRef - Articles in 'Endocrinology and Metabolism' in 2014
Won-Young Lee
Endocrinology and Metabolism.2015; 30(1): 47. CrossRef - Clinical course and prognostic factors in patients with malignant pheochromocytoma and paraganglioma: A single institution experience
Yun Mi Choi, Tae‐Yon Sung, Won Gu Kim, Jong Jin Lee, Jin‐Sook Ryu, Tae Yong Kim, Won Bae Kim, Suck Joon Hong, Dong Eun Song, Young Kee Shong
Journal of Surgical Oncology.2015; 112(8): 815. CrossRef
 PubReader
 Cite
Cite


