Age-Related Changes in the Prevalence of Osteoporosis according to Gender and Skeletal Site: The Korea National Health and Nutrition Examination Survey 2008-2010
Article information
Abstract
Background
The incidence of osteoporosis and its related fractures are expected to increase significantly in the rapidly aging Korean population. Reliable data on the prevalence of this disease is essential for treatment planning. However, sparse data on Korean patients is available.
Methods
We analyzed data from the Korea National Health and Nutrition Examination Survey (KNHANES) 2008 to 2010. Bone mineral density (BMD) was measured at the femoral neck and lumbar spine using dual-energy X-ray absorptiometry. Osteopenia and osteoporosis were diagnosed according to the World Health Organization T-score criteria. We analyzed the BMD data of 17,208 people (men, 7,837; women, 9,368).
Results
The adjusted prevalence of osteoporosis was 7.8% in men versus 37.0% in women. No significant difference was observed in the prevalence of osteopenia between genders (men, 47.0%; women, 48.7%). The prevalence of osteoporosis in men in their 50s was 4.0%, in their 60s was 7.2%, in their 70s was 15.1%, and in their 80s was 26.7%. The figures in women were 15.2%, 36.5%, 62.7%, and 85.8%, respectively. The age group with the maximal BMD differed between genders. In the men, 20s had the highest value in all the skeletal sites. However, in the women, the maximal BMD in the femoral neck, lumbar spine, and the total hip was observed in their 20s, 30s, and 40s, respectively. The onset age of osteoporosis differed between genders. Osteoporosis in the femoral neck began at 55 years in the women and at 60 years in the men.
Conclusion
The prevalence of osteoporosis in Korea was significantly high. In addition, the age-related changes in the prevalence of osteoporosis differed according to gender and skeletal site.
INTRODUCTION
Osteoporosis is a disease that leads to an increased risk of fracture due to weakened bone strength. Despite no particular symptoms, the occurrence of fractures leads to death in severe cases. In the case of a femur fracture, 20% to 30% of patients die within 1 year after the onset of the fracture [1,2]. The most common cause of osteoporosis is aging, which rapidly progresses after 50 years of age. Skeletal aging is known to progress faster in women than in men due to hormonal changes after menopause. One out of six men and one out of two women have a possibility of experiencing an osteoporosis-related fracture during their lifespan after an age of 50 years. In particular, the risk of osteoporosis-related fractures has been reported to be higher in Asians [3]. Thus, the diagnosis and treatment of osteoporosis in the Korean elderly population have been considered important.
However, the domestic management system of osteoporosis is unfortunately inadequate. Among patients in their 50s who had an osteoporosis-related fracture, less than 50% of these patients had had a previous diagnosis or treatment of osteoporosis. In particular, among the fracture patients, the examination rate was 24.8% in men, which was significantly lower than 55.7% in women. This is likely attributable to the incorrect perception that osteoporosis is a female disease [4]. Thus, it is necessary to accurately identify the nation-wide prevalence of osteoporosis and to efficiently manage osteoporosis patients.
Most domestic studies conducted until now did not use subject samples that represented the general population, resulting in the reported prevalence of osteoporosis showing significant variation. According to the results of community-based studies conducted since 2006, the prevalence of osteoporosis in the lumbar spine and femoral neck in men was 6.5% to 12.9% and 1.3% to 5.8%, respectively, whereas it was 24.0% to 40.1% and 5.7% to 12.4% in women, respectively, which showed that a variation of 2 to 5 folds was observed depending on gender or skeletal site [5-9]. In addition, because the sampling number was small and the subjects were distributed to particular groups such as patients who visited hospitals or persons who underwent health examinations, the subjects did not represent the entire Korean population.
According to the Health Insurance Review & Assessment Service, osteoporosis patients and their corresponding medical expenses have been recently increasing [10]. The number of osteoporosis patients who visited hospitals increased from 535,000 in 2007 to 773,000 in 2011, therefore showing an increase of approximately 45% in 5 years. The medical expenses increased from 53.5 billion won to 72.2 billion won, which showed an increase of approximately 35% during the same period. As elderly patients in their 60s, in particular, accounted for more than 70% of the total patients who visited the hospitals, the prevalence of osteoporosis and its medical expenses are expected to rapidly increase with the rapidly aging society. The prevalence of osteoporosis is estimated to be more than 50% in women in their 60s, and socioeconomic expenses related to osteoporosis and musculoskeletal disease has been reported to be 2.2 trillion won annually [11]. Thus, if a proper preventive management system is not established, there might be a heavy financial burden on the national health insurance system.
Bone mineral density (BMD) analysis has been included in the Korea National Health and Nutrition Examination Survey (KNHANES) since 2008, making it possible to conduct a nation-wide analysis of osteoporosis. In a recent study utilizing BMD analysis data, the prevalence of osteoporosis was reported to be 7.5% in men and 35.5% in women in their 50s [12]. Although the aforementioned study provided useful information on the nation-wide prevalence of osteoporosis, the analysis was not conducted using a group that reflects the actual distribution of the Korean population. In our study, the prevalence of osteoporosis was analyzed using the source data of the KNHANES 2008 to 2010, and an additional analysis was conducted according to gender, age, and skeletal site. In addition, the prevalence of osteoporosis in Korea, which was obtained after adjusting for regional differences, was compared with that of other countries.
METHODS
Subjects
This study was conducted using the source data of the KNHANES 2008 to 2010 [13,14]. The KNHANES is a nation-wide cross-sectional survey that has been periodically conducted by the Center for Disease Control of the Ministry of Health and Welfare since 1998. As for the sampling selection, families in cities and provinces across the country were selected as the subjects of the study, further stratified according to region, age, and gender, and then extracted probabilistically to obtain the sample representing the nationalwide population. In particular, the rolling survey sampling was introduced in the 4th and 5th surveys to obtain similar samples over the years. The contents of the survey consisted of a health, nutrition, and medical examination, and the BMD examination has been included in the items of the medical examination since 2008.
The subjects of this study were 18,546 persons (3,583 in 2008, 7,920 in 2009, and 7,043 in 2010) who participated in the KNHANES 2008 to 2010 and who underwent a BMD examination. In this study, BMD by age was analyzed in men and women aged 10 to 89 years, and the prevalence of osteoporosis was analyzed in men and menopausal women aged 50 years or over. Among the subjects, 1,341 subjects who belonged to the following cases were excluded from the analysis: 1) men or women aged 90 years or over; 2) women who did not respond regarding her menopausal state; 3) women who underwent hysterectomy; and 4) subjects who did not undergo a BMD examination for the lumbar spine, total hip, or femoral neck. In particular, the fourth exclusion criterion was used to compare the prevalence of osteoporosis among the three sites used in the diagnosis of osteoporosis. In summary, the data of the 17,205 total subjects (male, 7,837; female, 9,368) aged 10 to 89 years were used for the analysis of BMD, of whom 7,163 (male, 3,314; female, 3,849) men and menopausal women aged 50 years or higher were included in the analysis of the prevalence of osteoporosis.
Methods
Body measurement and BMD examination
The subject's age was calculated by rounding down two decimal places. For example, an age of 54 years ranged between ≥54.0 and <55.0 years. Height and weight were measured by a nurse who received a special training on using the height meter, the SECA 225 (Vogel & Halke, Hamburg, Germany), and the weight meter, the GL-6000-20 (CAS Korea, Seoul, Korea). The body mass index (BMI) was obtained by dividing the weight by the square of the height (m).
The BMD was measured using a Hologic device (DISCOVERY QDR4500W, Hologic Inc., Bedford, MA, USA) via dualenergy X-ray absorptiometry. BMD examination was performed on the total hip (femoral trochanter, intertrochanteric, neck, and ward) and lumbar spine (mean of the lumbar spine 1 to 4). Before the measurement, a quality control was performed using the phantom provided by the manufacturer. To assess the accuracy of the device, the BMD of 30 randomly selected subjects was measured twice to determine the minimum tolerance (lumbar spine 1.9%, femoral neck 2.5%, total hip 1.8%).
Diagnosis of osteoporosis
The diagnosis of osteoporosis was performed in accordance with the standard recommended by the World Health Organization [15]. In other words, the measured BMD was converted into the T-score using the reference value. Osteoporosis, osteopenia, and normal status were diagnosed if the T-score was ≤-2.5, >-2.5 and <-1.0, and ≥-1.0, respectively. In addition, according to the recommendation by the International Society for Clinical Densitometry, osteoporosis was diagnosed based on the lowest T-score among the three sites (lumbar spine, total hip, femoral neck) [16]. Thus, if the T-score of any of the three sites was ≤-2.5, the status was diagnosed as osteoporosis.
Reference value and analysis of the prevalence of osteoporosis after device calibration
The prevalence of osteoporosis may vary depending on the selection of the normal standard group or the reference group. Thus, changes in the prevalence of osteoporosis were analyzed using the reference value used in previous studies on the prevalence of osteoporosis. To this end, the reference value used in a domestic study (in Namwon) [8], that of non-Hispanic white women in the United States National Health and Nutrition Examination Survey (NHANES III) [17], that of Chinese men [18] and women [19], and that of Japanese women [20] were used (Table 1). As mentioned above, the reference value provided by the manufacturer of the Hologic device was used in this study. Thus, BMD conversion was required for studies using the Lunar device [8,9,19]. To do this, the following conversion equation, suggested by Lu et al. [21], was used:
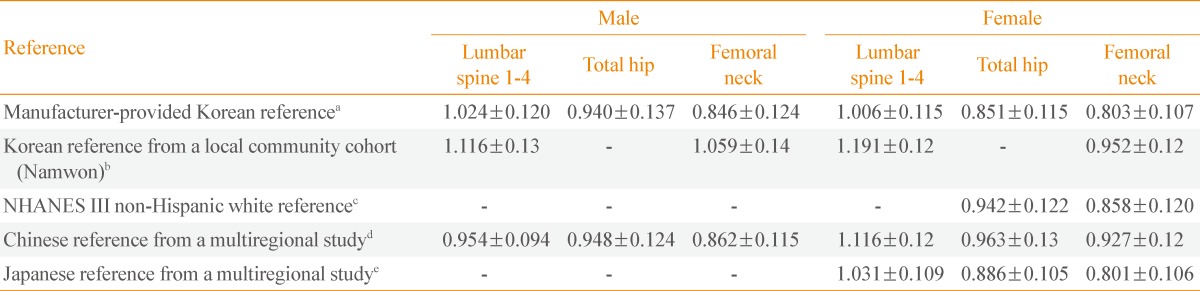
Reference Values to Calculate the T-Score
Statistical analysis
Statistical analysis was conducted using SPSS version 20.0 for Windows (IBM Co., Armonk, NY, USA). Continuous variables including BMD were presented using mean±standard deviation, and the prevalence of osteoporosis was presented using percentage (%). In addition, for the comparison of this study with other studies, the prevalence of osteoporosis was standardized based on the result of the 2010 population census reference [22]. A chi-square independence test was conducted to compare the prevalence of osteoporosis according to gender. A P<0.05 was considered statistically significant.
RESULTS
General characteristics of the subjects
The physical characteristics of the subjects were analyzed according to gender and age (Table 2). When the subjects were grouped according to age units of 10 years, the mean weight was 72.78 kg in the male subjects in their 30s and 58.63 kg in the female subjects in their 40s, which were the highest values in the male and female groups, respectively. The mean height was shown to be 174.65 and 161.45 cm in the male and female subjects in their 20s, respectively, which were the highest values. The BMI was shown to be 24.41 kg/m2 in the men in their 40s, and 24.48 kg/m2 in the women in their 60s, which were the highest values in the men and women, respectively. When the mean BMI of the total subjects aged 10 to 89 years was compared according to gender, it was higher in the men (23.59 kg/m2) than in the women (23.03 kg/m2). However, when the mean BMI of the subjects aged 50 to 89 years was compared according to gender, it was higher in the women (24.14 kg/m2) than in the men (23.60 kg/m2).
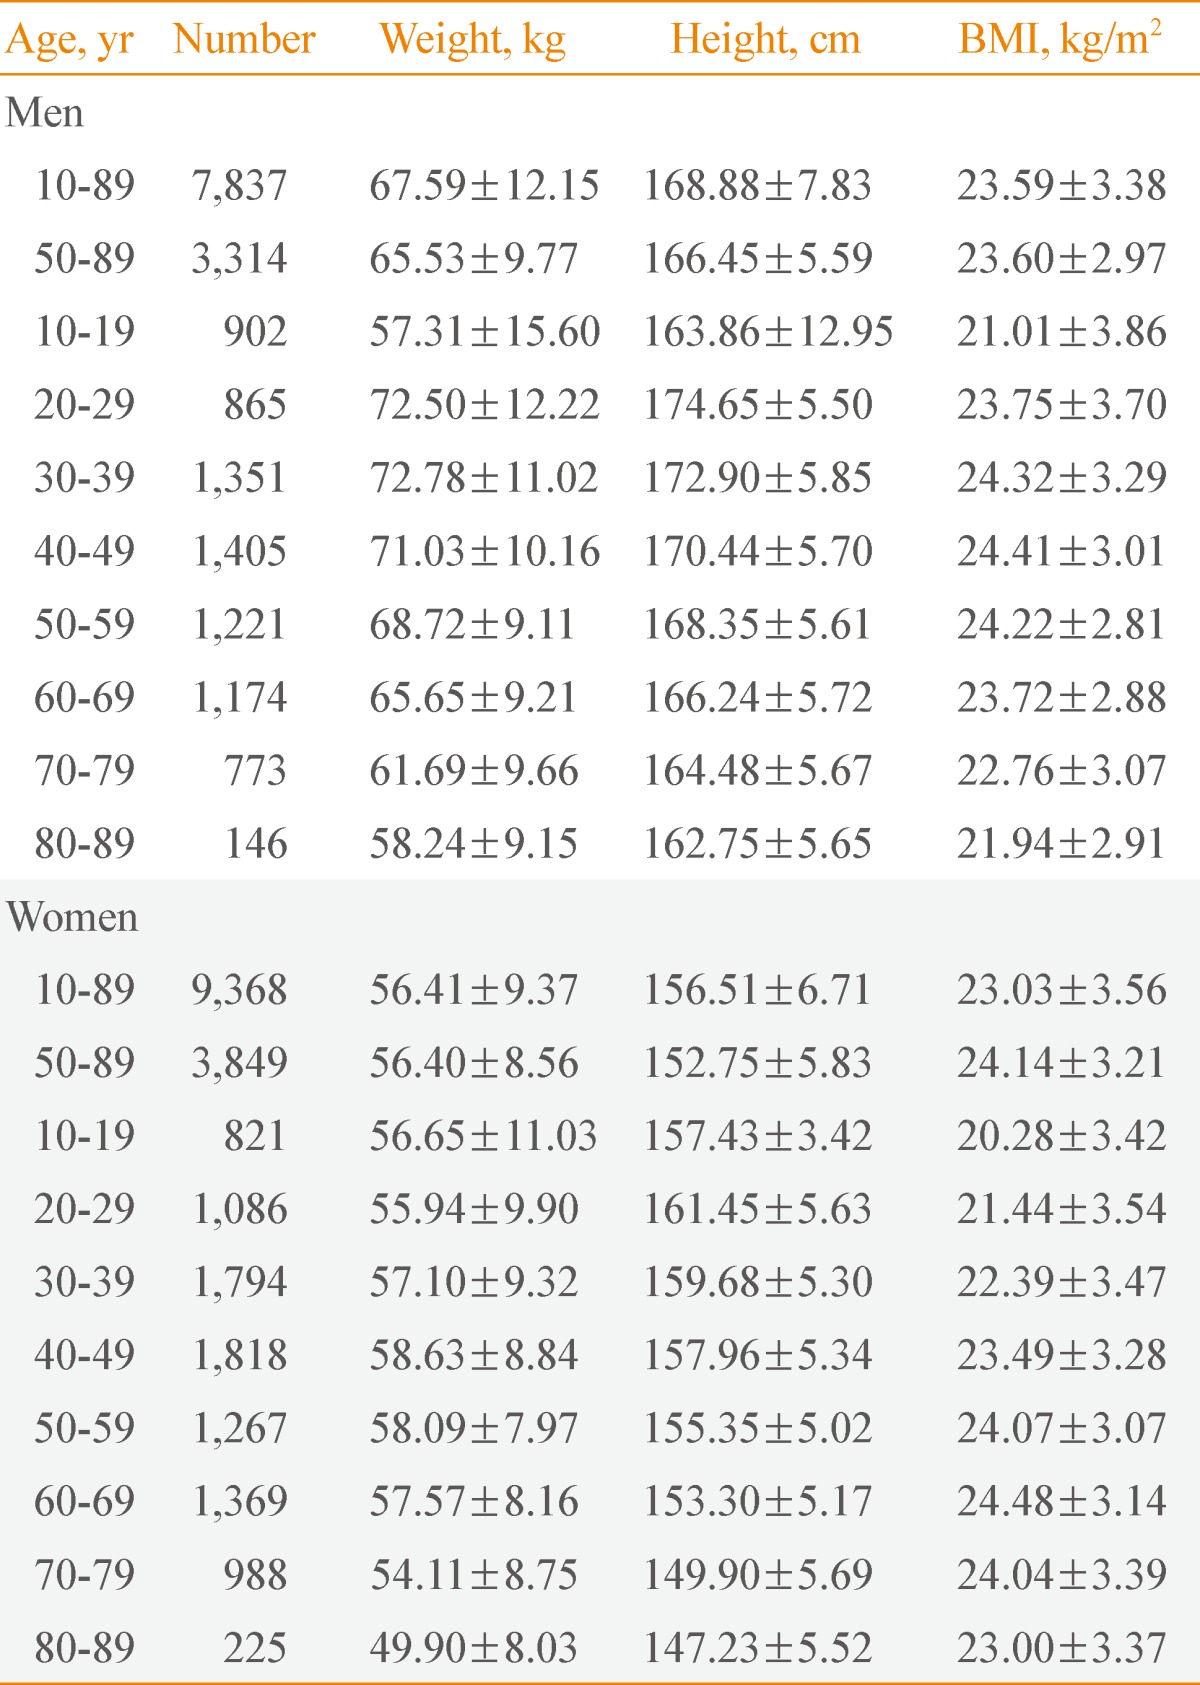
Age-Stratified Anthropometric Characteristics of the Subjects
Mean BMD according to gender and age
For each of the three sites used in the diagnosis of osteoporosis (lumbar spine, total hip, and femoral neck), the mean BMD was analyzed according to gender and age (Table 3). The mean BMD of the total subjects (10 to 89 years) and that of the subjects aged 50 years or higher (50 to 89 years) were higher in the men than in the women for all the three sites. However, when the mean BMD was compared among the age groups (10 year units) according to gender, the mean BMD was not always higher in the men than in the women for all the three sites. The mean BMD of the subjects in their 10s, 30s, and 40s was higher in the women than in the men for the lumbar spine, whereas the mean BMD of the total subjects was higher in men than in women for the total hip and femoral neck.
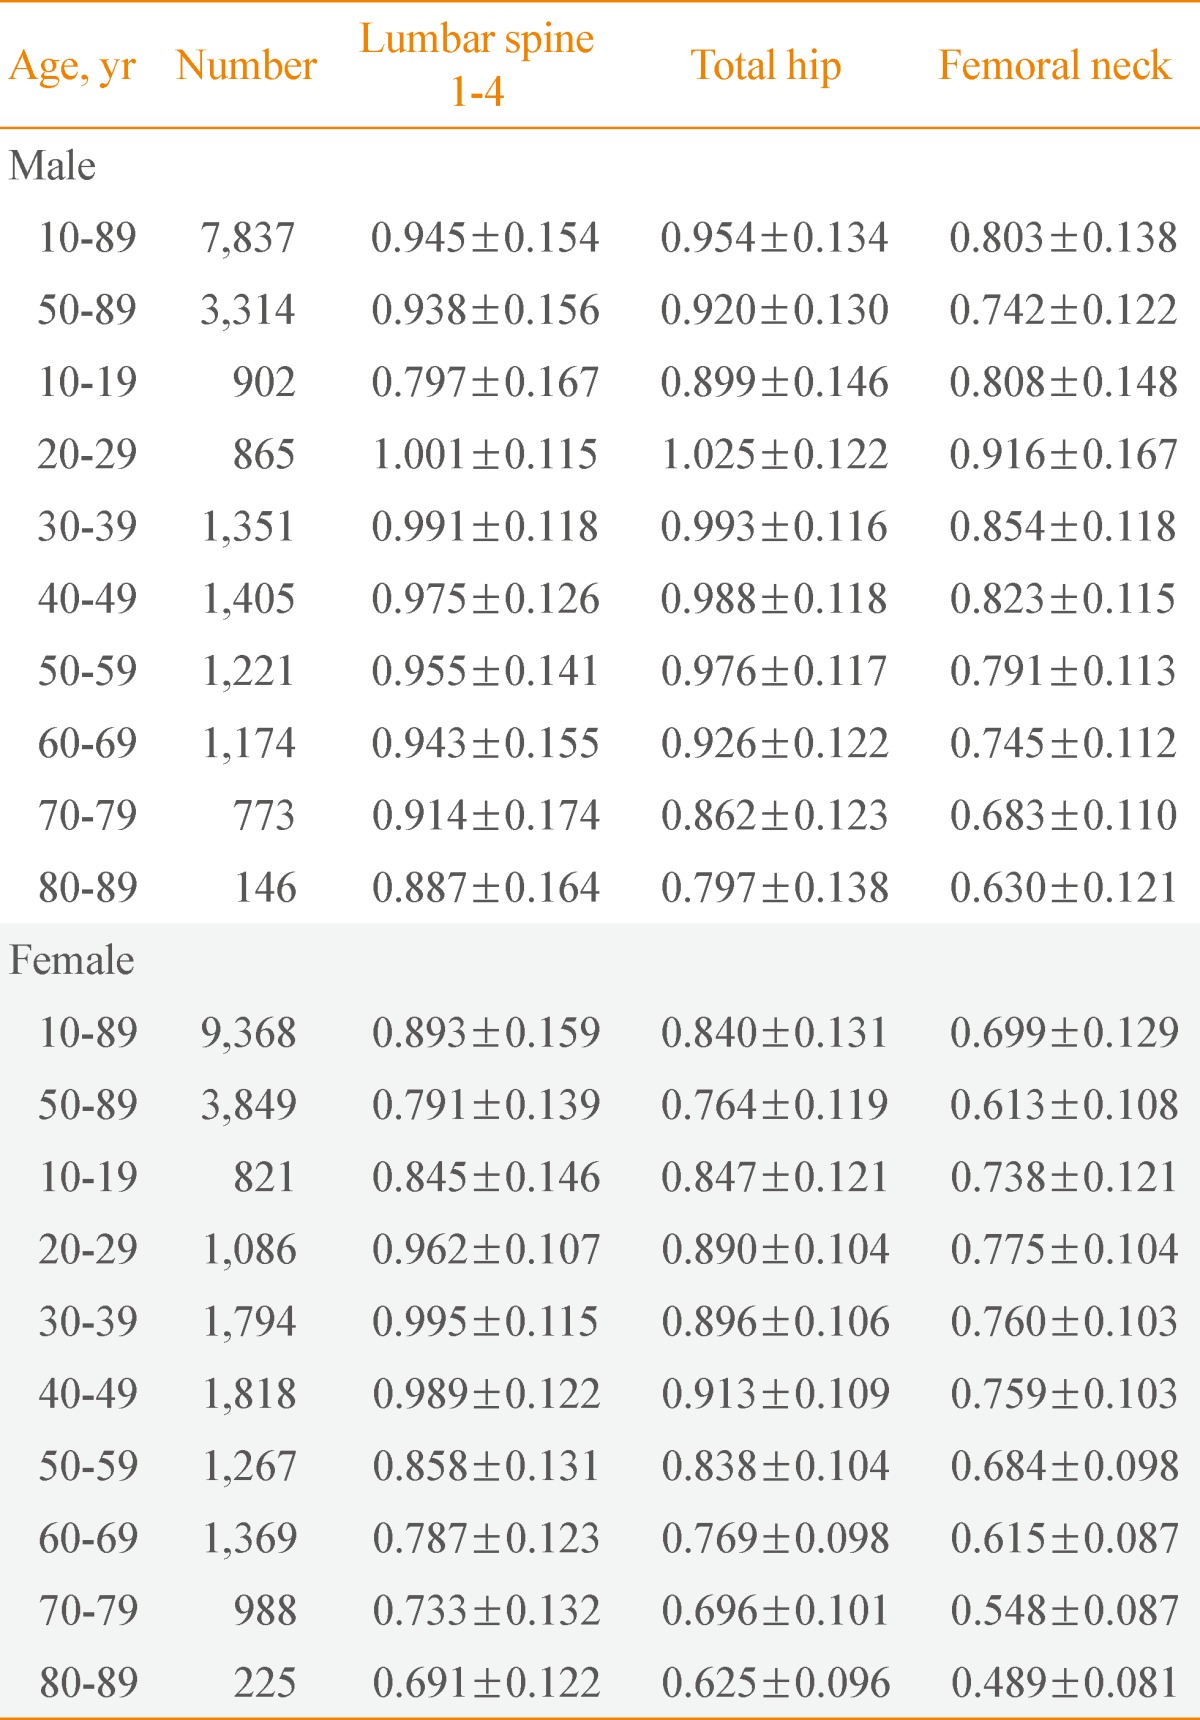
Bone Mineral Density (g/cm2) by Gender and Age Group
The changes in the mean BMD are presented according to the age (10-year units) of men and women (Fig. 1). In the men, the maximal BMD was observed in the subjects in their 20s for all three sites, and the mean BMD continuously decreased as age increased (Fig. 1A). Meanwhile, in the women, the maximal BMD was observed in the different age groups according to skeletal site; in their 20s for the femoral neck, in their 30s for the lumbar spine, and in their 40s for the total hip (Fig. 1B). Unlike the men, the changes in the mean BMD of the women were insignificant for all three sites until their 40s, and the mean BMD began to rapidly decrease after an age bracket of 50 years or over.
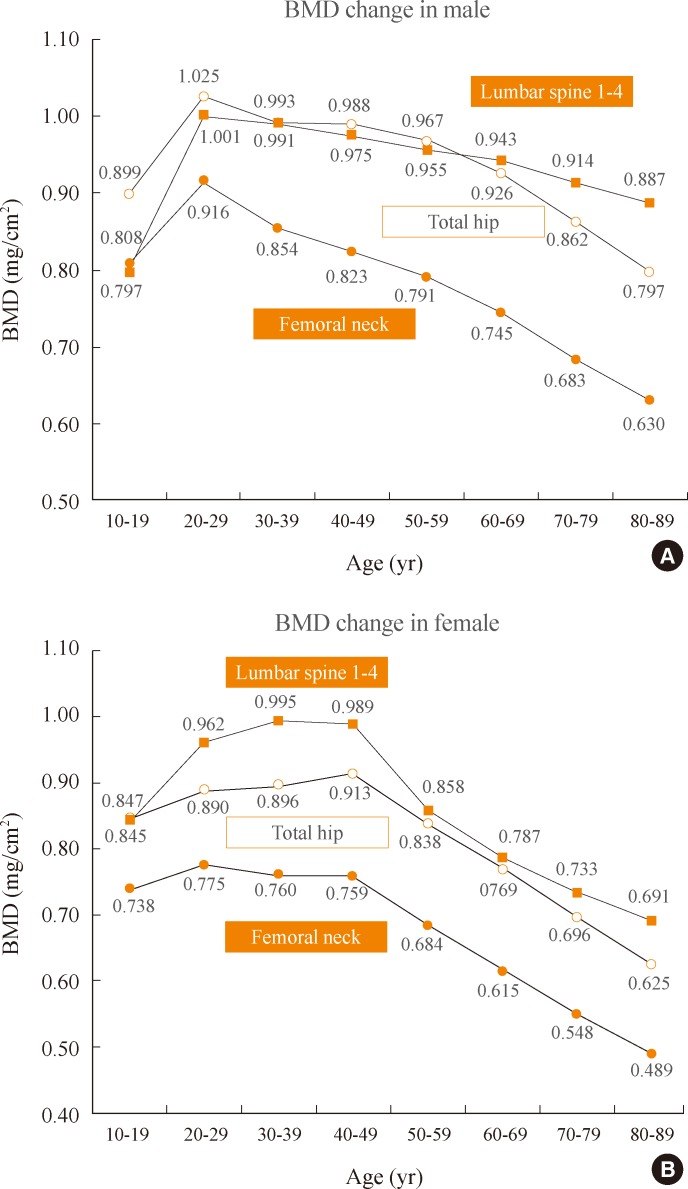
Bone mineral density (BMD) change in the men and women. (A) The graph illustrates the mean BMD change in men. In all measurement sites, it reached a peak BMD at their 20s. From that time onward, mean BMD decreased steadily. (B) In women, the maximal BMD in the femoral neck, lumbar spine, and the total hip was noted in their 20s, 30s, and 40s, respectively. It appeared to level off until the peak BMD in their 40s, and decreased significantly after their 50s.
In the comparison of the maximal BMD among the sites, the mean BMD in men was shown to be 1.025, 1.001, and 0.916 g/cm2 for the total hip, lumbar spine, and femoral neck, respectively (Fig. 1A). Meanwhile, the mean BMD in women was shown to be 0.995, 0.913, and 0.775 g/cm2 for the lumbar spine, total hip, and femoral neck, respectively (Fig. 1B). Thus, the maximal BMD was higher in the men than in the women for all three sites, and in particular, the most significant difference in the maximal BMD found between the men and women was for the femoral neck. In the comparison of the mean BMD among the age groups according to site after the maximal BMD reached the peak, the mean BMD was highest in the lumbar spine, then the total hip, and then the femoral neck in the women. Meanwhile, the mean BMD was similar between the total hip and lumbar spine in the men aged less than 60, but the mean BMD for the total hip rapidly decreased in the men in their 60s or higher, which showed an order of the lumbar spine, total hip, and femoral neck.
Analysis of the difference in the prevalence of osteoporosis according to gender
Based on the lowest T-score among the three sites, a cross-tabulation was conducted on the result of the diagnosis of osteoporosis (normal, osteopenia, osteoporosis) according to gender (any site rows in Table 4). The prevalence of osteopenia was shown to be 48.6% in the men and 48.7% in the women, which were almost identical. Meanwhile, the prevalence of osteoporosis was shown to be 8.8% in the men and 39.1% in the women, an approximately 4.4-fold higher prevalence in the women than in the men. A chi-square test was conducted to see if the prevalence of osteoporosis differed according to gender. The result showed that the prevalence of osteoporosis differed significantly according to gender (P<0.001).
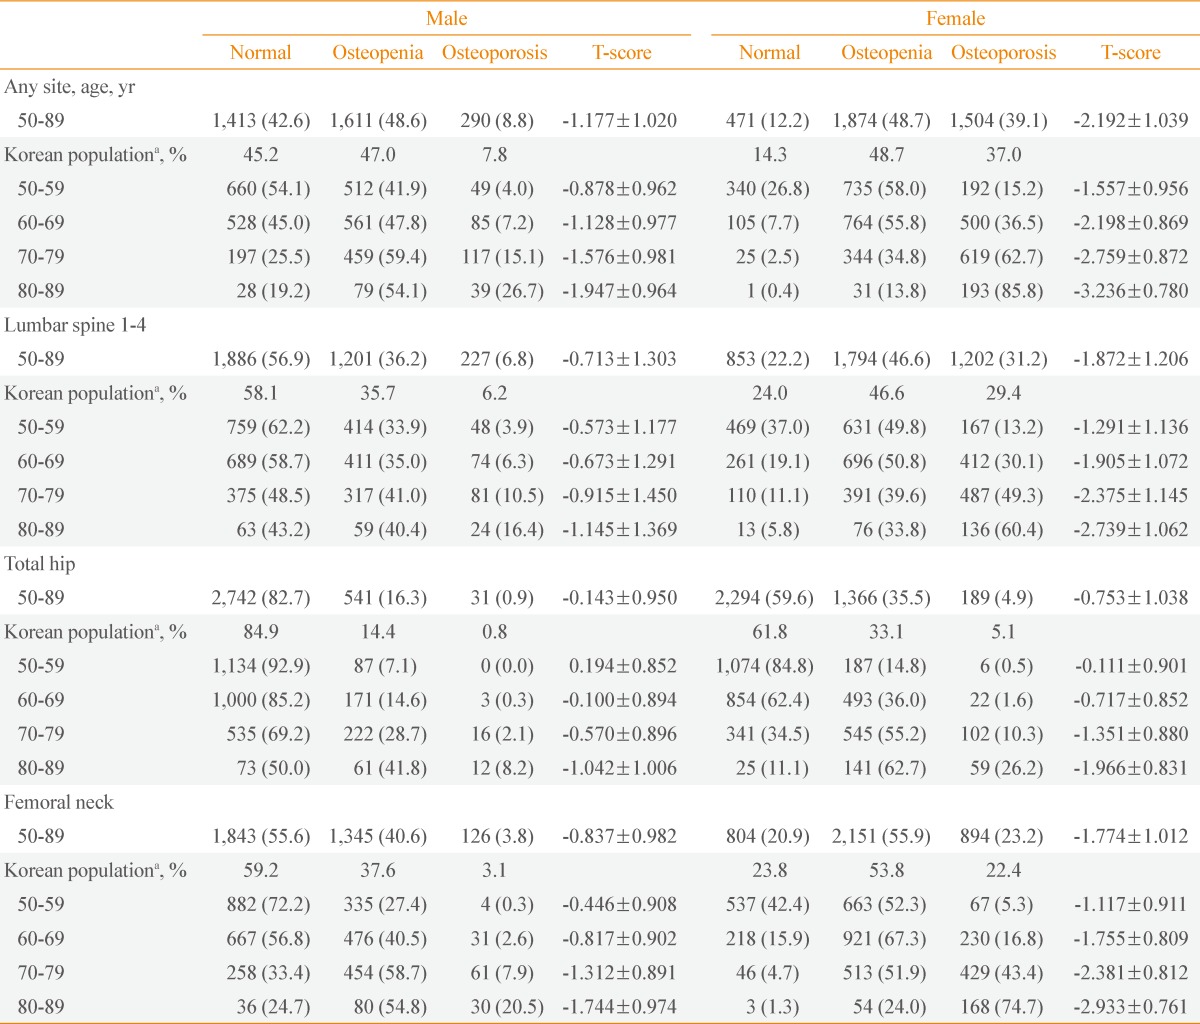
Prevalence of Osteopenia and Osteoporosis by Skeletal Sites
Prevalence of osteoporosis and osteopenia: analysis according to gender, age, and skeletal site
The prevalence of osteoporosis and osteopenia was analyzed according to gender and age (Table 4). In the subjects aged 50 years or higher (50 to 89 years), the prevalence of osteoporosis, which was adjusted based on the age-related population distribution presented in the 2010 population census [22], was 5- to 7-fold higher in the women than in the men depending on the site. In the case where osteoporosis was diagnosed based on the lowest T-score among the three sites (any site rows in Table 4), the prevalence of osteoporosis was 7.8% in the men and 37.0% in the women, which was approximately 5-fold higher in the women than in the men. The adjusted prevalence of osteoporosis in men versus women was 6.2% vs. 29.4% in the lumbar spine, 0.8% vs. 5.1% in the total hip, and 3.1% vs. 22.4% in the femoral neck. In the comparison of the prevalence of osteoporosis among the sites, the prevalence of osteoporosis in the lumbar spine was the highest in both men and women, then in the femoral neck, and then in the total hip.
In the subjects aged 50 years or higher (50 to 89 years), the adjusted prevalence of osteopenia was higher in the women than in the men for all three sites although the difference was not so pronounced as in osteoporosis. In the case where osteopenia was diagnosed based on the lowest T-score among the three sites, the prevalence of osteopenia was 47.0% in the men, which was similar to 48.7% in the women. The adjusted prevalence of osteopenia in men versus women was 35.7% versus 46.6% in the lumbar spine, 14.4% vs. 33.1% in the total hip, and 37.6% vs. 55.8% in the femoral neck. In the comparison of the prevalence of osteopenia among the sites, the prevalence of osteopenia in the femoral neck was the highest in both men and women, then in the lumbar spine, and then in the total hip.
When osteoporosis was diagnosed based on the lowest Tscore according to age group, the prevalence of osteoporosis in the men was 4.0% in their 50s, 7.2% in their 60s, 15.1% in their 70s, and 26.7% in their 80s, whereas the prevalence of osteoporosis in the women was 15.2% in their 50s, 36.5% in their 60s, 62.7% in their 70s, and 85.8% in their 80s. The prevalence of osteoporosis exceeded 60% in the women in their 70s, and it was 1.4-fold higher in the women in their 80s, which showed that eight to nine of 10 women in their 80s were osteoporosis patients. In the comparison of the prevalence of osteoporosis between genders in the same age groups, the prevalence of osteoporosis was approximately 4-fold higher in the women than in the men: 5-fold higher in their 60s and 3-fold higher in their 80s.
When the prevalence of osteoporosis was analyzed according to site, more diverse results were obtained. As for the lumbar spine, the prevalence of osteoporosis in the men was 3.9% in their 50s, 6.3% in their 60s, 10.5% in their 70s, and 16.4% in their 80s, whereas the prevalence of osteoporosis in the women was 13.2% in their 50s, 30.1% in their 60s, 49.3% in their 70s, and 60.4% in their 80s. Thus, more than half of the women in their 70s had osteoporosis in the lumbar spine. The prevalence of osteoporosis in the total hip was the lowest among the three sites in both men and women, and in particular, was less than 2% in the men and women in their 50s and 60s. However, the prevalence of osteoporosis in the total hip increased readily in the men and women in their 70s and 80s, with a prevalence of 8.2% in the men in their 80s and 26.2% in the women in their 80s. The prevalence of osteoporosis in the femoral neck was 0.3% and 5.3% in the men and women in their 50s, respectively, which was lower than that in the lumbar spine. However, the prevalence of osteoporosis in the femoral neck increased the most rapidly in the men and women in their 60s to 80s. As a result, the prevalence of osteoporosis in the femoral neck was 20.5% in the men in their 80s and 74.4% in the women in their 80s, which were higher than in the other two sites in the same age group.
To investigate changes in the prevalence of osteoporosis among the sites according to age, the cumulative prevalence of osteoporosis (the summation of the prevalence of osteoporosis from an age of 50 years to the particular age at an age interval of 1 year) was analyzed for the men and women (Fig. 2). In both men and women, the prevalence of osteoporosis in the lumbar spine increased starting from early 50s, and accounted for the highest proportion among all of the age groups in terms of the cumulative prevalence of osteoporosis. Unlike the lumbar spine, an increase in the prevalence of osteoporosis in the femoral neck significantly differed according to age. The prevalence of osteoporosis in the femoral neck increased starting from the 60s age group in the men, whereas it began to occur in the women in their mid 50s, and rapidly increased in the women in their mid 60s. The prevalence of osteoporosis in the total hip began to increase in both men and women in their 70s, but its proportion was significantly lower compared to the other two sites.
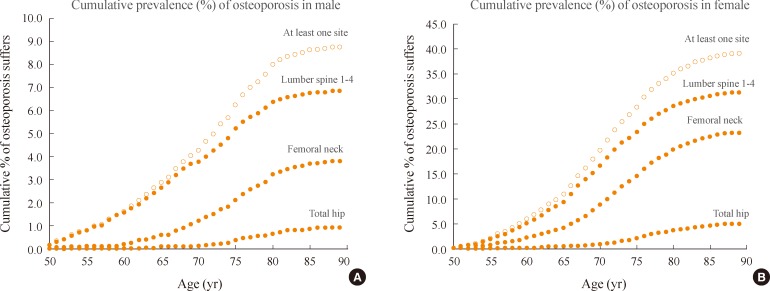
Cumulative prevalence (%) of osteoporosis in men and women. In all age groups and sexes, lumbar spine osteoporosis occurred earliest and was the most frequent site of osteoporosis. (A) The graph shows the prevalence in men. Femoral neck osteoporosis was detected for the first time at the age of 60. (B) In women, Femoral neck osteoporosis started at an age of 55.
DISCUSSION
The results of this study are summarized as follows: 1) when osteoporosis was diagnosed based on the lowest T-score among the lumbar spine, total hip, and femoral neck, the prevalence of osteoporosis was 8.8% and 39.1% in the men and women aged 50 years or higher (50 to 89 years), respectively. When the prevalence of osteoporosis was adjusted considering the population distribution of the 2010 population census and then analyzed, it was 7.8% in the men, but 37% in the women, which was approximately 5-fold higher in the women than in the men. On the other hand, the adjusted prevalence of osteopenia was 47.0% in the men, and 48.7% in the women, which showed no significant difference according to gender; 2) in the comparison of the prevalence of osteoporosis among 10-year age groups from their 50s to 80s, the prevalence of osteoporosis was 4.0% in their 50s, 7.2% in their 60s, 15.1% in their 70s, and 26.7% in their 80s in the men, and 15.2% in their 50s, 36.5% in their 60s, 62.7% in their 70s, and 85.8% in their 80s in the women. Thus, the prevalence of osteoporosis increased by approximately 2-fold as the age of the subjects increased by 10 years in both men and women, and the prevalence of osteoporosis was approximately 4-fold higher in the women than in the men within the same age groups; 3) the maximal BMD was observed in the men in their 20s for all three sites. Meanwhile, the maximal BMD was observed in the women in their 20s for the femoral neck, 30s for the lumbar spine, and 40s for the total hip; and 4) the prevalence of osteoporosis in the lumbar spine began to increase in both men and women in their 50s, and accounted for the highest proportion among the sites in terms of the cumulative prevalence of osteoporosis. Meanwhile, the prevalence of osteoporosis in the femoral neck began to increase in the men in their 60s, whereas it began to increase in the women in their mid-50s, and increased rapidly in the women in their mid-60s.
Many studies have reported that the prevalence of osteoporosis was relatively higher in women than in the men [23,24]. In the comparison of the prevalence of osteoporosis among the sites, the prevalence of osteoporosis was 5- to 7-fold higher in the women than in the men (for the lumbar spine, total hip, and femoral neck, 6.2%, 0.8%, 3.1% in the men vs. 29.4%, 5.1%, 22.4% in the women, respectively). In both men and women, the prevalence of osteoporosis was higher for the lumbar spine, femoral neck, and total hip in that order. When the prevalence of osteoporosis according to site (Fig. 2) was compared with the decreased tendency of the mean BMD (Fig. 1), the opposite result was obtained. In other words, the maximal BMD was observed in the lumbar spine according to age group. Considering that BMD reduction is the most important criteria for osteoporosis, osteoporosis is less likely to occur in the lumbar spine. However, in fact, osteoporosis occurs more frequently in the lumbar spine compared to other sites. This contradictory result is closely associated with the maximal BMD and reference value in young patients (Fig. 1). The reference value is also higher in the lumbar spine than in the other sites. As the numerator of T-score is the difference between the patient's BMD and the reference value, a lower T-score in the lumbar spine than in the other sites is calculated if the reference value is higher in the lumbar spine than in the other sites. Thus, the mean BMD is higher in the lumbar spine than in the other sites according to age group, but the prevalence of osteoporosis is the highest in the lumbar spine. This indicates that the determination of the reference value for the T-score calculation is important for the calculation of the prevalence of osteoporosis. In the comparison of the prevalence of osteoporosis in the lumbar spine according to age group in their 50s to 80s (10-year units), the prevalence of osteoporosis was higher in the lumbar spine than in the femoral neck in both men and women of the same age group (Table 4). This tendency was also shown by the mean T-score for each age group. The mean T-score was lower in the lumbar spine than in the other two sites in both men and women in their 50s. However, the change in the increased prevalence of osteoporosis was higher in the femoral neck than in the lumbar spine in both men and women as the age of the subjects increased. Thus, the prevalence of osteoporosis was the highest in the subjects in their 80s. The mean Tscore of the femoral neck was the lowest in the subjects in their 80s. This result indicates that the prevalence of osteoporosis in the femoral neck rapidly increases as age increases. In particular, in the subjects in their 60s, the prevalence of osteoporosis in the femoral neck was 16.8% in the women, which was 7-fold higher than the 2.6% in the men. This difference in the subjects in their 60s was high compared to a 4-fold difference in their 70s and a 3-fold different in their 80s. This is attributable to the fact that the BMD of the femoral neck rapidly decreases in menopausal women in their 50s (Fig. 1B). The difference in the prevalence of osteoporosis in the femoral neck between the men and women is better illustrated in Fig. 2. In the women, the prevalence of osteoporosis in the femoral neck began to increase in their 50s, and rapidly increased after an age of 65 years (Fig. 2B). Meanwhile, in the men, the prevalence of osteoporosis in the femoral neck began to increase in their 60s, and steadily increased over time (Fig. 2A). This difference in the prevalence of osteoporosis between genders is explained by the difference in estrogen reduction according to gender [25].
As most previous studies on the prevalence of osteoporosis were conducted on subjects in particular regions, a resulting nation-wide study was not obtained. The prevalence of osteoporosis was adjusted considering the difference in the reference value or device used to measure BMD in order to compare with that of previous studies (Table 5). In the comparison of the prevalence of osteoporosis between this nation-wide study and two other previous region-based studies [8,9], a significant difference was found. In a study that was conducted on the men in Namwon, the prevalence of osteoporosis was 6.5% in the lumbar spine and 5.9% in the femoral neck. In a study that was conducted on subjects in Ansung, the prevalence of osteoporosis was 7.3% in the lumbar spine and 6.0% in the femoral neck when the reference value used in the Namwon study was used. A Lunar device was used in these two studies. Thus, in comparison with the prevalence of osteoporosis that was adjusted according to device and reference value (4.0% vs. 7.3%), the prevalence of osteoporosis was higher in the lumbar spine and lower in the femoral neck. Meanwhile, in the study that was conducted on the women living in Namwon, the prevalence of osteoporosis was 40.1% in the lumbar spine and 12.4% in the femoral neck. In the study that was conducted on subjects living in Ansung, the prevalence of osteoporosis was 42.1% in the lumbar spine and 13.0% in the femoral neck when the reference value used in the Namwon study was used. Thus, in comparison with the adjusted prevalence of osteoporosis of this study (34.7% vs. 20.2%), the prevalence of osteoporosis was higher in the lumbar spine and lower in the femoral neck.
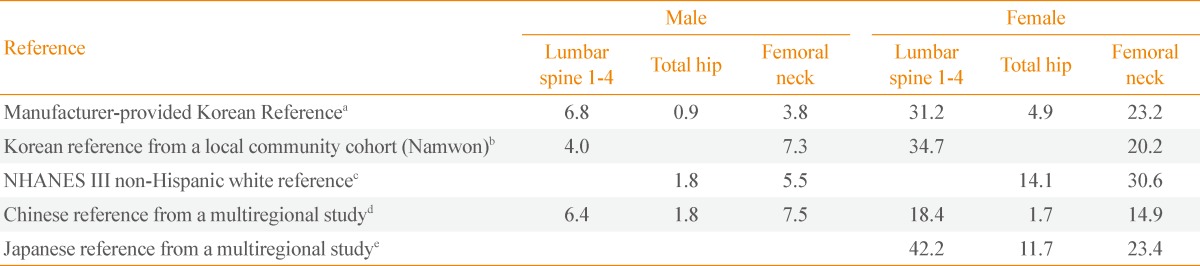
Prevalence of Osteoporosis according to the Reference Value
On the other hand, the result of a nation-wide study that analyzed the prevalence of osteoporosis based on the data of the KNHANES 2008 to 2009 was similar to that of this study [12]. The prevalence of osteoporosis was 7.5% and 35.5%, in the men and women, respectively, which were slightly lower than the result of this study (8.8% vs. 39.1%) [12]. However, because Choi et al. [12] focused on the difference between the prevalence and recognition rate of osteoporosis in their study, it did not analyze the change in the prevalence of osteoporosis by diagnosed site of osteoporosis (lumbar spine, total hip, femoral neck) according to age in detail. Furthermore, osteopenia was poorly studied, and the standardized prevalence of osteoporosis considering the actual population distribution was not presented in that study. In this study, the topics that were not touched upon in the previous study were analyzed and resulted in a change in the prevalence of osteoporosis and osteopenia by diagnosed site of osteoporosis (lumbar spine, total hip, femoral neck) according to gender and age. When the prevalence of osteoporosis was compared between Korea and other countries based on the results of this study, the domestic prevalence of osteoporosis was higher than that of United States in both men and women. In the United States study, the prevalence of osteoporosis in the lumbar spine and femoral neck was 2.5% and 2.1%, respectively, in the men, and 10.8% and 8.9%, respectively, in the women [24]. When the domestic prevalence of osteoporosis (male, 5.5%; female, 30.6%) was adjusted using the reference value of non-Hispanic white women reported in the NHANES III, and then compared, the prevalence of osteoporosis in the men and women was 2- and 3-fold higher, respectively, in Korea than in United States (2.1% vs. 5.5% in men; 8.9% vs. 30.6% in women). In the case of Chinese men, the prevalence of osteoporosis was 5.4%, 3.8%, and 6.3% in the lumbar spine, total hip, and femoral neck, respectively [18]. In the comparison between Korea (6.4%, 1.8%, and 7.5%) and China after adjusting the reference value, the prevalence of osteoporosis in two of the three sites was higher in Korean men than in Chinese men (excluding the total hip). Meanwhile, the prevalence of osteoporosis was 28% in Chinese women [19], which was lower than the domestic prevalence of 31.2% before adjustment and higher than the domestic prevalence of 18.4% after adjustment. In the case of Japanese women, the prevalence of osteoporosis in the lumbar spine, total hip, and femoral neck was 38%, 15.3%, and 11.6%, respectively [20]. When the prevalence of osteoporosis in Japanese women was compared with the domestic prevalence (42.2%, 11.7%, and 23.4%) after adjustment, the prevalence of osteoporosis in two sites (excluding the total hip) was higher in the Korean women than in the Japanese women.
This study has a few limitations. First, although it may be suitable to investigate the prevalence of osteoporosis as a crosssectional study at a specific period of time, it is limited in investigating changes in BMD or prevalence of osteoporosis according to age. Second, this study is meaningful in that the analysis was conducted based on the data of the nation-wide KNHANES. However, a region-based analysis was not conducted in this study making it is difficult to directly compare the results of this study with those of previous region-based studies. Accordingly, the adjusted prevalence of osteoporosis based on the reference value used in the previous region-based studies was presented in this study. Third, a Hologic device was used to measure BMD in the KNHANES. Thus, the results of this study may differ from those of studies using a Lunar device. Although the prevalence of osteoporosis was adjusted using the equation of BMD conversion between devices to overcome this problem, the equation is limited in that it was applied between devices of specific models. Fourth, in this study, the normal reference value for calculating the T-score, which was provided by the manufacturer of the BMD-measuring device, was used. As the selection of the reference value affects the calculation of the prevalence of osteoporosis, the prevalence of osteoporosis in the non-Hispanic white women reported in the United States NHANES III has been recently recommended as the reference value [16,26-28]. Unfortunately, no definite guideline on the reference value for the diagnosis of osteoporosis has been established in Korea, which will require the consideration of medical and socioeconomic influences [29]. Finally, in this study, the relationship between the site-related prevalence of osteoporosis considering subjects who showed variation in BMD status according to site and the total prevalence of osteoporosis was not analyzed. Thus, a further study is required to investigate inconsistencies among the diagnostic sites.
ACKNOWLEDGMENTS
This research was supported by the Hallym University Research Fund, 2013 (HRF-201303-011).
Notes
No potential conflict of interest relevant to this article was reported.