
Articles
- Page Path
- HOME > Endocrinol Metab > Volume 37(3); 2022 > Article
-
Original ArticleCalcium & Bone Metabolism Bone Mineral Density Screening Interval and Transition to Osteoporosis in Asian Women
 Keypoint
This study aimed to evaluate the estimated time interval for screening osteoporosis. We conducted a study of 6,385 subjects aged 50 years and older who underwent dual-energy X-ray absorptiometry screening more than twice in routine health checkups. The baseline T-score was important for determining the next bone mineral density (BMD) screening test interval. Repeat BMD testing within 5 years provides little benefit as a screening method in mild osteopenia, but rescreening within 1.5 years is recommended in severe osteopenia even when patients are younger than 65 years. -
Hyunju Park1
 , Heera Yang1, Jung Heo1, Hye Won Jang2, Jae Hoon Chung1, Tae Hyuk Kim1, Yong-Ki Min1, Sun Wook Kim1
 -
Endocrinology and Metabolism 2022;37(3):506-512.
DOI: https://doi.org/10.3803/EnM.2022.1429
Published online: June 9, 2022
1Division of Endocrinology and Metabolism, Department of Medicine, Samsung Medical Center, Sungkyunkwan University School of Medicine, Seoul, Korea
2Department of Medical Education, Sungkyunkwan University School of Medicine, Seoul, Korea
- Corresponding author: Sun Wook Kim. Division of Endocrinology and Metabolism, Department of Medicine, Thyroid Center, Samsung Medical Center, Sungkyunkwan University School of Medicine, 81 Irwon-ro, Gangnam-gu, Seoul 06351, Korea Tel: +82-2-3410-1653, Fax: +82-2-6918-4653, E-mail: swkimmd@skku.edu
Copyright © 2022 Korean Endocrine Society
This is an Open Access article distributed under the terms of the Creative Commons Attribution Non-Commercial License (http://creativecommons.org/licenses/by-nc/4.0/) which permits unrestricted non-commercial use, distribution, and reproduction in any medium, provided the original work is properly cited.
ABSTRACT
-
Background
- Bone mineral density (BMD) testing is indicated for women aged 65 years, but screening strategies for osteoporosis are controversial. Currently, there is no study focusing on the BMD testing interval in Asian populations. The current study aimed to evaluate the estimated time interval for screening osteoporosis.
-
Methods
- We conducted a study of 6,385 subjects aged 50 years and older who underwent dual-energy X-ray absorptiometry screening more than twice at Samsung Medical Center as participants in a routine health checkup. Subjects were divided based on baseline T-score into mild osteopenia (T-score, <–1.0 to >–1.5), moderate osteopenia (T-score, ≤–1.5 to >–2.0), and severe osteopenia (T-score, ≤–2.0 to >–2.5). Information about personal medical and social history was collected by a structured questionnaire.
-
Results
- The adjusted estimated BMD testing interval for 10% of the subjects to develop osteoporosis was 13.2 years in mild osteopenia, 5.0 years in moderate osteopenia, and 1.5 years in severe osteopenia.
-
Conclusion
- Our study provides extended information about BMD screening intervals in Asian female population. Baseline T-score was important for predicting BMD screening interval, and repeat BMD testing within 5 years might not be necessary in mild osteopenia subjects.
- Osteoporosis is a bone disease characterized by low bone mass and micro-architectural deterioration of bone tissue, increasing the risk of bone fragility and fracture [1]. The estimated prevalence of osteoporosis in the United States was 15.4% in females 50 years of age and older [2]. According to a nationwide survey, the prevalence of osteoporosis in Korea was 38.0% in the same age group of women [3].
- Bone mineral density (BMD) screening using central dualenergy X-ray absorptiometry (DXA) is the gold standard for diagnosis of osteoporosis [4,5]. The World Health Organization (WHO) defines osteoporosis as a BMD at the hip or spine of 2.5 standard deviations (SD) below the mean bone density of a reference population of young healthy women [6]. A T-score between <–1.0 and >–2.5 is defined as osteopenia. Osteoporosis management guidelines recommend screening for osteoporosis in females 65 years of age and older and in postmenopausal women younger than 65 years with a risk of osteoporosis [4,5,7]. Additionally, the U.S. Preventive Services Task Force suggested no advantage to repeat BMD from 4 to 8 years after initial screening [8]. The prevalence of osteoporosis varies by race and ethnicity, and there were marked variations in probability of major osteoporotic fractures [9]. Considering that BMD is influenced by geography, diet, and other lifestyle factors [10], investigation for estimating time to repeat BMD in an Asian female population is needed. Herein, we evaluated the BMD testing interval for rescreening to predict osteoporosis in South Korean females 50 years of age and older.
INTRODUCTION
- Study population
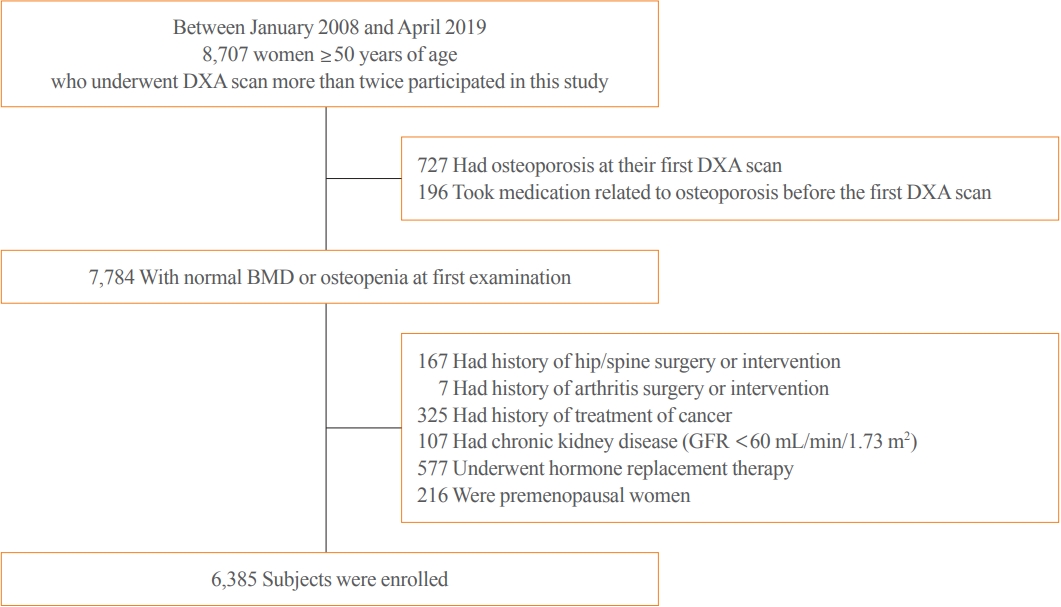
- Between January 2008 and April 2019, a total of 8,707 female subjects aged 50 years and older who underwent DXA more than twice at the Health Promotion Center at Samsung Medical Center participated in this study. The participants were voluntarily tested as part of their regular health checkup. Subjects who were excluded from the study included those with osteoporosis at their first DXA (n=727), those that took medication related to osteoporosis before the first DXA (n=196), those with history of hip or spine surgery or intervention (n=167), those with history of arthritis surgery or intervention (n=7), those with history of cancer treatment (n=325), those with chronic kidney disease with estimated glomerular filtration rate under 60 mL/min/1.73 m2 (n=107), those currently using hormone replacement therapy (n=577), and those who were premenopausal (n=216). Therefore, 6,385 subjects were included in the present study. Personal medical history, smoking status, alcohol consumption status, and medications were assessed using a structural questionnaire at the first medical checkup. This study was approved by the Institutional Review Board of Samsung Medical Center (IRB no. 2020-04-063), and written informed consent was waived owing to the retrospective nature of the study.
- BMD measurement and outcome
- BMD was measured at the lumbar spine (L1–L4) and proximal femur by DXA. All enrolled patients were tested for BMD more than twice through the study period. DXA was performed by Lunar machines (Lunar Prodigy Advance, GE Healthcare Ltd., Madison, WI, USA). All BMD measurements were performed using a standard protocol. Quality assurance assessment was performed regularly according to the manufacturer’s recommendation.
- Based on WHO classification criteria, we defined a T-score ≤–2.50 SD, a T-score between <–1.0 SD and >–2.5 SD, and a T-score ≥–1.00 as osteoporosis, osteopenia, and normal, respectively. As we excluded subjects with osteoporosis, the baseline for each enrolled participant was normal or osteopenia. To investigate the progression of decreased bone density over time, we classified subjects into four groups based on lowest T-score at the femoral neck, femur total, or lumbar spine as normal BMD (T-score, ≥–1.00), mild osteopenia (T-score, <–1.0 to >–1.5), moderate osteopenia (T-score, ≤–1.5 to >–2.0), or severe osteopenia (T-score, ≤–2.0 to >–2.5). The primary outcome of this study was estimated time for 10% of the subjects to progress from osteopenia to osteoporosis in each group.
- Statistical analysis
- Descriptive statistics were presented as mean±SD or median and interquartile range (IQR). Categorical variables were presented as frequencies (percentages). The parametric cumulative incidence curves for the time to osteoporosis were estimated from log-normal regression models. Results were adjusted for the clinical risk factors of osteoporosis of age and body mass index (BMI) and presented as relevant ranges of specific values. Statistical analysis was executed using SAS Analytics Software version 9.4 (SAS Institute, Cary, NC, USA).
METHODS
- Baseline characteristics
- Details of selection of the analytic cohort are described in Fig. 1. A total of 6,385 females 50 years of age and older were enrolled, and baseline characteristics of the subjects are described in Table 1. Mean±SD age was 57.5±5.6 years and BMI was 23.3±2.8 kg/m2. Among the enrolled subjects, 1.6% were current smokers, and 32.4% were current drinkers. Baseline median T-score was –1.1 (IQR, –0.4 to –1.7), and median follow-up duration was 67 months (IQR, 37 to 85). Among 6,385 subjects, 2,734 (42.8%) who were normal, 1,425 (22.3%) with mild osteopenia, 1,311 (20.5%) with moderate osteopenia, and 915 (14.3%) with severe osteopenia were enrolled.
- Estimated BMD testing intervals
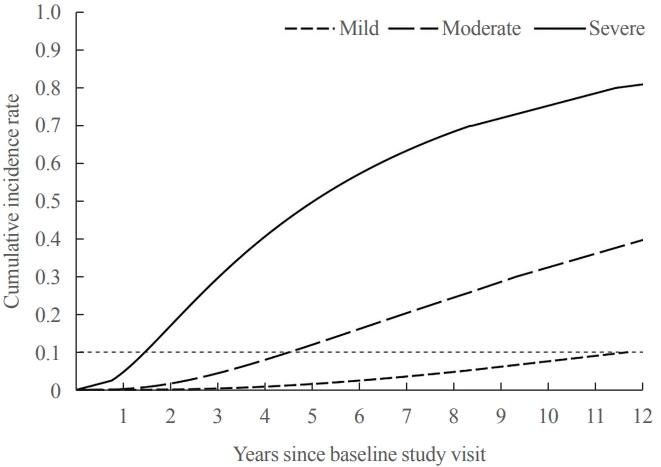
- During the mean±SD follow-up of 5.1±2.2 years, 622 subjects developed osteoporosis from normal or osteopenia. Among the 622 subjects, there were three normal, 30 with mild osteopenia, 170 with moderate osteopenia, and 419 with severe osteopenia at baseline. We assessed the time for 10% of female subjects to progress to osteoporosis (Fig. 2). Age and BMI were the only significant predictors in the final model. After adjustment for age and BMI, the estimated time for 10% of subjects to progress to osteoporosis was 13.2 years for mild osteopenia, 5.0 years for moderate osteopenia, and 1.5 years for severe osteopenia (Table 2). We could not estimate the time for 10% of subjects to transition to osteoporosis in the normal group because of the low incidence of osteoporosis.
- Predicted time for 10% of a given age group to develop osteoporosis
- We assessed the time for 10% of the subjects to progress to osteoporosis according to age at BMI between 21.9 and 23.2 kg/m2. The estimated time for the transition from osteopenia to osteoporosis was longer with older age in the mild and moderate groups (Table 3). Among subjects with severe osteopenia, estimated intervals were close to 1 year in all age groups.
RESULTS
- In this large population-based study of 6,385 Korean female subjects aged 50 years and older, the estimated time for 10% of subjects to progress to osteoporosis was 13.2 years in mild osteopenia, 5.0 years in moderate osteopenia, and 1.5 years in severe osteopenia. The baseline T-score was important in determining rescreening intervals, which is consistent with previous studies [11-13].
- BMD is a vital component in diagnosis and treatment of osteoporosis [5,14], and proper management of osteoporosis is important to reduce fracture-related morbidity and mortality [4,15]. Although the longitudinal loss of BMD is a risk factor for fracture [16-18], frequent BMD testing is unlikely to improve fracture prediction [13,19]. Currently, there was no consensus about the value and optimal timing of repeat BMD in patients with osteopenia [4,5]. To determine the rescreening interval of BMD, several studies have evaluated the direct effect of screening for osteoporosis [11-13]. However, these studies were investigated mostly in Western populations and in populations primarily age 65 years and older. Considering that risk of fracture varies among populations [6,10,20], investigation about screening intervals in Asian populations is needed. This study, to our knowledge, is the first to estimate the time interval from osteopenia to osteoporosis in healthy Asian female subjects.
- In Japan, BMD testing is offered every 5 years for women 40 to 70 years old to screen for osteoporosis under the Health Promotion Law in Japan [21]. Most of the previous results about time from osteopenia to osteoporosis were evaluated in elderly populations [11-13], and there has been no study on whether the screening interval of 5 years is appropriate at that age. Our study provides evidence for screening intervals for women aged 50 and older, which is a younger population than previously studied.
- Except in Japan, BMD testing is recommended mainly based on WHO guidelines for; females aged 65 years and older, postmenopausal women younger than 65 years with risk of fracture, and perimenopausal women with clinical risk factors [6]. In Korea, indication for BMD testing is the same as that of the WHO [7], but many people undergo BMD testing as a part of a routine health checkup regardless of cost-effectiveness. The results of our study revealed a small chance of progression to osteoporosis before 10 years in those with baseline T-score >–1.5. Thus, subjects who had normal BMD or mild osteopenia might not need to undergo as frequent BMD testing considering the cost-effectiveness.
- Many clinical risk factors for osteoporotic fracture have been identified [22-24]. Thus, we adjusted for some confounding clinical factors. For smoking and alcohol consumption statuses, we assessed the robustness of missing variables using four methods: excluding subjects with missing values, treating missing values as current smoker and current drinker, treating missing values as non-smoker and non-drinker, and substituting missing values in a proportion of current smoking (or current drinker) or non-smoking (non-drinker) subjects. We adjusted for age, BMI, smoking status, and alcohol status using the above four models, and only age and BMI were found to be significant factors in each of the four models. However, we could not adjust for glucocorticoid use, which is an important confounding factor in osteoporosis. Questionnaires did not include information on steroid use; thus, we could not obtain this information. Also, we could not obtained vitamin D level in all subjects. Of 6,385 subjects, only 195 subjects had 25-OH vitamin D level, and the median was 18.7 ng/mL (IQR, 13.3 to 25.0).
- We estimated the average time to osteoporosis based on age at a given BMI. The average BMI in the Korean female population aged more than 50 years was 23 kg/m2, which was used as the reference value [25]. Unexpectedly, shorter testing intervals were observed in younger patients in the mild and moderate osteopenia groups. Among the enrolled subjects, 69.0% in the mild osteopenia group and 61.5% in the moderate osteopenia group were younger than 60 years. In other words, a relatively small proportion of subjects older than 60 years was included in the mild or moderate osteopenia group in this study. Those subjects can be expected, on average, to be healthier than subjects who had severe osteopenia or osteoporosis even though they are the same age. This might have created a healthy user bias [26], and the results of the study should be interpreted within the context of some potential limitations.
- The strength of this study was its large sample size and inclusion of subjects between 50 and 65 years, which is a younger population compared to previous studies. Thus, we provide extended information about osteoporosis screening interval in females younger than 65 years. The results of this study will assist clinicians’ decision-making in the real-world setting.
- However, this study also had several limitations. The participants underwent health checkups in a single tertiary hospital; thus, the results might not be generalizable to the entire Korean population. Samsung Medical Center is located in the metropolitan area of Seoul, which is the largest city in South Korea. Thus, the possibility of selection bias cannot be excluded. Second, the T-score difference between 1.4 and 1.6 is within the error range of the test’s precision. However, we categorized patients with T-scores of 1.4 and 1.6 into mild osteopenia and moderate osteopenia, respectively. Because categorical analysis was used in this study, a large difference occurred in the time until osteoporosis development (13.2 years vs. 5.0 years) between T-scores of 1.4 and 1.6. Third, we could not evaluate the potential benefit of rescreening BMD to predict fracture risk. Several clinical risk factors for fracture should be considered when determining the follow-up period of BMD screening, including variables in the Fracture Risk Assessment Tool (FRAX) such as baseline estrogen use status, any fracture after age 50 years, use of oral glucocorticoids, and self-reported rheumatoid arthritis. Since the National Osteoporosis Foundation (NOF) recommends initiation of treatment when the 10-year hip fracture probability is ≥3% or the 10-year major osteoporosis-related fracture probability is ≥20% based on FRAX in patients with osteopenia (T-score between –1.0 and –2.5) [5], clinical judgment should be incorporated when determining the optimal follow-up period for BMD screening. Furthermore, this study was conducted in relatively young subjects, which might be a limitation when applying these results to elderly patients. Clinicians should consider patients’ individual clinical situation and fracture risk. Additional prospective studies are needed.
- In conclusion, baseline T-score was important for determining the next BMD screening test interval. Repeat BMD testing within 5 years provides little benefit as a screening method in mild osteopenia, but rescreening within 1.5 years is recommended in severe osteopenia even when patients are younger than 65 years. Identification of high-risk subjects who require repeat BMD testing might be essential in providing cost-effective care.
DISCUSSION
-
CONFLICTS OF INTEREST
No potential conflict of interest relevant to this article was reported.
-
AUTHOR CONTRIBUTIONS
Conception or design: Y.K.M., S.W.K. Acquisition, analysis, or interpretation of data: H.P., H.Y., J.H., H.W.J., J.H.C., T.H.K. Drafting the work or revising: H.P. Final approval of the manuscript: H.P., H.Y., J.H., H.W.J., J.H.C., T.H.K., Y.K.M., S.W.K.
Article information
-
Acknowledgements
- The authors would like to express special thanks to Ms. Heejin Yoo, and Dr. Seonwoo Kim for their contribution for the statistical analysis for this study.
| Characteristic | Subjects (n=6,385) |
|---|---|
| Age, yr | 57.5±5.6 |
| Height, cm | 157.3±4.8 |
| Body weight, kg | 57.8±7.3 |
| BMI, kg/m2 | 23.3±2.8 |
| Smoking | |
| Current smoker | 100 (1.6) |
| None/ex-smoker | 5,718 (89.6) |
| No response | 567 (8.9) |
| Alcohol | |
| Current drinker | 2,068 (32.4) |
| None | 3,855 (60.4) |
| No response | 462 (7.3) |
| HRT | |
| None | 2,410 (37.7) |
| No response | 3,975 (62.3) |
| Menopause | |
| Yes | 5,036 (78.9) |
| No response | 1,349 (21.1) |
| Hypertension | |
| Yes | 1,462 (22.9) |
| No | 4,636 (72.6) |
| No response | 287 (4.5) |
| Dyslipidemia | |
| Yes | 1,326 (20.8) |
| No | 4,572 (71.6) |
| No response | 487 (7.6) |
| Diabetes | |
| Yes | 308 (4.8) |
| No | 5,790 (90.7) |
| No response | 287 (4.5) |
| Baseline hemoglobin A1c, %a | 5.6 (5.4 to 5.9) |
| Baseline T-score | –1.1 (–0.4 to –1.7) |
| Initial BMD status | |
| Normal | 2,734 (42.8) |
| Mild | 1,425 (22.3) |
| Moderate | 1,311 (20.5) |
| Severe | 915 (14.3) |
| Follow-up duration, mo | 67 (37 to 85) |
| Variable |
95% Confidence interval |
||
|---|---|---|---|
| Mild, yr | Moderate, yr | Severe, yr | |
| Unadjusted | 11.7 (9.2–14.9) | 4.5 (4.2–4.9) | 1.5 (1.3–1.6) |
| Adjusteda | 13.2 (9.9–17.6) | 5.0 (4.5–5.5) | 1.5 (1.4–1.6) |
- 1. Office of the Surgeon General (US). Bone health and osteoporosis: a report of the Surgeon General. Rockville: Office of the Surgeon General (US); 2004.
- 2. Wright NC, Looker AC, Saag KG, Curtis JR, Delzell ES, Randall S, et al. The recent prevalence of osteoporosis and low bone mass in the United States based on bone mineral density at the femoral neck or lumbar spine. J Bone Miner Res 2014;29:2520–6.ArticlePubMedPMC
- 3. Park EJ, Joo IW, Jang MJ, Kim YT, Oh K, Oh HJ. Prevalence of osteoporosis in the Korean population based on Korea National Health and Nutrition Examination Survey (KNHANES), 2008-2011. Yonsei Med J 2014;55:1049–57.ArticlePubMedPMC
- 4. US Preventive Services Task Force, Curry SJ, Krist AH, Owens DK, Barry MJ, Caughey AB, et al. Screening for osteoporosis to prevent fractures: US Preventive Services Task Force recommendation statement. JAMA 2018;319:2521–31.ArticlePubMed
- 5. Cosman F, de Beur SJ, LeBoff MS, Lewiecki EM, Tanner B, Randall S, et al. Clinician’s guide to prevention and treatment of osteoporosis. Osteoporos Int 2014;25:2359–81.ArticlePubMedPMCPDF
- 6. World Health Organization. Assessment of osteoporosis at the primary health care level. Summary Report of a WHO Scientific Group [Internet]. Geneva: WHO; 2007 [cited 2022 May 11]. Available from: https://www.sheffield.ac.uk/FRAX/pdfs/WHO_Technical_Report.pdf.
- 7. Korean Society for Bone and Mineral Research (KSBMR). Physician’s guide for osteoporosis. Seoul: Korean Society for Bone and Mineral Research; 2020.
- 8. Viswanathan M, Reddy S, Berkman N, Cullen K, Middleton JC, Nicholson WK, et al. Screening to prevent osteoporotic fractures: updated evidence report and systematic review for the US Preventive Services Task Force. JAMA 2018;319:2532–51.ArticlePubMed
- 9. Kanis JA, Oden A, McCloskey EV, Johansson H, Wahl DA, Cooper C, et al. A systematic review of hip fracture incidence and probability of fracture worldwide. Osteoporos Int 2012;23:2239–56.ArticlePubMedPMCPDF
- 10. Kanis JA, Johnell O, Oden A, Johansson H, McCloskey E. FRAX and the assessment of fracture probability in men and women from the UK. Osteoporos Int 2008;19:385–97.ArticlePubMedPMCPDF
- 11. Frost SA, Nguyen ND, Center JR, Eisman JA, Nguyen TV. Timing of repeat BMD measurements: development of an absolute risk-based prognostic model. J Bone Miner Res 2009;24:1800–7.ArticlePubMed
- 12. Gourlay ML, Fine JP, Preisser JS, May RC, Li C, Lui LY, et al. Bone-density testing interval and transition to osteoporosis in older women. N Engl J Med 2012;366:225–33.ArticlePubMedPMC
- 13. Berry SD, Samelson EJ, Pencina MJ, McLean RR, Cupples LA, Broe KE, et al. Repeat bone mineral density screening and prediction of hip and major osteoporotic fracture. JAMA 2013;310:1256–62.ArticlePubMedPMC
- 14. Kanis JA, McCloskey EV, Johansson H, Oden A, Strom O, Borgstrom F. Development and use of FRAX in osteoporosis. Osteoporos Int 2010;21 Suppl 2:S407–13.ArticlePubMedPDF
- 15. Ensrud KE. Epidemiology of fracture risk with advancing age. J Gerontol A Biol Sci Med Sci 2013;68:1236–42.ArticlePubMed
- 16. Nguyen TV, Center JR, Eisman JA. Femoral neck bone loss predicts fracture risk independent of baseline BMD. J Bone Miner Res 2005;20:1195–201.ArticlePubMed
- 17. Nguyen T, Sambrook P, Kelly P, Jones G, Lord S, Freund J, et al. Prediction of osteoporotic fractures by postural instability and bone density. BMJ 1993;307:1111–5.ArticlePubMedPMC
- 18. Kung AW, Lee KK, Ho AY, Tang G, Luk KD. Ten-year risk of osteoporotic fractures in postmenopausal Chinese women according to clinical risk factors and BMD T-scores: a prospective study. J Bone Miner Res 2007;22:1080–7.ArticlePubMed
- 19. Hillier TA, Stone KL, Bauer DC, Rizzo JH, Pedula KL, Cauley JA, et al. Evaluating the value of repeat bone mineral density measurement and prediction of fractures in older women: the study of osteoporotic fractures. Arch Intern Med 2007;167:155–60.ArticlePubMed
- 20. Kanis JA, Johnell O, De Laet C, Jonsson B, Oden A, Ogelsby AK. International variations in hip fracture probabilities: implications for risk assessment. J Bone Miner Res 2002;17:1237–44.ArticlePubMed
- 21. Orimo H, Nakamura T, Hosoi T, Iki M, Uenishi K, Endo N, et al. Japanese 2011 guidelines for prevention and treatment of osteoporosis: executive summary. Arch Osteoporos 2012;7:3–20.ArticlePubMedPMC
- 22. Shin CS, Kim MJ, Shim SM, Kim JT, Yu SH, Koo BK, et al. The prevalence and risk factors of vertebral fractures in Korea. J Bone Miner Metab 2012;30:183–92.ArticlePubMedPDF
- 23. Bow CH, Tsang SW, Loong CH, Soong CS, Yeung SC, Kung AW. Bone mineral density enhances use of clinical risk factors in predicting ten-year risk of osteoporotic fractures in Chinese men: the Hong Kong Osteoporosis Study. Osteoporos Int 2011;22:2799–807.ArticlePubMedPMC
- 24. Kim YM, Hyun NR, Shon HS, Kim HS, Park SY, Park IH, et al. Assessment of clinical risk factors to validate the probability of osteoporosis and subsequent fractures in Korean women. Calcif Tissue Int 2008;83:380–7.ArticlePubMedPDF
- 25. Korean Statistical Information Service. Body mass index: adult female [Internet]. Daejeon: KOSIS; 2018 [cited 2022 May 11]. Available from: https://kosis.kr/statHtml/statHtml.do?orgId=113&tblId=DT_113_STBL_1020218&conn_path=I3.
- 26. Shrank WH, Patrick AR, Brookhart MA. Healthy user and related biases in observational studies of preventive interventions: a primer for physicians. J Gen Intern Med 2011;26:546–50.ArticlePubMedPMCPDF
References
Figure & Data
References
Citations
- Effects of Bazedoxifene/Vitamin D Combination Therapy on Serum Vitamin D Levels and Bone Turnover Markers in Postmenopausal Women with Osteopenia: A Randomized Controlled Trial
Chaiho Jeong, Jeonghoon Ha, Jun-Il Yoo, Young-Kyun Lee, Jung Hee Kim, Yong-Chan Ha, Yong-Ki Min, Dong-Won Byun, Ki-Hyun Baek, Ho Yeon Chung
Journal of Bone Metabolism.2023; 30(2): 189. CrossRef - Bone-modifying agents for non–small-cell lung cancer patients with bone metastases during the era of immune checkpoint inhibitors: A narrative review
Jinyoung Kim, Chaiho Jeong, Jeongmin Lee, Jeonghoon Ha, Ki-Hyun Baek, Seohyun Kim, Tai Joon An, Chan Kwon Park, Hyoung Kyu Yoon, Jeong Uk Lim
Seminars in Oncology.2023; 50(3-5): 105. CrossRef
 PubReader
 ePub Link
 Cite
Cite


