Articles
- Page Path
- HOME > Endocrinol Metab > Volume 36(5); 2021 > Article
-
Review ArticleCalcium & Bone Metabolism Applications of Machine Learning in Bone and Mineral Research
-
Sung Hye Kong1,2
 , Chan Soo Shin1,3
 -
Endocrinology and Metabolism 2021;36(5):928-937.
DOI: https://doi.org/10.3803/EnM.2021.1111
Published online: October 21, 2021
1Department of Internal Medicine, Seoul National University College of Medicine, Seoul, Korea
2Department of Internal Medicine, Seoul National University Bundang Hospital, Seongnam, Korea
3Department of Internal Medicine, Seoul National University Hospital, Seoul, Korea
- Corresponding author: Chan Soo Shin. Department of Internal Medicine, Seoul National University College of Medicine, 101 Daehak-ro, Jongno-gu, Seoul 03080, Korea, Tel: +82-2-740-8001, Fax: +82-2-740-8000, E-mail: csshin@snu.ac.kr
Copyright © 2021 Korean Endocrine Society
This is an Open Access article distributed under the terms of the Creative Commons Attribution Non-Commercial License (https://creativecommons.org/licenses/by-nc/4.0/) which permits unrestricted non-commercial use, distribution, and reproduction in any medium, provided the original work is properly cited.
ABSTRACT
- In this unprecedented era of the overwhelming volume of medical data, machine learning can be a promising tool that may shed light on an individualized approach and a better understanding of the disease in the field of osteoporosis research, similar to that in other research fields. This review aimed to provide an overview of the latest studies using machine learning to address issues, mainly focusing on osteoporosis and fractures. Machine learning models for diagnosing and classifying osteoporosis and detecting fractures from images have shown promising performance. Fracture risk prediction is another promising field of research, and studies are being conducted using various data sources. However, these approaches may be biased due to the nature of the techniques or the quality of the data. Therefore, more studies based on the proposed guidelines are needed to improve the technical feasibility and generalizability of artificial intelligence algorithms.
- In this aging society, osteoporosis and its clinical outcome, fragility fracture, have become a growing social issue in both medical and economic aspects. In South Korea, the total health care costs of osteoporotic fractures increased by approximately 30% from 2008 to 2011, and this trend has been continuously rising in the United States and Korea [1,2]. Therefore, preventing fractures is a core purpose in the diagnosis and management of osteoporosis. The diagnosis of osteoporosis is based on assessing bone mineral density (BMD) using dual-energy X-ray absorptiometry (DXA). In addition to BMD, the Fracture Risk Assessment Tool (FRAX), incorporating additional clinical risk factors, is a well-validated and widely used tool for fracture prediction [3]. However, there is an unmet need for tools with easier accessibility and better performance in classifying patients with osteoporosis and predicting the risk of fractures [4].
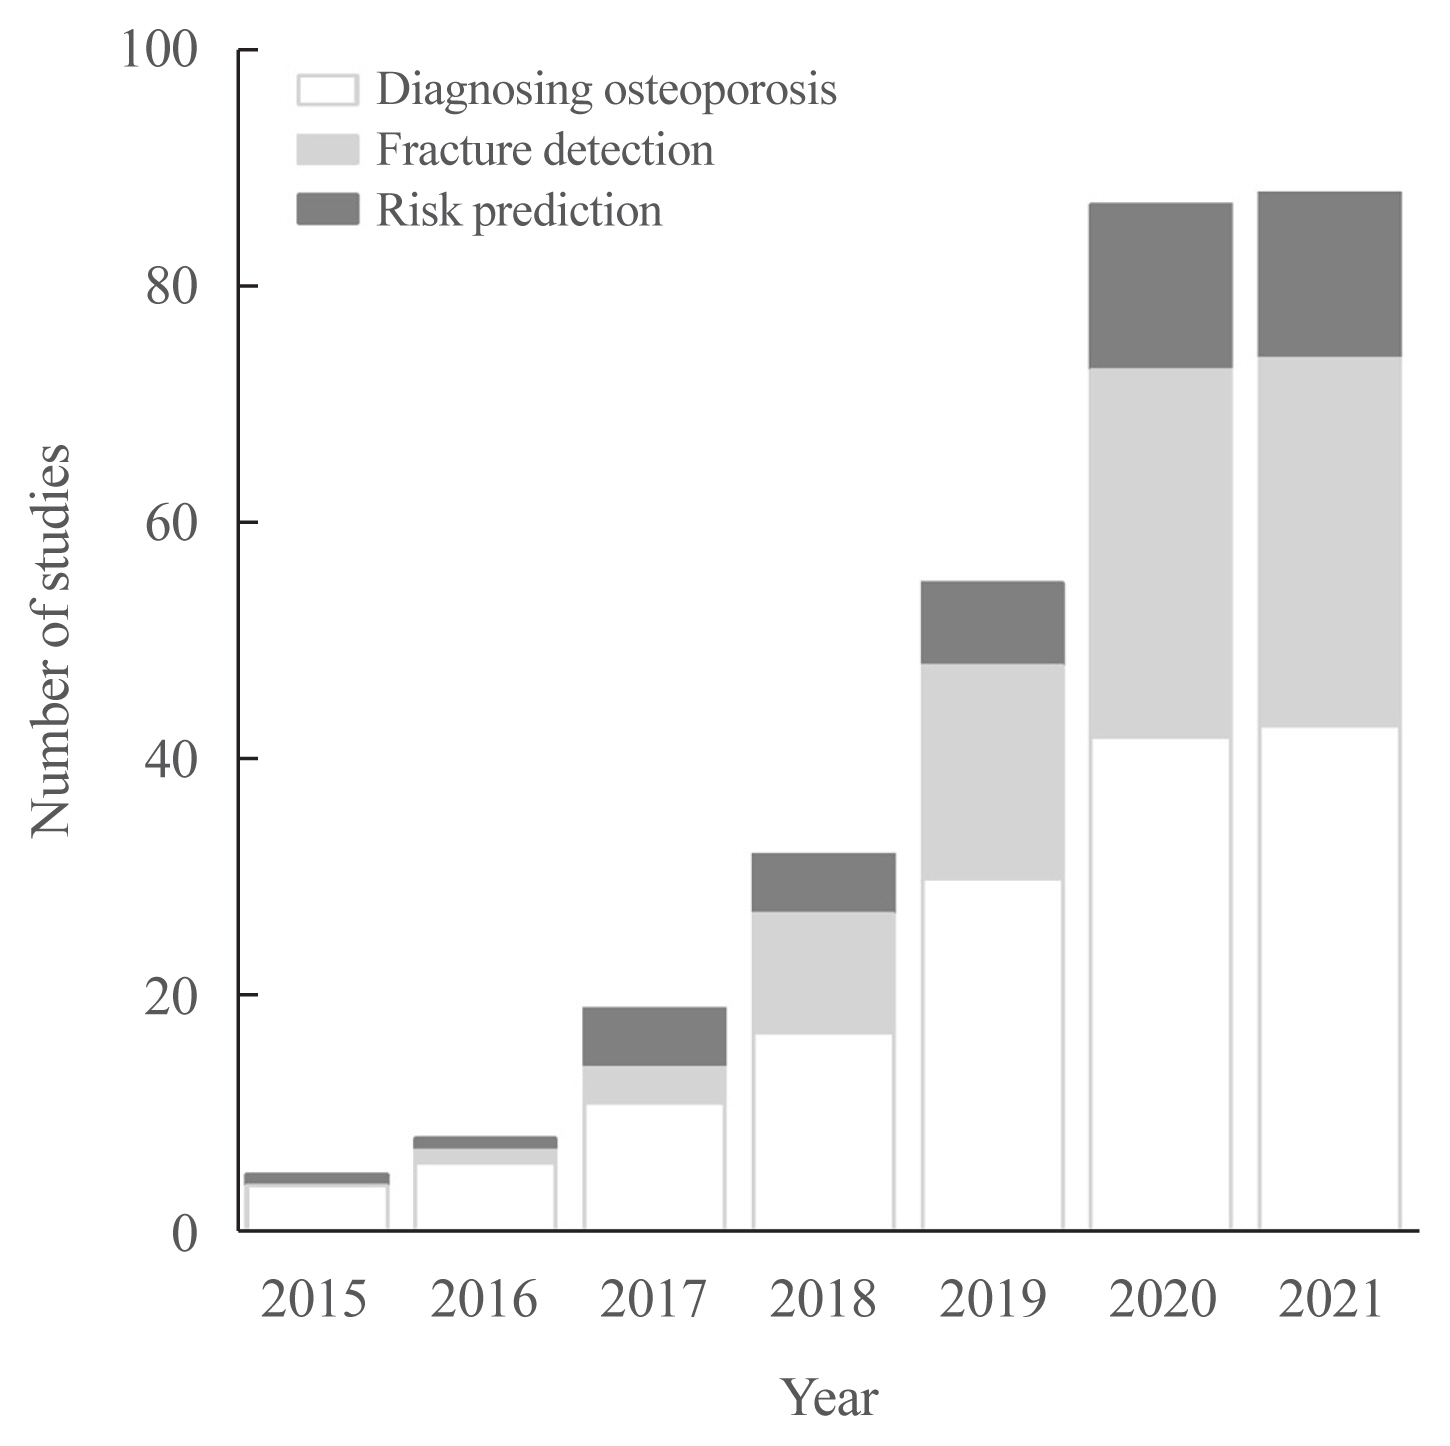
- Machine learning (ML) methodologies are rapidly implemented in various medical fields [5], such as bone and mineral research, including diagnosis of osteoporosis and detection/prediction of fractures using both clinical and imaging data. In the same context, studies of bone and mineral research using ML approaches have been explodingly published, as depicted in Fig. 1. The studies have become possible because of the combination of rapidly accumulating medical data [6] and advances in accessible computing power [7]. Especially, studies of classification tasks—such as screening osteoporosis or detecting fractures—have been increasing. It might be due to the relatively easier access to cross-sectional than survival datasets and the use of more widely distributed models than survival tasks. However, as the large-sized standardized datasets have become more widely available [8] and the attractive methodologies are continuously evolving at this very moment, it is expected to help solve the currently unmet needs of bone and mineral research.
- In this review, studies related to the use of ML methods related to bone and mineral research were reviewed from a medical perspective, focusing on osteoporosis screening, fracture detection, and prediction of the risks. The literature search was performed in PubMed, including studies published from 2016 January until March 2021. Furthermore, future perspectives for researchers and clinicians in the bone field have been summarized.
INTRODUCTION
- Confusion metrics
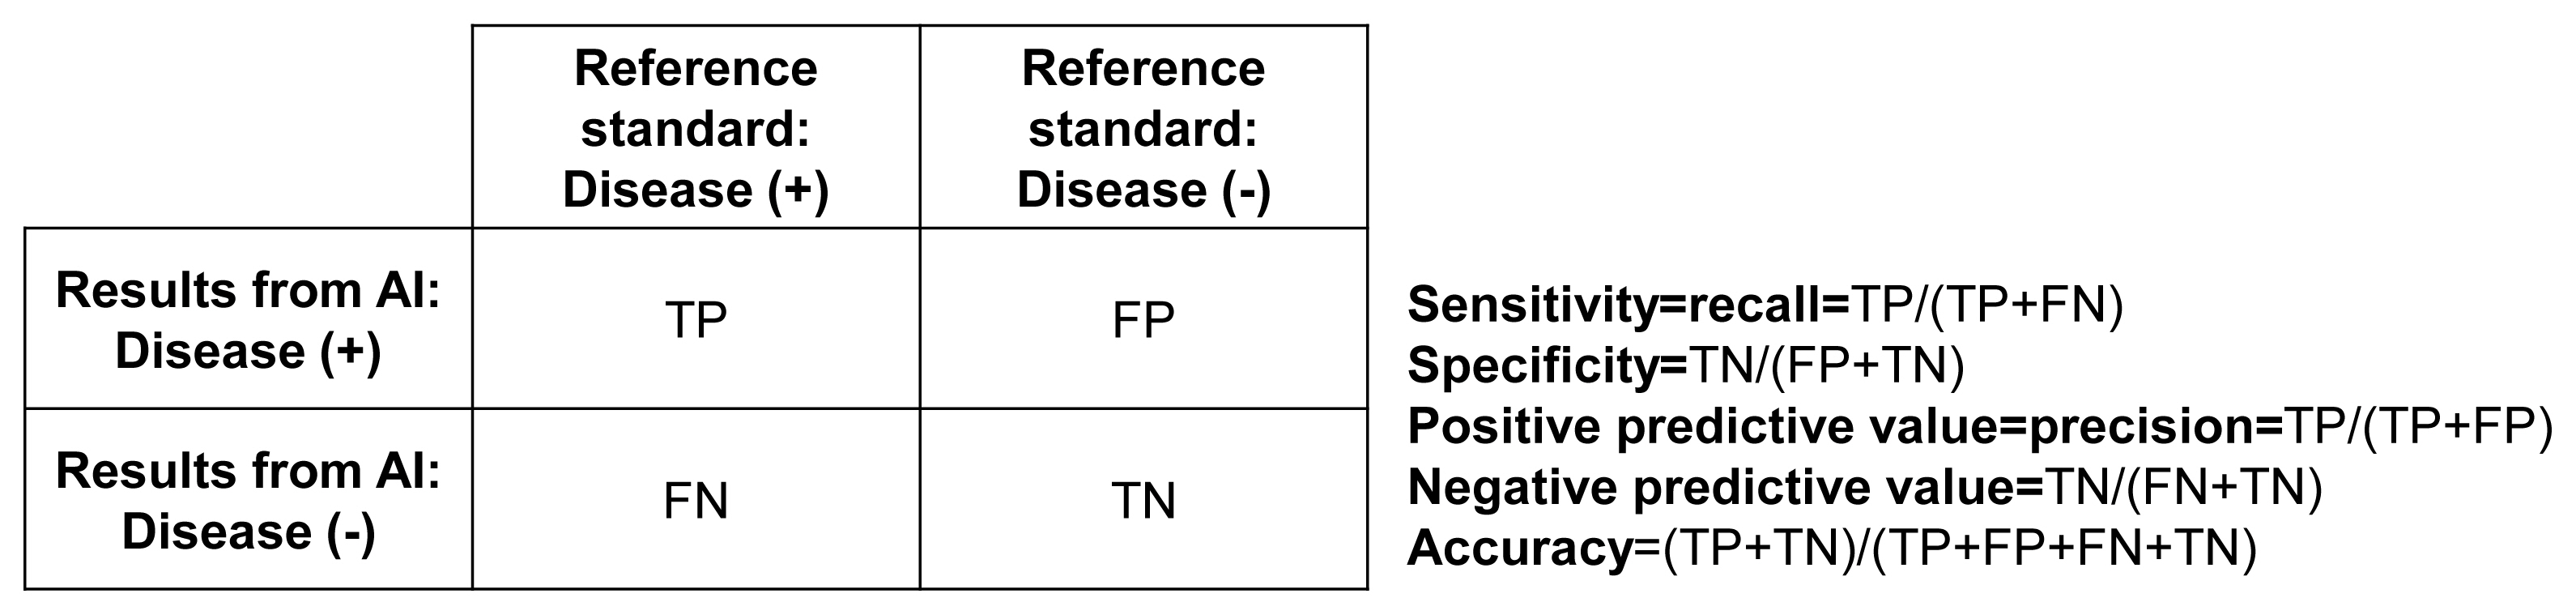
- Fig. 2 shows a cross table of the relationship between the results of the artificial intelligence (AI) algorithm and the reference standard. In the literature of AI, the cross-table is usually described as a ‘confusion metrics.’ Sensitivity, also called ‘recall,’ refers to the fraction of cases in which AI determines to have disease among the reference cases with the disease. On the other hand, specificity refers to the fraction of cases in which AI determines not to have disease among the reference cases without the disease. Sensitivity and specificity are the most basic indicators of the accuracy of AI algorithms. For more intuitive measures, When the AI gives a positive (or negative) result, the probability that the disease actually exists (or does not exist) is called positive predictive value (PPV) (or negative predictive value [NPV]). PPV is also called ‘precision’ in AI literature. However, as prevalence is similar to the pretest probability in terms of individual patients, the algorithm’s accuracy significantly varies by the prevalence of the disease even with the same AI algorithm. Therefore, physicians using AI algorithms should apply the results presented by AI considering the expected pretest probability of the population.
- Receiver operating characteristic curve and precision-recall curve
- A widely-used way to demonstrate the performance of AI algorithms is the area under the receiver operating characteristic curve (AUROC), or, in short, the area under the curve (AUC). The receiver operating characteristic (ROC) curve is a graph drawn with 1-specificity as an x-axis and sensitivity as a y-axis. The ROC curve can have a maximum value of 1, and the closer to 1, the higher the model’s accuracy. However, even if the AUROC is high, the model can be used only with an appropriate threshold. Therefore, the threshold with sensitivity and specificity at the threshold should be presented along with AUROC values.
- Precision-recall curve (PRC) is another way to show the performance of the model, which was drawn with recall (sensitivity) as an x-axis and precision (PPV) as a y-axis. Different from ROC, as a y-axis is PPV, PRC shows the results reflecting prevalence. Therefore, the shape and AUC of PRC can be changed by the prevalence of the disease, which makes PRC more suitable in an imbalanced dataset with a low prevalence.
- Internal and external validation
- Among the processes of training, tuning, and testing in the development of AI algorithms, testing is a process to check the performance of the developed algorithms. Mathematically complex AI models, such as deep learning, are highly dependent on data itself. Therefore, it is crucial to evaluate the performance using independent datasets not used for training and tuning, usually using datasets from other institutions, which is called external validation. On the other hand, evaluating performance with datasets used for training or tuning is called internal validation. However, it is likely to overestimate the performance due to overfitting.
- Split-sample validation uses a randomly selected subgroup of datasets, usually about 10% of the total dataset, only for testing. Although the testing process uses datasets not used for training and tuning, it is also regarded as internal validation. It is mainly because of the selection bias, which is often inevitable in collecting a large amount of data. It leads to various discrepancies between the real-world data and the data collected for specific AI algorithms. Naturally, split data from the specific collected dataset inherits the limitation.
- Therefore, it is recommended to externally evaluate the performance in an independent dataset that can reflect the actual clinical situation. In specific, ideal external validation datasets are supposed to be prospectively collected with an accurate definition of clinical setting without bias as much as possible from institutions other than an institution that collected training dataset.
A SHORT GUIDE FOR INTERPRETATION
- Screening osteoporosis
- In the era of AI, many researchers have focused their attention on developing practical screening tools for osteoporosis using this methodology. Easier-to-use and accurate diagnostic tools may improve the prognosis of individuals at high risk of fractures by earlier intervention and aid the effective use of public health resources for individuals at low risk. Most studies have focused on predicting BMD or categorizing patients with osteoporosis using opportunistic imaging modalities such as computed tomography (CT) [9–13] and X-rays [14–18] or various clinical parameters (Table 1) [19–22].
- In general, CT has been used in studies predicting BMD [9–13]. A recent study by Fang et al. [9] using quantitative CT images from 1,499 patients reported that CT images could predict BMD using a convolutional neural network (CNN), such as DenseNet-121, with an excellent correlation of r>0.98. This result has clinical significance in generalizability because CT images were obtained using scanners from different vendors. The results from other types of CT, such as spinal or chest CT, have also shown excellent correlation to BMD values using CNN [11–13]. For the classification of patients with or without osteoporosis, studies using CT demonstrated outstanding performances, with an accuracy of 0.82 to 0.91 and an AUROC of 0.90 to 0.97 [11–13,23]. However, some studies had a critical limitation—BMD estimated from CT was used and not BMD estimated from DXA, which is the gold standard [9–12].
- Studies using X-rays or dental radiography have usually focused on classifying tasks. Most studies used a CNN, especially DenseNet and ResNet, have shown excellent performances, with an AUROC of 0.81 to 0.94, accuracy of 0.85 to 0.92 [14–18]; some studies have even reported an AUROC of 1.00 [24–26]. In addition, studies have attempted to use clinical parameters instead of images for categorizing osteoporosis, showing excellent performances, with correlation coefficients of 0.778 to 0.978 for BMD and an AUROC of 0.74 to 1.00 [19–22]. The performance of the models using clinical parameters varies widely depending on the type and quality of the data. Some studies also reported precision and recall [12,16], but did not reported PRC, which might be more appropriate in the imbalanced dataset, as mentioned above.
- On the other hand, in a complex model like CNN with numerous parameters, it inevitably risks overfitting due to the variance-bias tradeoff [27]. Overfitting represents a model that learned the detail of the training set too well that it negatively impacts the performance of the data other than the training set. The most intuitive way to solve the problem in a ‘deep-learning’ way is to secure enough data to train models. However, securing sufficient data is not always possible considering the prevalence of osteoporosis or fractures [28]. Therefore, some studies have attempted to control overfitting by feature selection [19], data augmentation [11], and transfer learning [9], while other studies have mentioned the limitation of bias in selecting patients, models, or the testing dataset.
- Taken together, increasing attempts have been made to diagnose osteoporosis using various data sources and ML methods, and performance has improved over time, especially when using images with CNN methods. Although studies reporting AUROCs of almost 1.00 can have a risk of overfitting and need external validation of the model [24–26], the practical use of opportunistically taken images in screening osteoporosis may be realized in the future.
- Screening fractures
- Many studies have reported the application of ML in fracture detection [29–43], and some of them have become the basis of commercially available programs—such as OsteoDetect (Imagen Technologies, New York, NY, USA; 2018, the U.S. Food and Drug Administration [FDA]-approved), Aidoc BriefCase-CSF triage (Aidoc Medical Ltd., Tel Aviv, Israel; 2019, FDA-approved), HealthVCF (Zebra Medical Vision Ltd., Shefayim, Israel; 2020, FDA-approved), FractureDetect (Imagen Technologies, 2020, FDA-approved) [44], and DEEP-SPINE-CF-01 (Deepnoid Inc., Seoul, Korea; 2019, Korean FDA-approved).
- Several earlier studies used X-ray images to detect fractures, and studies using CT images to detect fractures have been increasing recently. As the basis for the OsteoDetect program, Lindsey et al. [30] used wrist radiographs to detect wrist fractures using a CNN and showed performances in AUROC of 0.96 and 0.97 in two internal test datasets. Also, they showed that the when aided with the program, misinterpretation rate of average clinician was significantly reduced by 47.0% [30]. Another study which used X-ray to detect wrist fracture using CNN showed excellent performances in external test of AUROC of 0.95, a specificity of 0.90, and a sensitivity of 0.88, which surpassed the performance of the previous computational methods [31]. A similar study by Chung et al. [32] used shoulder radiographs to detect humerus fractures using a CNN model. In the study, the model demonstrated superior performance to general orthopedic surgeons in distinguishing fractures [32]. For detecting vertebral and femoral neck fractures, many studies have reported AUROCs as high as 0.91 to 0.99 using spine and hip X-rays with CNN methods, consistent with other studies [35–43]. Another interesting study conducted by Badgeley et al. [45] reported that imaging features from hip X-rays could be used to discriminate fractures using a CNN (AUROC of 0.78) and that patient data with hospital process variables, such as scanner model, scanner manufacturer, and order date, showed better performance for fracture detection (AUROC of 0.91) than images. In a subgroup analysis of selected radiographs matched with patient data and hospital process variables, X-ray could not detect hip fractures [45]. This result implied that the model detected fractures indirectly through the associated clinical variables rather than directly utilizing the image features of the fracture. Also, it was partly because of the model imbalance that the PRC, which is dependent on the disease prevalence, was significantly higher for case-control cohorts (hip fracture prevalence of 50% than in original population (the prevalence of 3%) [45].
- In terms of studies using CT images, Tomita et al. [29] detected osteoporotic vertebral fractures from 1,432 pelvic CT scans in 2018. They used multiple methods combined, the CNN-based model for feature extraction, and the ResNet long short-term memory model for aggregating the extracted features. Along with other studies using random forest or support vector machines [46,47], the study demonstrated an acceptable accuracy of 0.89. While the number of studies for predicting the hip and any osteoporotic fractures is relatively smaller than that for predicting vertebral fractures, they also showed a possibility of ML models as a diagnostic tool for the fractures, using diverse methods of deep CNN, ElasticNet, and others [48–50]. However, studies using CT images are usually based on a small number of cases; hence, there is a need for larger studies with external validation.
- In particular, in imbalanced tasks such as detecting fractures, data augmentation was attempted in some studies to control the overfitting problem [31,37,39,41]. Some studies have used sampling methods to handle class imbalance [51,52]. In a recent study, images with data augmentation techniques of generative adversarial networks and digitally reconstructed radiographs from CT showed better performances than those without augmentation (AUROC of 0.92 vs. 0.80, accuracy 86.0%, sensitivity 0.79, specificity 0.90, PPV 0.80, NPV 0.90) [37]. Another recent study reported that the accuracy of fracture detection increased with larger training dataset sizes and mildly improved with augmentation [35]. Consequently, larger studies with optimal augmentation techniques are needed for real-world application of automatic ML-driven detection systems, which may reduce the time and burden of radiologists.
APPLICATIONS IN DIAGNOSIS
- As in other fields of medical research, accurate prediction of musculoskeletal outcomes enables an individualized approach for initiating and monitoring treatments. A few studies have evaluated the risks of fractures, falls, or bone loss in patients with osteoporosis. In terms of predicting fracture, most studies used a database to build prediction models. In men, Su et al. [53] reported that the classification of a high-risk group for hip fractures using a classic ML method of classification and regression trees showed a discrimination power similar to that of FRAX ≥3%. Total hip BMD was the most robust discriminator, followed by age and femoral neck BMD [53]. In postmenopausal women, fracture classification using the CatBoost method, a recently developed ML method, outperformed the FRAX score for fracture prediction (AUROC of 0.69 vs. 0.66) [54]. The top predicting factors were total hip, lumbar spine, and femur neck BMD, followed by subjective arthralgia score, serum creatinine level, and homocysteine level [54]. The latter factors were listed higher than conventional predictors, such as age [54]. The results implied that ML could be used to build prediction models and identify novel risk factors. Based on claims data of more than 280,000 individuals, Engels et al. [55] developed a hip fracture prediction model with an AUROC of 0.65 to 0.70 using a super-learner algorithm that considered both regression and ML algorithms, such as support vector machines and RUSBoost. Interestingly, image-based fracture prediction model was tried recently by Muehlematter et al. [56]. They showed that the bone texture analysis from CT scan combined with ML methods may identify patients at high risk of vertebral fractures with high accuracy.
- Moreover, considering the sequential characteristics of electronic health records, Almog et al. [57] developed a short-term incident fracture prediction model based on natural language processing methods. These findings indicate the possibility of using the unique medical history data of the patients over time to predict the risk of fractures. Contrarily, studies using unsupervised learning to identify fractures were also conducted [58,59]. Kruse et al. [58] found nine different fracture risk clusters based on BMD, clinical risk factors, and medications using simple unsupervised hierarchical agglomerative clustering analysis. Clusters based on BMD could discriminate between patients with poor and good treatment compliance to antiresorptives in the future.
- With regard to predicting outcomes other than fracture, few studies have attempted to predict bone loss and falls [60–62]. The rate of bone loss over 10 years could be predicted better with the artificial neural network than with multiple regression analysis using conventional parameters, such as age, body mass index, menopause, fat and lean body mass, and BMD values [60]. Falls were also accurately predicted using XGBoost, reporting the following top predictors: cognitive disorders, abnormalities of gait and balance, and Parkinson’s disease [61]. The most common problem encountered in learning tasks is a class imbalance because of the low incidence of positive events. Model calibration has been attempted in some studies by adjusting the predicted and observed probabilities to attenuate class imbalance [61,63]. Although further validation studies are needed, efforts are being made to identify patients at risk and provide individualized treatment.
APPLICATIONS IN RISK PREDICTION
- Overall, many studies have consistently shown that ML models can detect fractures better than clinicians [32,39,41], expanding the limits of human performance. Recently, FDA and Korea FDA approved some fracture detection algorithms to support clinicians, which makes AI-guided tools within reach. However, AI models exceedingly better than conventional models have not been suggested for the task of predicting fractures. One of the main reasons for the phenomenon could be that the conventional models are well-designed and already have excellent performances in fracture risk prediction, which leaves small room for the improvement. Also, especially for the AI models with images, although CNN showed excellent performance in discriminating existing fractures, the information included in the image of the bone may not have enough information to predict future fractures. Therefore, more AI models conjoining images of bone and muscle with clinical informations are needed in the near future. It could be considered in designing the models whether input images can provide high-quality information to predict fractures, as there is a significant difference in the quality and amount of included information included depending on the image type.
- In addition to the above applications, AI can be used to predict treatment responses. For example, treatment response can be accurately predicted based on anthropometric, biochemical, and imaging features of patients with acromegaly using a gradient boosting decision tree method [64]. Further, in the Action to Control Cardiovascular Risk in Diabetes (ACCORD) trial, among patients with diabetes, a subgroup of patients with survival benefit from intensive treatment was newly identified in post hoc analysis using the gradient forest method [65]. These results provide insights into the utilization of ML methods to predict treatment responses, leading to an individualized approach in designing treatment regimens and targets.
- Moreover, AI methods can be effectively used in translational research, especially for evaluating large data, such as genetic, epigenetic, proteomic, and other molecular profiling data. In the field of cancer immunology, researchers have used ML to predict the treatment response to immunotherapy with a rich dataset of gene expression of tumor and immune cells and their clinical characteristics [66,67]. A recent study tried to identify plasma protein patterns for various health outcomes using ML techniques [68]. The authors found novel predictive proteins and built models using ML techniques. However, the findings of these studies require further validation in more extensive and different populations.
- However, despite the enthusiasm about the use of AI for medicine, the lack of sufficient and appropriate validation of the algorithms has been a concern, and it is called ‘digital exceptionalism’ [69,70]. A recent meta-analysis that evaluated AI algorithms for the diagnostic analysis of medical images reported that only 6% of them performed external validation. None of these studies had a diagnostic cohort design and were prospectively collected for external validation [71]. To improve the technical feasibility and generalizability of current AI studies, there are some methodologic guides for various study designs—Standard Protocol Items: Recommendations for Interventional Trials–Artificial Intelligence (SPIRIT-AI) and Consolidated Standards of Reporting Trials–Artificial Intelligence (CONSORT-AI) guidelines for intervention studies [72], Standards for Reporting of Diagnostic Accuracy Studies–Artificial Intelligence (STARD-AI) guidelines for diagnostic accuracy [73], and others [74,75]. In the near future, only studies with appropriate validation can be accepted and utilized in clinical practice. Also, beyond the AI models’ performance, other principles, such as data privacy and safety, need proper attention before implemented in clinical practice.
FUTURE DIRECTIONS
- In this era of the overwhelming volume of medical data, AI is a promising tool that may shed light on an individualized approach and a better understanding of the disease in the field of bone and mineral research. The present review aimed to provide an overview of the latest studies using ML to address the issues in the field, focusing on osteoporosis and fragility fractures. ML models for diagnosing and classifying osteoporosis and detecting fractures from images have shown promising performance and have improved over time. Fracture risk prediction is another promising field of research, and studies are being conducted using various data sources.
- On the verge of this methodological turning point, endocrinologists as domain experts will continue to serve as a key person for finding unmet clinical needs to initiate the research and find clinical meanings from converging the vast outcomes from the analyses to aid patients with musculoskeletal diseases. We believe that the data presented in this review may help clinicians and researchers understand the current progress of ML to date and its strengths and limitations.
CONCLUSIONS
-
Acknowledgements
- This study was funded by the Korea Research Foundation (Project number 2021R1A2C2003410).
-
CONFLICTS OF INTEREST
No potential conflict of interest relevant to this article was reported.
Article information

| Study | Tasks | Data type | Input data amount | Trained algorithm | Train/validation/test set | Main results | Clinical significance |
|---|---|---|---|---|---|---|---|
| Shim et al. [22] | Screening osteoporosis | DB | 1,792 (34% OP) | ANN, RF, LR, SVM, KNN, DT, GBM | 76%/5-fold CV/24% |
AUROC ANN 0.742, RF 0.727, LR 0.726, SVM 0.724, KNN 0.712, DT 0.684, GBM 0.652 |
Demonstrated performances of 7 ML models to accurately classify osteoporosis, and found ANN as most accurate methods |
| Yamamoto et al. [16] | Screening osteoporosis | X-ray | 1,131 (53% OP) | ResNet-18, resNet-34, GoogleNet, EfficientNet b3, EfficientNet b4 | 80%/10%/10% | EfficientNet b3, accuracy 0.885, recall 0.887, NPV 0.865, F1 score 0.894, AUROC 0.937 |
Addition of clinical covariates increased almost all performance metrics in CNN networks over the analysis of hip radiographs alone CNN models can diagnose osteoporosis from hip radiographs with high accuracy |
| Yasaka et al. [11] | Screening osteoporosis | CT | 2,045 (% not reported) | CNN (4-layer) | 81%/9%/10% (external validation) | AUROC 0.97 |
By applying a deep learning technique, the BMD of lumbar vertebrae can be estimated from noncontrast abdominal CT Strong correlation was observed between the estimated BMD from CT and the BMD obtained with DXA The study was externally validated in an independent dataset Superior performance of the CNN was more marked in complex types of humerus fractures |
| Chung et al. [32] | Fracture detection (humerus) | X-ray | 1,891 (69% fracture) | Resnet-152 | 90%/-/10% | AUROC 1.00, sensitivity 0.99, specificity 0.97 | CNN showed superior performance to that of physicians and orthopedists |
| Tomita et al. [29] | Fracture detection (vertebra) | CT | 1,432 (50% fracture) | Resnet-LSTM | 80%/10%/10% | Accuracy 0.892, F1 score 0.908 |
Accuracy and F1 score of CNN were similar to the radiologists’ performance in detecting fracture Visualization by color maps showed that the learning was based on appropriate target lesion |
| Mutasa et al. [37] | Fracture detection (hip) | X-ray | 1,063 (69% fracture) | CNN (21- layer) | 72%/18%/10% | AUROC 0.920, accuracy 0.923, sensitivity 0.910, specificity 0.930, PPV 0.960, NPV 0.860 | Data augmentation techniques of generative adversarial networks and digitally reconstructed radiographs showed better performances than those without augmentation |
| Su et al. [53] | Fracture prediction (hip) | DB | 5,977 (3% fracture) | CART | 10-fold CV | AUROC 0.73 | Classification of a high-risk group for hip fractures using a classic ML method of CARTs showed a discrimination power similar to that of FRAX ≥3% |
| Almog et al. [57] | Fracture prediction (osteoporotic, hip, vertebra) | DB | 630,445 (7% fracture) | Word2Vec, Doc2Vec, LSTM, XGBoost, ensemble | 70%/3-fold CV/30% | AUROC 0.82 |
Development of a short-term incident fracture prediction model based on natural language processing methods Suggested the possibility of using the unique medical history data of the patients over time to predict the risk of fractures |
| Muehlematter et al. [56] | Fracture prediction (vertebra) | CT | 120 (50% fracture) | ANN, RF, SVM | 67%/10-fold CV/33% | AUROC 0.97 |
Bone texture analysis combined with ML allows to identify patients at risk for vertebral fractures on CT scans with high accuracy Compared to Hounsfield unit measurements on CT scans, application of bone texture analysis combined with ML may improve fracture risk prediction |
DB, database; OP, osteoporosis; ANN, artificial neural network; RF, random forest; LR, logistic regression; SVM, support vector machine; KNN, k-nearest neighbors; DT, decision tree; GBM, gradient boosting machine; CV, cross validation; AUROC, area under the receiver operating characteristic curve; ML, machine learning; NPV, negative predictive value; CNN, convolutional neural network; CT, computed tomography; BMD, bone mineral density; DXA, dual X-ray absorptiometry; LSTM, long short-term memory; PPV, positive predictive value; CART, classification and regression tree; FRAX, Fracture Risk Assessment Tool.
- 1. National Osteoporosis Foundation. National Bone Health Policy. New report on burden of osteoporosis highlights huge and growing economic and human toll of the disease [Internet] Arlington: National Osteoporosis Foundation; 2019 [cited 2021 Sep 23]. Available from: https://www.nof.org/news/new-report-on-burden-of-osteoporosis-highlights-huge-and-growing-economic-and-human-toll-of-the-disease .
- 2. Kim HY, Ha YC, Kim TY, Cho H, Lee YK, Baek JY, et al. Healthcare costs of osteoporotic fracture in Korea: information from the National Health Insurance Claims Database, 2008–2011. J Bone Metab 2017;24:125–33.ArticlePubMedPMC
- 3. Kanis JA, Harvey NC, Johansson H, Oden A, Leslie WD, McCloskey EV. FRAX update. J Clin Densitom 2017;20:360–7.ArticlePubMed
- 4. Aspray TJ. New horizons in fracture risk assessment. Age Ageing 2013;42:548–54.ArticlePubMed
- 5. Hong N, Park H, Rhee Y. Machine learning applications in endocrinology and metabolism research: an overview. Endocrinol Metab (Seoul) 2020;35:71–84.ArticlePubMedPMC
- 6. Weber GM, Mandl KD, Kohane IS. Finding the missing link for big biomedical data. JAMA 2014;311:2479–80.ArticlePubMed
- 7. Cook S. Programming: a developer’s guide to parallel computing with GPUs (applications of GPU computing); Waltham: Morgan Kaufmann Publishers; 2012.
- 8. Dimitriadis VK, Gavriilidis GI, Natsiavas P. Pharmacovigilance and clinical environment: utilizing OMOP-CDM and OHDSI software stack to integrate EHR data. Stud Health Technol Inform 2021;281:555–9.ArticlePubMed
- 9. Fang Y, Li W, Chen X, Chen K, Kang H, Yu P, et al. Opportunistic osteoporosis screening in multi-detector CT images using deep convolutional neural networks. Eur Radiol 2021;31:1831–42.ArticlePubMed
- 10. Gonzalez G, Washko GR, Estepar RS. Deep learning for biomarker regression: application to osteoporosis and emphysema on chest CT scans. Proc SPIE Int Soc Opt Eng 2018;10574:105741H.PubMedPMC
- 11. Yasaka K, Akai H, Kunimatsu A, Kiryu S, Abe O. Prediction of bone mineral density from computed tomography: application of deep learning with a convolutional neural network. Eur Radiol 2020;30:3549–57.ArticlePubMed
- 12. Nam KH, Seo I, Kim DH, Lee JI, Choi BK, Han IH. Machine learning model to predict osteoporotic spine with Hounsfield units on lumbar computed tomography. J Korean Neurosurg Soc 2019;62:442–9.ArticlePubMedPMC
- 13. Krishnaraj A, Barrett S, Bregman-Amitai O, Cohen-Sfady M, Bar A, Chettrit D, et al. Simulating dual-energy X-ray absorptiometry in CT using deep-learning segmentation cascade. J Am Coll Radiol 2019;16:1473–9.ArticlePubMed
- 14. Areeckal AS, Jayasheelan N, Kamath J, Zawadynski S, Kocher M, David SS. Early diagnosis of osteoporosis using radiogrammetry and texture analysis from hand and wrist radiographs in Indian population. Osteoporos Int 2018;29:665–73.ArticlePubMed
- 15. Tecle N, Teitel J, Morris MR, Sani N, Mitten D, Hammert WC. Convolutional neural network for second metacarpal radiographic osteoporosis screening. J Hand Surg Am 2020;45:175–81.ArticlePubMed
- 16. Yamamoto N, Sukegawa S, Kitamura A, Goto R, Noda T, Nakano K, et al. Deep learning for osteoporosis classification using hip radiographs and patient clinical covariates. Biomolecules 2020;10:1534.ArticlePubMedPMC
- 17. Zhang B, Yu K, Ning Z, Wang K, Dong Y, Liu X, et al. Deep learning of lumbar spine X-ray for osteopenia and osteoporosis screening: a multicenter retrospective cohort study. Bone 2020;140:115561.ArticlePubMed
- 18. Liu J, Wang J, Ruan W, Lin C, Chen D. Diagnostic and gradation model of osteoporosis based on improved deep U-Net network. J Med Syst 2019;44:15.ArticlePubMed
- 19. Zhang T, Liu P, Zhang Y, Wang W, Lu Y, Xi M, et al. Combining information from multiple bone turnover markers as diagnostic indices for osteoporosis using support vector machines. Biomarkers 2019;24:120–6.ArticlePubMed
- 20. Wang J, Yan D, Zhao A, Hou X, Zheng X, Chen P, et al. Discovery of potential biomarkers for osteoporosis using LC-MS/MS metabolomic methods. Osteoporos Int 2019;30:1491–9.ArticlePubMed
- 21. Meng J, Sun N, Chen Y, Li Z, Cui X, Fan J, et al. Artificial neural network optimizes self-examination of osteoporosis risk in women. J Int Med Res 2019;47:3088–98.ArticlePubMedPMC
- 22. Shim JG, Kim DW, Ryu KH, Cho EA, Ahn JH, Kim JI, et al. Application of machine learning approaches for osteoporosis risk prediction in postmenopausal women. Arch Osteoporos 2020;15:169.ArticlePubMed
- 23. Sun X, Qiao Y, Li W, Sui Y, Ruan Y, Xiao J. A graphene oxide-aided triple helical aggregation-induced emission biosensor for highly specific detection of charged collagen peptides. J Mater Chem B 2020;8:6027–33.ArticlePubMed
- 24. Zheng K, Harris CE, Jennane R, Makrogiannis S. Integrative blockwise sparse analysis for tissue characterization and classification. Artif Intell Med 2020;107:101885.ArticlePubMedPMC
- 25. Lee JS, Adhikari S, Liu L, Jeong HG, Kim H, Yoon SJ. Osteoporosis detection in panoramic radiographs using a deep convolutional neural network-based computer-assisted diagnosis system: a preliminary study. Dentomaxillofac Radiol 2019;48:20170344.ArticlePubMed
- 26. Singh A, Dutta MK, Jennane R, Lespessailles E. Classification of the trabecular bone structure of osteoporotic patients using machine vision. Comput Biol Med 2017;91:148–58.ArticlePubMed
- 27. Dwivedi R, Singh C, Yu B, Wainwright MJ. Revisiting complexity and the bias-variance tradeoff. arXiv 2020 Jun 17 https://arxiv.org/abs/2006.10189 .
- 28. Sun C, Shrivastava A, Singh S, Gupta A. Revisiting unreasonable effectiveness of data in deep learning era. In: Proceedings of the 2017 IEEE International Conference on Computer Vision; 2017 Oct 22–29; Venice, Italy. Los Alamitos: IEEE Computer Society; 2017;pp 843–52.Article
- 29. Tomita N, Cheung YY, Hassanpour S. Deep neural networks for automatic detection of osteoporotic vertebral fractures on CT scans. Comput Biol Med 2018;98:8–15.ArticlePubMed
- 30. Lindsey R, Daluiski A, Chopra S, Lachapelle A, Mozer M, Sicular S, et al. Deep neural network improves fracture detection by clinicians. Proc Natl Acad Sci U S A 2018;115:11591–6.ArticlePubMedPMC
- 31. Kim DH, MacKinnon T. Artificial intelligence in fracture detection: transfer learning from deep convolutional neural networks. Clin Radiol 2018;73:439–45.ArticlePubMed
- 32. Chung SW, Han SS, Lee JW, Oh KS, Kim NR, Yoon JP, et al. Automated detection and classification of the proximal humerus fracture by using deep learning algorithm. Acta Orthop 2018;89:468–73.ArticlePubMedPMC
- 33. Olczak J, Fahlberg N, Maki A, Razavian AS, Jilert A, Stark A, et al. Artificial intelligence for analyzing orthopedic trauma radiographs. Acta Orthop 2017;88:581–6.ArticlePubMedPMC
- 34. Brett A, Miller CG, Hayes CW, Krasnow J, Ozanian T, Abrams K, et al. Development of a clinical workflow tool to enhance the detection of vertebral fractures: accuracy and precision evaluation. Spine (Phila Pa 1976) 2009;34:2437–43.PubMed
- 35. Adams M, Chen W, Holcdorf D, McCusker MW, Howe PD, Gaillard F. Computer vs human: deep learning versus perceptual training for the detection of neck of femur fractures. J Med Imaging Radiat Oncol 2019;63:27–32.ArticlePubMed
- 36. Kitamura G. Deep learning evaluation of pelvic radiographs for position, hardware presence, and fracture detection. Eur J Radiol 2020;130:109139.ArticlePubMedPMC
- 37. Mutasa S, Varada S, Goel A, Wong TT, Rasiej MJ. Advanced deep learning techniques applied to automated femoral neck fracture detection and classification. J Digit Imaging 2020;33:1209–17.ArticlePubMedPMC
- 38. Urakawa T, Tanaka Y, Goto S, Matsuzawa H, Watanabe K, Endo N. Detecting intertrochanteric hip fractures with orthopedist-level accuracy using a deep convolutional neural network. Skeletal Radiol 2019;48:239–44.ArticlePubMed
- 39. Mawatari T, Hayashida Y, Katsuragawa S, Yoshimatsu Y, Hamamura T, Anai K, et al. The effect of deep convolutional neural networks on radiologists’ performance in the detection of hip fractures on digital pelvic radiographs. Eur J Radiol 2020;130:109188.ArticlePubMed
- 40. Jimenez-Sanchez A, Kazi A, Albarqouni S, Kirchhoff C, Biberthaler P, Navab N, et al. Precise proximal femur fracture classification for interactive training and surgical planning. Int J Comput Assist Radiol Surg 2020;15:847–57.ArticlePubMed
- 41. Yamada Y, Maki S, Kishida S, Nagai H, Arima J, Yamakawa N, et al. Automated classification of hip fractures using deep convolutional neural networks with orthopedic surgeon-level accuracy: ensemble decision-making with antero-posterior and lateral radiographs. Acta Orthop 2020;91:699–704.ArticlePubMedPMC
- 42. Yu JS, Yu SM, Erdal BS, Demirer M, Gupta V, Bigelow M, et al. Detection and localisation of hip fractures on anteroposterior radiographs with artificial intelligence: proof of concept. Clin Radiol 2020;75:237.Article
- 43. Murata K, Endo K, Aihara T, Suzuki H, Sawaji Y, Matsuoka Y, et al. Artificial intelligence for the detection of vertebral fractures on plain spinal radiography. Sci Rep 2020;10:20031.ArticlePubMedPMC
- 44. FDA cleared AI algorithms [Internet] Reston: Data Science Institute American College of Radiology; 2021 [cited 2021 Sep 23]. Available from: https://models.acrdsi.org .
- 45. Badgeley MA, Zech JR, Oakden-Rayner L, Glicksberg BS, Liu M, Gale W, et al. Deep learning predicts hip fracture using confounding patient and healthcare variables. NPJ Digit Med 2019;2:31.ArticlePubMedPMC
- 46. Valentinitsch A, Trebeschi S, Kaesmacher J, Lorenz C, Loffler MT, Zimmer C, et al. Opportunistic osteoporosis screening in multi-detector CT images via local classification of textures. Osteoporos Int 2019;30:1275–85.ArticlePubMedPMC
- 47. Burns JE, Yao J, Summers RM. Vertebral body compression fractures and bone density: automated detection and classification on CT images. Radiology 2017;284:788–97.ArticlePubMed
- 48. Pranata YD, Wang KC, Wang JC, Idram I, Lai JY, Liu JW, et al. Deep learning and SURF for automated classification and detection of calcaneus fractures in CT images. Comput Methods Programs Biomed 2019;171:27–37.ArticlePubMed
- 49. Carballido-Gamio J, Yu A, Wang L, Su Y, Burghardt AJ, Lang TF, et al. Hip fracture discrimination based on statistical multi-parametric modeling (SMPM). Ann Biomed Eng 2019;47:2199–212.ArticlePubMedPMC
- 50. Gebre RK, Hirvasniemi J, Lantto I, Saarakkala S, Leppilahti J, Jamsa T. Discrimination of low-energy acetabular fractures from controls using computed tomography-based bone characteristics. Ann Biomed Eng 2021;49:367–81.ArticlePubMed
- 51. Chen YF, Lin CS, Wang KA, Rahman OA, Lee DJ, Chung WS, et al. Design of a clinical decision support system for fracture prediction using imbalanced dataset. J Healthc Eng 2018;2018:9621640.ArticlePubMedPMC
- 52. Korfiatis VC, Tassani S, Matsopoulos GK, Korfiatis VC, Tassani S, Matsopoulos GK. A new ensemble classification system for fracture zone prediction using imbalanced micro-CT bone morphometrical data. IEEE J Biomed Health Inform 2018;22:1189–96.ArticlePubMed
- 53. Su Y, Kwok TC, Cummings SR, Yip BH, Cawthon PM. Can classification and regression tree analysis help identify clinically meaningful risk groups for hip fracture prediction in older American men (The MrOS Cohort Study)? JBMR Plus 2019;3:e10207.ArticlePubMedPMC
- 54. Kong SH, Ahn D, Kim BR, Srinivasan K, Ram S, Kim H, et al. A novel fracture prediction model using machine learning in a community-based cohort. JBMR Plus 2020;4:e10337.ArticlePubMedPMC
- 55. Engels A, Reber KC, Lindlbauer I, Rapp K, Buchele G, Klenk J, et al. Osteoporotic hip fracture prediction from risk factors available in administrative claims data: a machine learning approach. PLoS One 2020;15:e0232969.ArticlePubMedPMC
- 56. Muehlematter UJ, Mannil M, Becker AS, Vokinger KN, Finkenstaedt T, Osterhoff G, et al. Vertebral body insufficiency fractures: detection of vertebrae at risk on standard CT images using texture analysis and machine learning. Eur Radiol 2019;29:2207–17.ArticlePubMed
- 57. Almog YA, Rai A, Zhang P, Moulaison A, Powell R, Mishra A, et al. Deep learning with electronic health records for short-term fracture risk identification: crystal bone algorithm development and validation. J Med Internet Res 2020;22:e22550.ArticlePubMedPMC
- 58. Kruse C, Eiken P, Vestergaard P. Clinical fracture risk evaluated by hierarchical agglomerative clustering. Osteoporos Int 2017;28:819–32.ArticlePubMed
- 59. Wang Y, Zhao Y, Therneau TM, Atkinson EJ, Tafti AP, Zhang N, et al. Unsupervised machine learning for the discovery of latent disease clusters and patient subgroups using electronic health records. J Biomed Inform 2020;102:103364.ArticlePubMed
- 60. Shioji M, Yamamoto T, Ibata T, Tsuda T, Adachi K, Yoshimura N. Artificial neural networks to predict future bone mineral density and bone loss rate in Japanese postmenopausal women. BMC Res Notes 2017;10:590.ArticlePubMedPMC
- 61. Ye C, Li J, Hao S, Liu M, Jin H, Zheng L, et al. Identification of elders at higher risk for fall with statewide electronic health records and a machine learning algorithm. Int J Med Inform 2020;137:104105.ArticlePubMed
- 62. Cuaya-Simbro G, Perez-Sanpablo AI, Munoz-Melendez A, Quinones I, Morales-Manzanares EF, Nunez-Carrera L. Comparison of machine learning models to predict risk. Found Comput Decis Sci 2020;45:65–77.
- 63. Kruse C, Eiken P, Vestergaard P. Machine learning principles can improve hip fracture prediction. Calcif Tissue Int 2017;100:348–60.ArticlePubMed
- 64. Fan Y, Li Y, Li Y, Feng S, Bao X, Feng M, et al. Development and assessment of machine learning algorithms for predicting remission after transsphenoidal surgery among patients with acromegaly. Endocrine 2020;67:412–22.ArticlePubMed
- 65. Basu S, Raghavan S, Wexler DJ, Berkowitz SA. Characteristics associated with decreased or increased mortality risk from glycemic therapy among patients with type 2 diabetes and high cardiovascular risk: machine learning analysis of the ACCORD trial. Diabetes Care 2018;41:604–12.ArticlePubMed
- 66. Leiserson MD, Syrgkanis V, Gilson A, Dudik M, Gillett S, Chayes J, et al. A multifactorial model of T cell expansion and durable clinical benefit in response to a PD-L1 inhibitor. PLoS One 2018;13:e0208422.ArticlePubMedPMC
- 67. Snyder A, Nathanson T, Funt SA, Ahuja A, Buros Novik J, Hellmann MD, et al. Contribution of systemic and somatic factors to clinical response and resistance to PD-L1 blockade in urothelial cancer: an exploratory multi-omic analysis. PLoS Med 2017;14:e1002309.ArticlePubMedPMC
- 68. Williams SA, Kivimaki M, Langenberg C, Hingorani AD, Casas JP, Bouchard C, et al. Plasma protein patterns as comprehensive indicators of health. Nat Med 2019;25:1851–7.ArticlePubMedPMC
- 69. The Lancet. Is digital medicine different? Lancet 2018;392:95.ArticlePubMed
- 70. AI diagnostics need attention. Nature 2018;555:285.ArticlePDF
- 71. Kim DW, Jang HY, Kim KW, Shin Y, Park SH. Design characteristics of studies reporting the performance of artificial intelligence algorithms for diagnostic analysis of medical images: results from recently published papers. Korean J Radiol 2019;20:405–10.ArticlePubMedPMC
- 72. Ibrahim H, Liu X, Rivera SC, Moher D, Chan AW, Sydes MR, et al. Reporting guidelines for clinical trials of artificial intelligence interventions: the SPIRIT-AI and CONSORT-AI guidelines. Trials 2021;22:11.ArticlePubMedPMC
- 73. Sounderajah V, Ashrafian H, Aggarwal R, De Fauw J, Denniston AK, Greaves F, et al. Developing specific reporting guidelines for diagnostic accuracy studies assessing AI interventions: the STARD-AI Steering Group. Nat Med 2020;26:807–8.ArticlePubMed
- 74. England JR, Cheng PM. Artificial intelligence for medical image analysis: a guide for authors and reviewers. AJR Am J Roentgenol 2019;212:513–9.ArticlePubMed
- 75. Park SH, Han K. Methodologic guide for evaluating clinical performance and effect of artificial intelligence technology for medical diagnosis and prediction. Radiology 2018;286:800–9.ArticlePubMed
References
Figure & Data
References
Citations
- Predicting postoperative outcomes in lumbar spinal fusion: development of a machine learning model
Lukas Schönnagel, Thomas Caffard, Tu-Lan Vu-Han, Jiaqi Zhu, Isaac Nathoo, Kyle Finos, Gaston Camino-Willhuber, Soji Tani, Ali. E. Guven, Henryk Haffer, Maximilian Muellner, Artine Arzani, Erika Chiapparelli, Krizia Amoroso, Jennifer Shue, Roland Duculan,
The Spine Journal.2024; 24(2): 239. CrossRef - A CT-based Deep Learning Model for Predicting Subsequent Fracture Risk in Patients with Hip Fracture
Yisak Kim, Young-Gon Kim, Jung-Wee Park, Byung Woo Kim, Youmin Shin, Sung Hye Kong, Jung Hee Kim, Young-Kyun Lee, Sang Wan Kim, Chan Soo Shin
Radiology.2024;[Epub] CrossRef - Applying machine learning classification techniques for disease diagnosis from medical imaging data using Transformer based Attention Guided CNN (TAGCNN)
Saleh Alyahyan
Multimedia Tools and Applications.2024;[Epub] CrossRef - Development and validation of common data model-based fracture prediction model using machine learning algorithm
Sung Hye Kong, Sihyeon Kim, Yisak Kim, Jung Hee Kim, Kwangsoo Kim, Chan Soo Shin
Osteoporosis International.2023; 34(8): 1437. CrossRef - Machine learning algorithms for predicting the risk of fracture in patients with diabetes in China
Sijia Chu, Aijun Jiang, Lyuzhou Chen, Xi Zhang, Xiurong Shen, Wan Zhou, Shandong Ye, Chao Chen, Shilu Zhang, Li Zhang, Yang Chen, Ya Miao, Wei Wang
Heliyon.2023; 9(7): e18186. CrossRef - Leveraging Artificial Intelligence and Machine Learning in Regenerative Orthopedics: A Paradigm Shift in Patient Care
Madhan Jeyaraman, Harish V K Ratna, Naveen Jeyaraman, Aakaash Venkatesan, Swaminathan Ramasubramanian , Sankalp Yadav
Cureus.2023;[Epub] CrossRef - Quality use of artificial intelligence in medical imaging: What do radiologists need to know?
Stacy K Goergen, Helen ML Frazer, Sandeep Reddy
Journal of Medical Imaging and Radiation Oncology.2022; 66(2): 225. CrossRef
 PubReader
 ePub Link
 Cite
Cite