
Articles
- Page Path
- HOME > Endocrinol Metab > Volume 36(1); 2021 > Article
-
Original ArticleLactate Dehydrogenase A as a Potential New Biomarker for Thyroid Cancer
 Audioslide
 -
Eun Jeong Ban1,2*
 , Daham Kim3*, Jin Kyong Kim4, Sang-Wook Kang4, Jandee Lee4, Jong Ju Jeong4, Kee-Hyun Nam4, Woong Youn Chung4, Kunhong Kim5
 -
Endocrinology and Metabolism 2021;36(1):96-105.
DOI: https://doi.org/10.3803/EnM.2020.819
Published online: February 24, 2021
1Department of Surgery, Dongguk University Ilsan Hospital, Dongguk University College of Medicine, Goyang, Korea
2Department of Surgery, Graduate School, Yonsei University College of Medicine, Seoul, Korea
3Department of Internal Medicine, Institute of Endocrine Research, Yonsei University College of Medicine, Seoul, Korea
4Department of Surgery, Yonsei University College of Medicine, Seoul, Korea
5Department of Biochemistry and Molecular Biology, Yonsei University College of Medicine, Seoul, Korea
- Corresponding author: Kee-Hyun Nam. Department of Surgery, Yonsei University College of Medicine, 50-1 Yonsei-ro, Seodaemun-gu, Seoul 03722, Korea Tel: +82-2-2228-2100, Fax: +82-2-313-8289, E-mail: khnam@yuhs.ac
- *These authors contributed equally to this work.
Copyright © 2021 Korean Endocrine Society
This is an Open Access article distributed under the terms of the Creative Commons Attribution Non-Commercial License (https://creativecommons.org/licenses/by-nc/4.0/) which permits unrestricted non-commercial use, distribution, and reproduction in any medium, provided the original work is properly cited.
ABSTRACT
-
Background
- Several cancers show increased levels of lactate dehydrogenase A (LDHA), which are associated with cancer progression. However, it remains unclear whether LDHA levels are associated with papillary thyroid cancer (PTC) aggressiveness or with the presence of the PTC prognostic marker, the BRAFV600E mutation. This study aimed to evaluate the potential of LDHA as a PTC prognostic marker.
-
Methods
- LDHA expression was examined in 83 PTC tissue specimens by immunohistochemistry. Human thyroid cell lines were genetically manipulated to overexpress BRAFV600E or were treated with a BRAF-specific short hairpin RNA (shBRAF), whose effects on LDHA expression were evaluated by Western blotting. Data from 465 PTC patients were obtained from The Cancer Genome Atlas (TCGA) database and analyzed to validate the in vitro results.
-
Results
- LDHA was aberrantly overexpressed in PTC. Intense immunostaining for LDHA was observed in PTC specimens carrying mutated BRAF, whereas the intensity was less in wild-type BRAF samples. Overexpression of BRAFV600E resulted in LDHA upregulation, whereas treatment with shBRAF downregulated LDHA in human thyroid cell lines. Furthermore, LDHA mRNA expression was significantly elevated and associated with BRAFV600E expression in thyroid cancer tissues from TCGA database. Additionally, LDHA overexpression was found to be correlated with aggressive clinical features of PTC, such as lymph node metastases and advanced tumor stages.
-
Conclusion
- LDHA overexpression is associated with the BRAFV600E mutation and an aggressive PTC behavior. Therefore, LDHA may serve as a biomarker and therapeutic target in PTC.
- Cancer metabolism, which exploits dysregulated metabolic pathways, is characterized by increased glycolysis [1]. In normal cells, adenosine triphosphate is mostly produced by mitochondrial oxidative phosphorylation, while cancer cells tend to use glycolysis, despite the presence of oxygen. Named Warburg effect, this process relies on lactate dehydrogenase A (LDHA) to convert pyruvate to lactate in the final step of glycolysis [2]. LDHA is the key enzyme in glycolysis.
- Several studies have revealed high expression of LDHA in various cancers and its association with cancer progression. In esophageal squamous cell carcinoma, LDHA expression is upregulated, whereas LDHA knockdown inhibits cell growth and migration in vitro and impairs tumorigenesis in vivo [3]. LDHA expression is also upregulated in primary clear cell renal carcinoma, wherein LDHA shows potential utility as a prognostic marker [4]. Significantly elevated LDHA has also been observed in patients with gastric cancer, and LDHA expression was reported to be correlated with lower overall survival in these patients [5].
- Thyroid cancer is the most common endocrine malignancy [6]. The rising incidence of thyroid cancer, especially papillary thyroid cancer (PTC), is a worldwide phenomenon [7,8]. The BRAFV600E mutation, which is the most common driver mutation in PTC, is known to have aggressive features, such as extrathyroidal extension, lymph node metastasis, and an advanced cancer stage [9–11]. However, the BRAFV600E mutation is not an independent predictor of PTC, and novel prognostic markers are needed. Recently, some progress has been achieved regarding thyroid tumor metabolism [12]. Previous studies have demonstrated that the expression of glycolytic enzymes is upregulated in thyroid cancer [13,14]. However, it is not entirely clear whether LDHA levels are associated with the aggressiveness of PTC or the presence of BRAFV600E mutation [15]. Considering the pivotal role of LDHA in the regulation of metabolic pathways, its implication in the metabolic switch of PTC warrants further investigation.
- This study aimed to evaluate the potential of LDHA as a prognostic marker of clinicopathological features and clinical outcomes in PTC.
INTRODUCTION
- Human tissue samples
- Human thyroid cancer tissue samples (n=83) and matched contralateral normal tissue samples (n=81), who underwent thyroidectomy for PTC between October 2005 and April 2014 at the Yonsei University Severance Hospital (Seoul, Korea), were obtained. We included patients whose preoperative 2-deoxy-2-[18F]fluoro-D-glucose (FDG) positron emission tomography integrated with computed tomography imaging and BRAFV600E mutation results were available. Patients who had a history of other cancers or autoimmune thyroiditis (proven by the presence of elevated levels of thyroid antibodies and by thyroid imaging) were excluded. All samples were obtained as formalin-fixed paraffin-embedded tissue blocks. This study was conducted in accordance with the Declaration of Helsinki and was approved by the Institutional Review Board of the Severance Hospital (No. 4-2015-0677). Written informed consent was obtained from all patients included in the study.
- Data from The Cancer Genome Atlas thyroid cancer database
- Publicly available mRNA sequencing (RNA-Seq) data, somatic mutation data, and clinical information of 465 patients with thyroid cancer from The Cancer Genome Atlas (TCGA) database (version 2016_01_28; https://gdac.broadinstitute.org) were analyzed [16,17]. The overall survival, disease-free survival, disease-specific survival, and progression-free survival data were downloaded from cBioPortal (TCGA, Firehose Legacy, and PanCancer Atlas). All the collected data were fully anonymized before we accessed the patient information. Patients with a history of any other malignancy and those without BRAF or LDHA information were not included in the study. Thyroid cancer staging was based on the 7th edition of the American Joint Committee on Cancer (AJCC) cancer staging system.
- Cell culture
- Three human thyroid cell lines (Nthy-ori 3-1, SNU-790, and 8505C) were used for in vitro experiments. Nthy-ori 3-1 cells were provided by Dr. Seongho Ryu (Soonchunhyang University, Cheonan, Korea), and 8505C cells were provided by Dr. Seong Jin Lee (Hallym University, Chuncheon, Korea). SNU-790 cells were purchased from the Korean Cell Line Bank (KCLB No. 00790.1, Seoul, Korea). All the cell lines were authenticated by short tandem repeat profiling and confirmed to be free of Mycoplasma contamination. Cells were cultured in RPMI-1640 medium (Gibco, Thermo Fisher Scientific, Waltham, MA, USA), supplemented with 10% fetal bovine serum (HyClone, Logan, UT, USA) and 1% penicillin/streptomycin, in a humidified atmosphere of 5% CO2 and 95% air at 37°C.
- Transfection
- pCDH-B-Raf and pCDH-B-RafV600E vectors were kindly provided by Tae Jun Park [18]. Lentiviral particles were generated using three plasmids, VSVG, RSV-REV, and PMDLg/pPRE, cotransfected with the pCDH-B-Raf or pCDH-B-RafV600E plasmid in HEK293FT cells (R70007, Invitrogen, Carlsbad, CA, USA) using the Lipofectamine 2000 transfection reagent (#11668019, Invitrogen). Two days after the transfection, the culture medium was collected and passed through a 0.45-μm filter. The purified lentiviral particles were used to infect Nthy-ori 3-1 cells.
- The BRAF-specific short hairpin RNA (shRNA) and a scrambled negative control were purchased from OriGene (Rockville, MD, USA). Cells were seeded onto 6-well plates and transfected with the shRNA using Lipofectamine 2000 (Invitrogen). The shRNA-transfected cells were subjected to Western blot analysis 72 hours after transfection.
- Western blot analysis
- Western blot analysis was performed as previously described in a study [19]. Membranes were immunoassayed with antibodies specific to the following antigens: LDHA (1:1,000; 3582S), extracellular signal-regulated kinase 1/2 (ERK1/2; 1:1,000; 9102S), phosphorylated ERK1/2 (pERK1/2; 1:1,000; 9106S, Cell Signaling Technology, Danvers, MA, USA), β-actin (1:5,000; A1978, Sigma-Aldrich, St. Louis, MO, USA), and BRAF (1:1,000; sc-5284, Santa Cruz Biotechnology, Dallas, TX, USA). The secondary antibodies included horseradish peroxidase-conjugated goat anti-rabbit immunoglobulin G (IgG; 1:5,000; 31460) and goat anti-mouse IgG (1:5,000; 31430, Thermo Fisher Scientific). Signals were visualized using Amersham ECL Western blotting detection reagents (GE Healthcare Life Sciences, Chicago, IL, USA).
- Immunohistochemistry
- Paraffin-embedded tissue specimens were cut into 4-μm-thick sections, and immunohistochemistry (IHC) staining was performed using a Discovery XT autoimmunostainer (750-701, Ventana, Tucson, AZ, USA) with monoclonal antibodies against glucose transporter 1 (GLUT1; 1:100; sc-377228, Santa Cruz Biotechnology), pyruvate kinase isoform M2 (PKM2; 1:500; 4053S), and LDHA (1:100; 3582S, Cell Signaling Technology), according to the manufacturer’s instructions.
- The IHC results were assessed by two experts using immunoreactive scoring by multiplying the intensity of staining (I) (0–3 points: absent, weak, intermediate, and strong, respectively) with the percentage of positive tumor cells (P) (0–4 points: 0%, 1%–24%, 25%–49%, 50%–74%, and 75%–100%, respectively). The final calculated immunoreactive score (H=P×I) was evaluated according to the following scale: low (0–4 points), moderate (6–8 points), and high (9–12 points).
- Statistical analysis
- IBM SPSS Statistics version 25 (IBM, Armonk, NY, USA) was used for all statistical analyses. Categorical variables are presented as the number and percentage, and continuous variables are presented as the mean±standard deviation. Statistical comparisons of mean values were performed using Student’s t test for two groups and analysis of variance for more than two groups. As an exception, the Mann-Whitney U test and Kruskal-Wallis test were used to compare the mRNA expression results, as they usually do not present a normal distribution. Group comparisons were performed using the chi-square test or a linear-by-linear association test, as appropriate. Survival analyses were performed using Gehan’s generalized Wilcoxon method. Univariate and multivariate analyses were used to determine the variables independently associated with lymph node metastasis. Odds ratios and 95% confidence intervals were determined. Differences with a P value <0.05 were considered statistically significant.
METHODS
- Expression of glycolytic enzymes in human thyroid cancer tissues
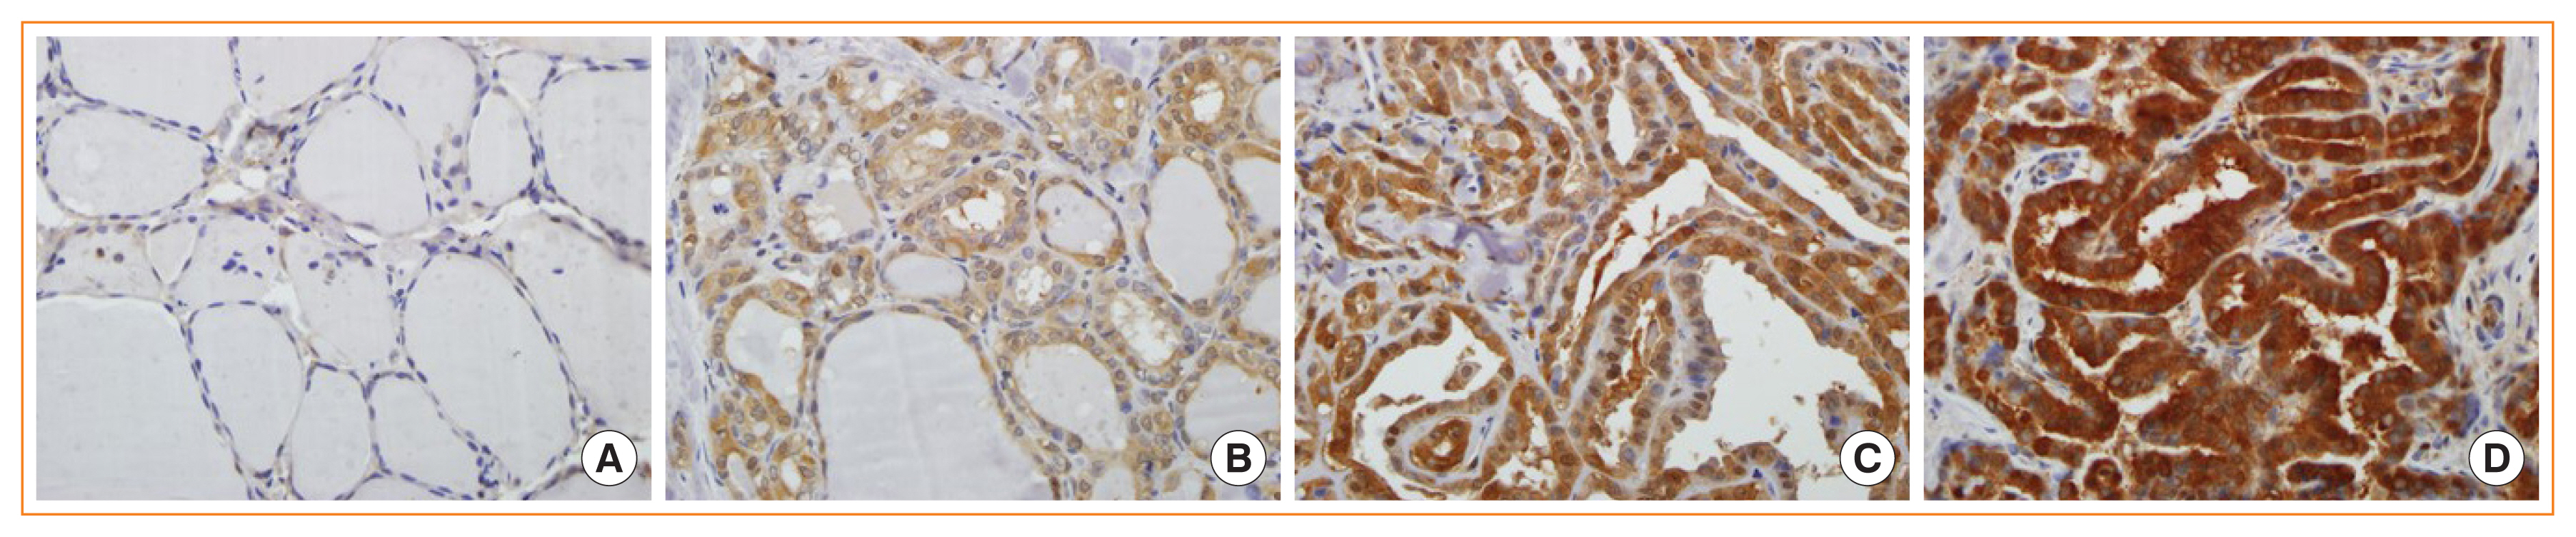
- To evaluate whether glycolysis is increased in PTC, the levels of important glycolytic enzymes, such as GLUT1, PKM2, and LDHA were compared among 83 cancer specimens and 81 matched normal specimens from the same patients by immunohistochemical staining (Fig. 1). Basal characteristics of 83 patients included in the study are shown in Supplemental Table S1. GLUT1, PKM2, and LDHA levels were significantly upregulated in the thyroid cancer tissues compared with their normal counterparts (P<0.001) (Table 1).
- Next, glycolytic enzyme levels were compared according to the BRAFV600E mutational status. Of the 83 patients with thyroid cancer, 71 (85.5%) had PTC-positive BRAFV600E mutation, and 12 (14.5%) had wild-type (WT) BRAF. GLUT1 and PKM2 levels were similar between the BRAFV600E and WT BRAF groups, whereas LDHA level was significantly higher in the BRAFV600E group (P=0.020) (Table 2). These results demonstrate a clear association between the levels of LDHA and the presence of the BRAFV600E mutation in patients with PTC.
- LDHA expression in human thyroid cell lines
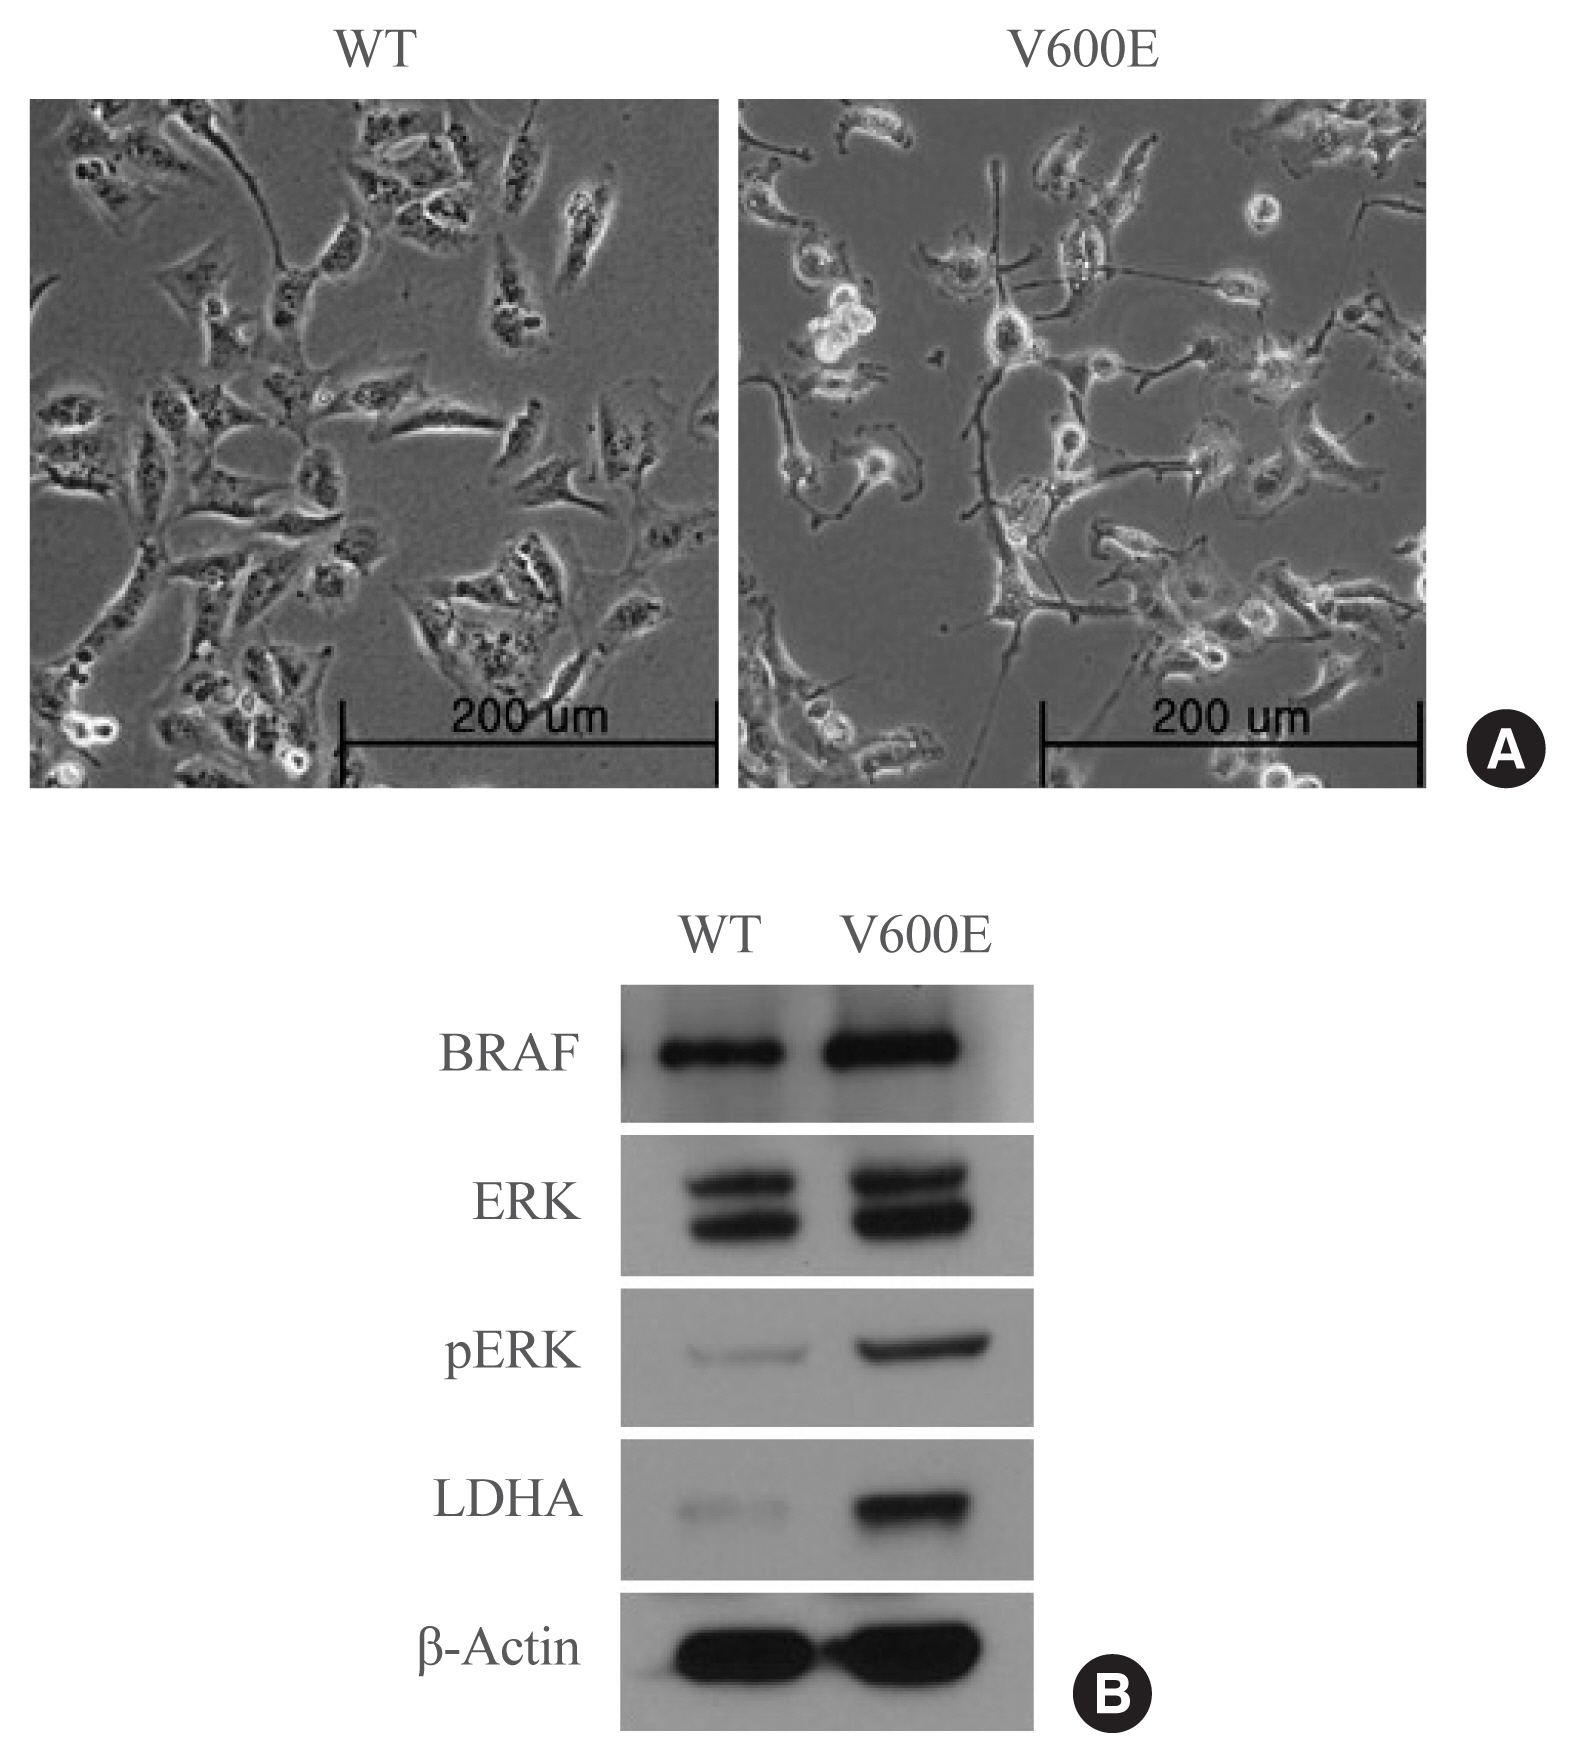
- To investigate whether the presence of the BRAFV600E mutation leads to the upregulation of LDHA expression in thyroid cancer, LDHA level was analyzed in BRAF-overexpressing thyroid cells. BRAFV600E-overexpressing Nthy-ori 3-1 cells had a spindle-transformed shape that may be the result of epithelial-mesenchymal transition induced by the BRAFV600E mutation (Fig. 2A). BRAFV600E-overexpressing Nthy-ori 3-1 cells showed significantly higher levels of pERK than WT BRAF-overexpressing cells (Fig. 2B), as well as high levels of LDHA. Thus, overexpression of BRAFV600E in vitro activated the mitogen-activated protein kinase signaling pathway, thereby promoting LDHA expression.
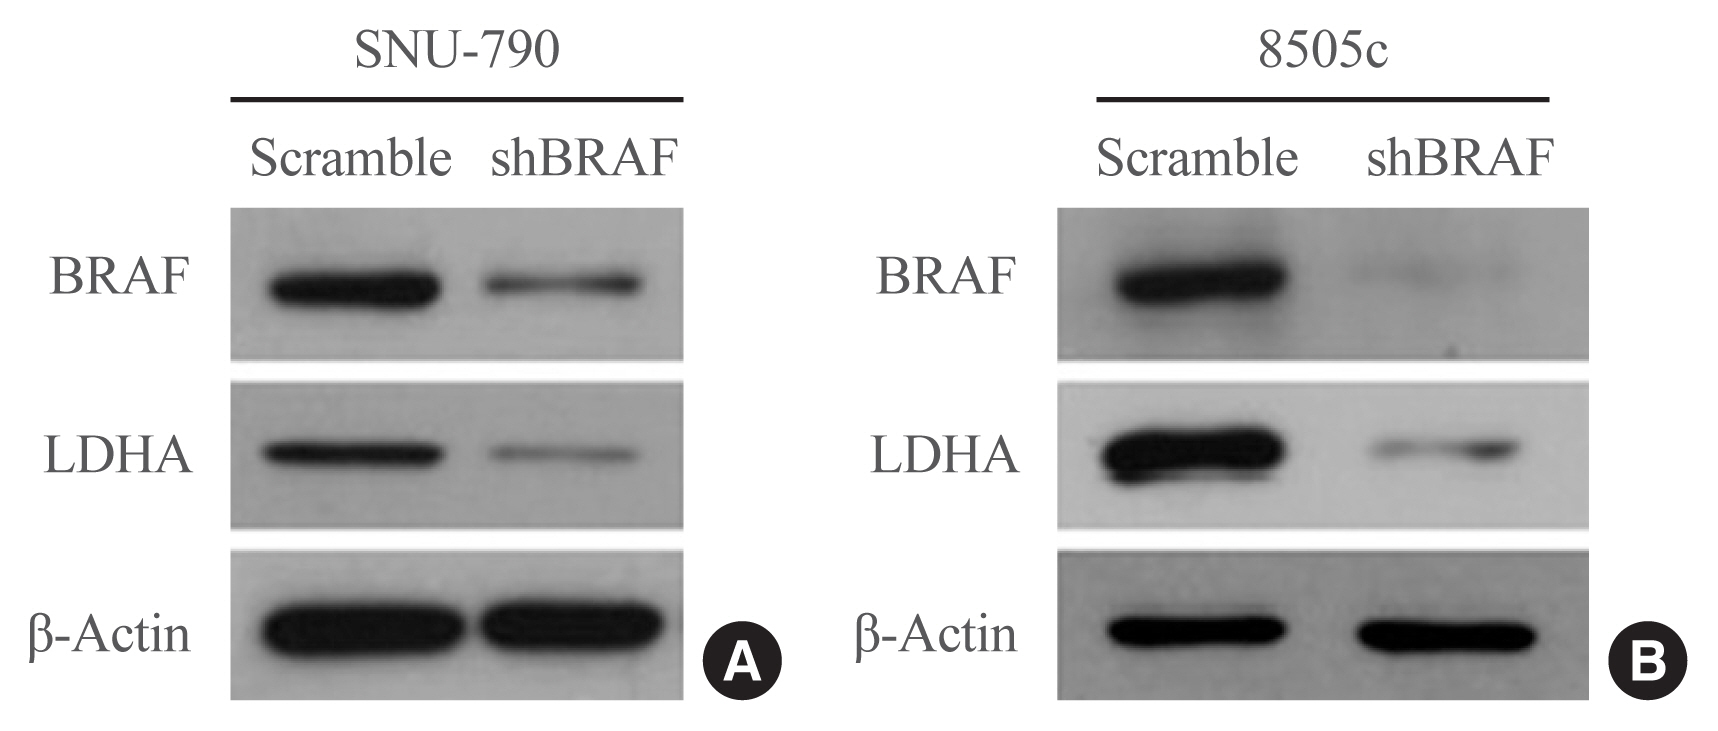
- Next, the effects of BRAF inhibition on LDHA expression were investigated in the human thyroid cell lines. BRAF knockdown experiments were performed in SNU-790 and 8505c cells using a BRAF-specific shRNA (shBRAF). BRAF inhibition led to a reduced expression of LDHA in these cell lines (Fig. 3). These results suggest that the presence of the BRAFV600E mutation may lead to the upregulation of LDHA expression through the BRAF/mitogen-activated protein kinase signaling pathway in thyroid cancer.
- TCGA thyroid cancer data according to the LDHA mRNA expression status
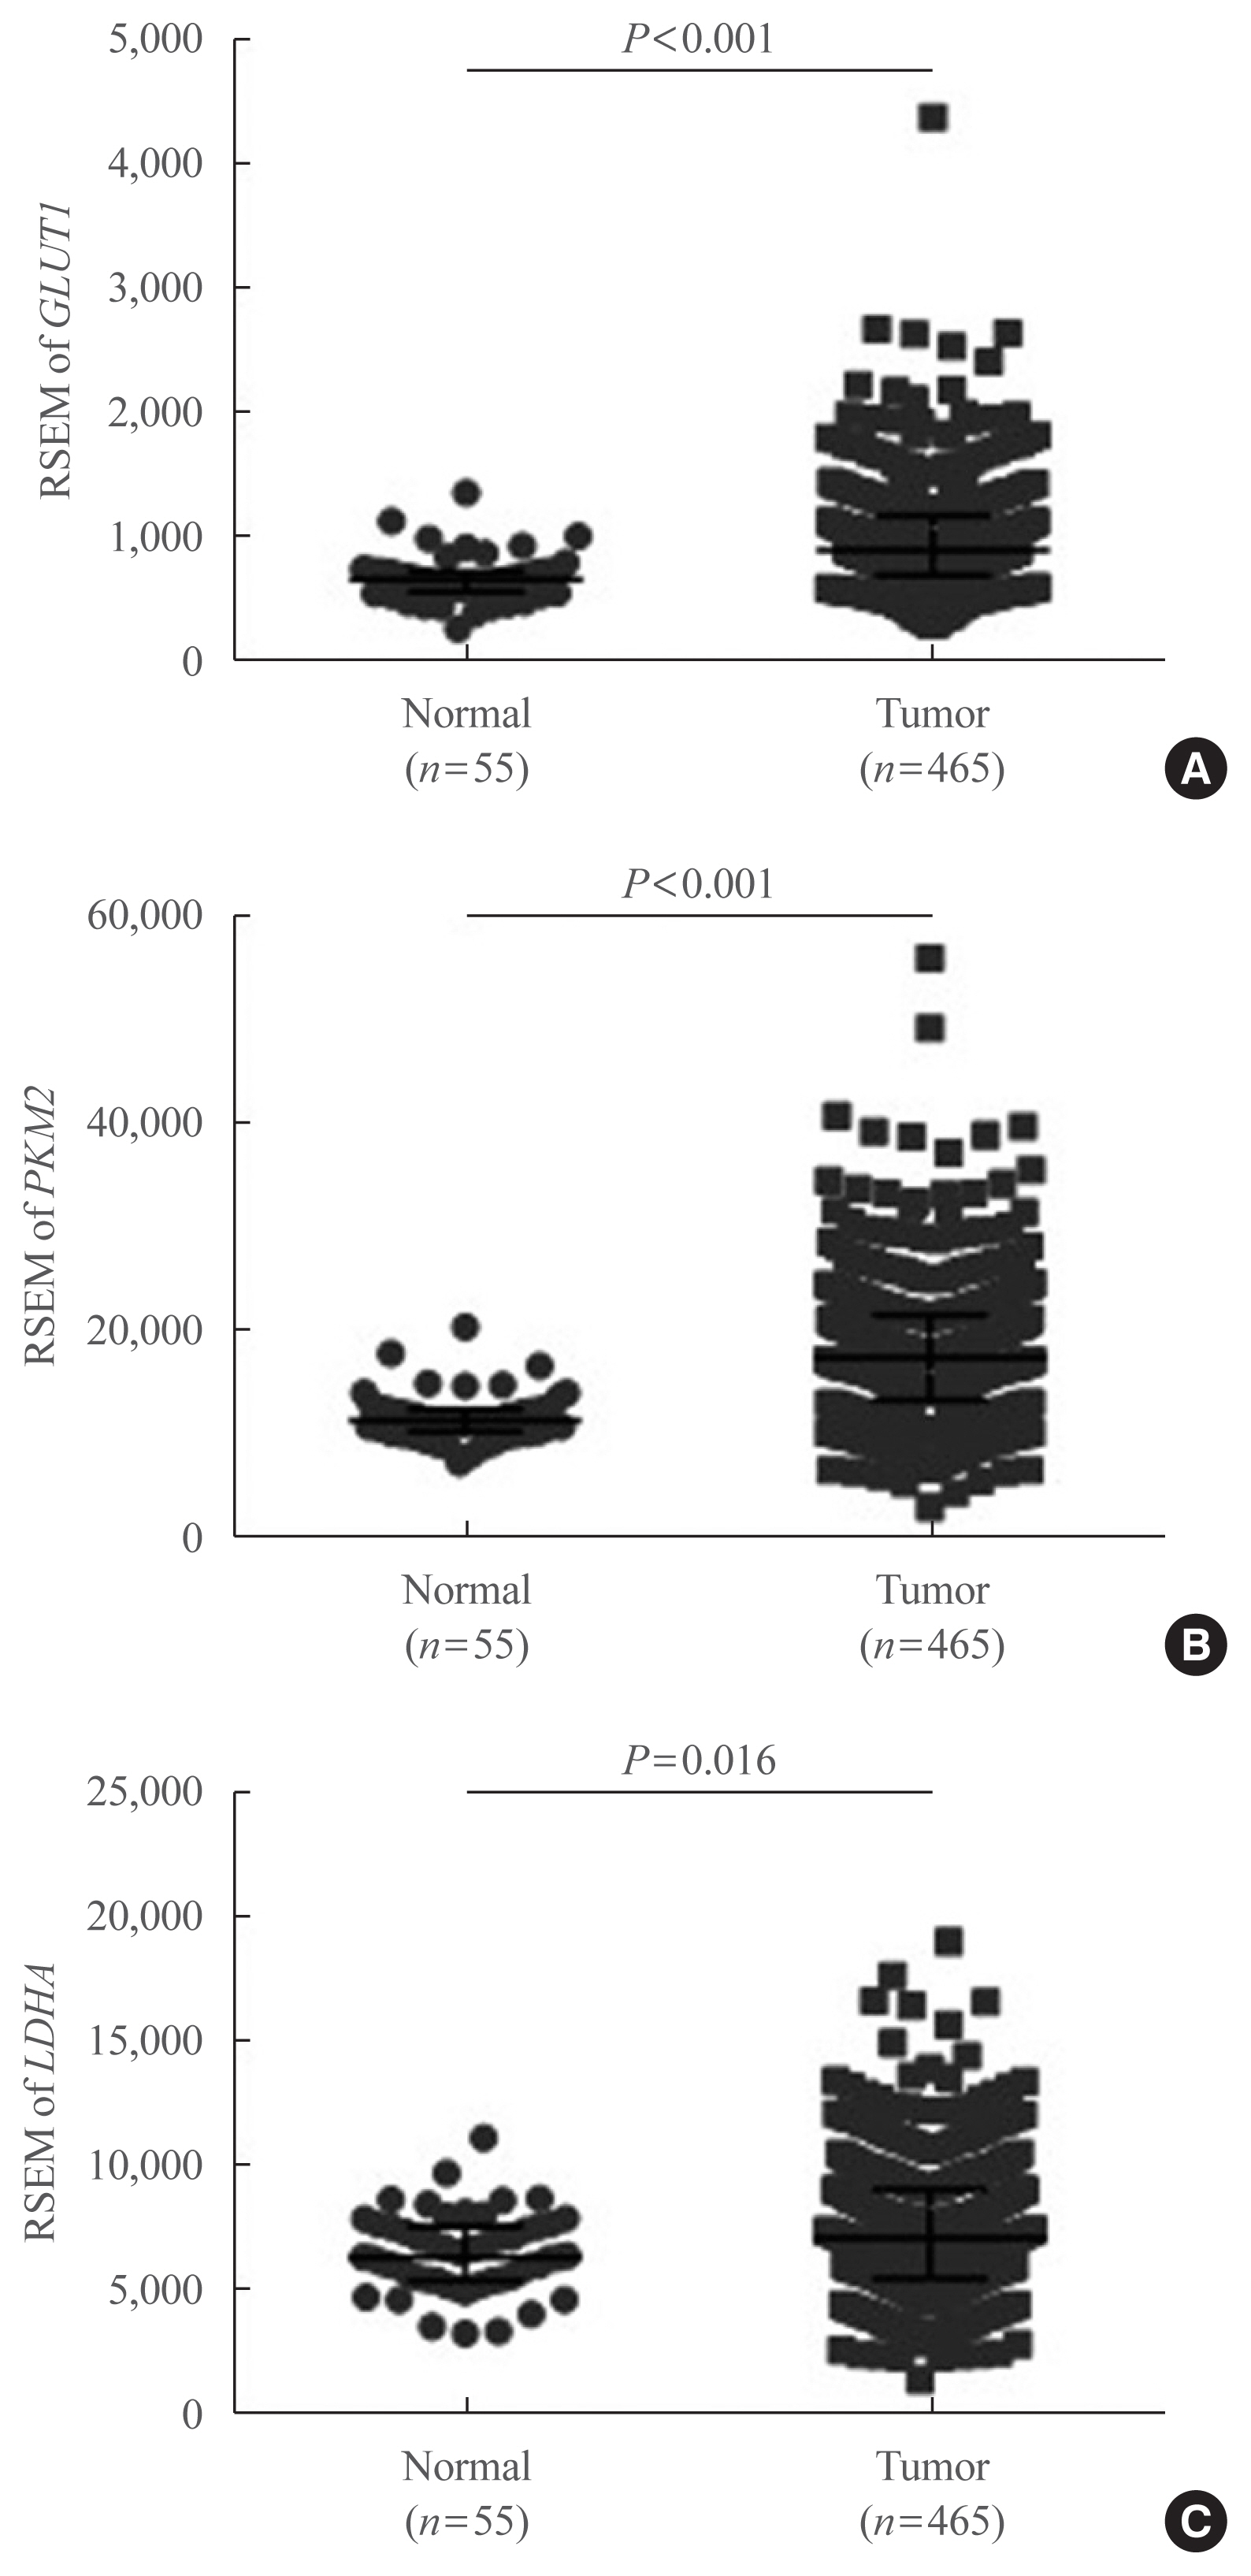
- To confirm our findings on LDHA expression patterns in PTC and evaluate whether LDHA expression is associated with the aggressiveness of PTC, as well as with the presence of the BRAFV600E mutation, data obtained from TCGA thyroid cancer database were evaluated. First, mRNA levels of GLUT1, PKM2, and LDHA were examined, revealing that GLUT1 and PKM2 expression was significantly elevated in thyroid cancer tissues compared with normal tissues (P<0.001) (Fig. 4A, B). LDHA mRNA levels were also significantly higher in thyroid cancer tissues (P=0.016) (Fig. 4C). The mRNA levels of GLUT1, PKM2, and LDHA in paired PTC tissues and normal tissues were also examined and shown in Supplemental Fig. S1. These findings were consistent with the previous IHC results.
- Next, the patients with PTC were divided into three groups based on the LDHA expression: low (n=155), moderate (n=155), and high (n=155) expression groups (Table 3).
- The analysis of the clinicopathological characteristics of the patients revealed that high LDHA expression was associated with extrathyroidal extension, T stage, N stage, TNM stage, and BRAFV600E mutation, but not with other parameters, such as age and sex. The thyroid differentiation score was negatively associated with high LDHA levels. Moreover, univariate and multivariate analyses confirmed that high LDHA expression was associated with lymph node metastases (Table 4). These data indicate that high expression of LDHA may be used as a biomarker for poor prognosis in patients with PTC. We also compared the survival curves of groups with different levels of LDHA expression. The overall survival, disease-free survival, disease-specific survival, and progression-free survival did not differ between the three groups (P=0.651, P=0.244, P=0.582, and P=0.290, respectively) (Supplemental Fig. S2). The mean survival rate after 10 years was higher than 90%.
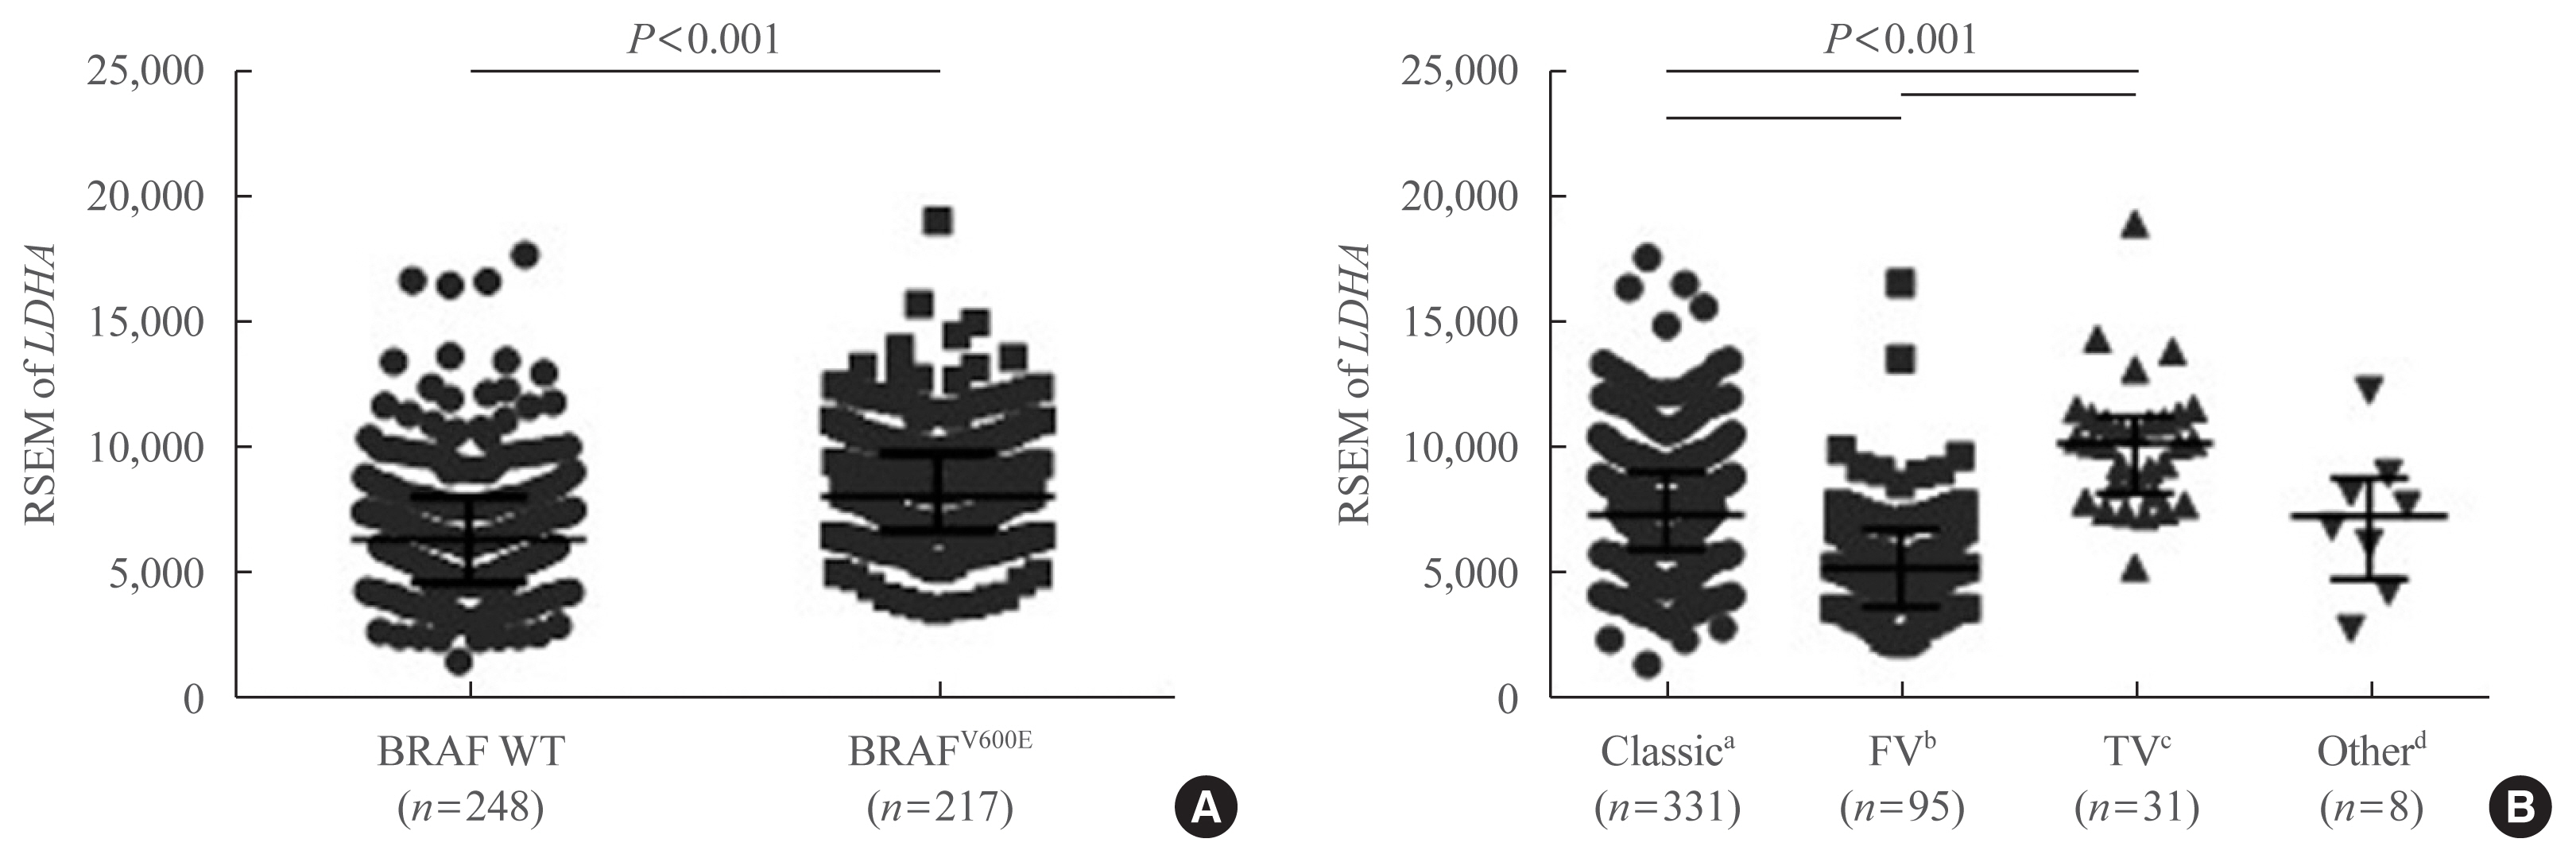
- To further confirm the IHC findings regarding LDHA expression patterns with respect to the BRAFV600E mutational status, the latter two parameters were compared in the patient data from TCGA database. LDHA expression was enhanced in patients with PTC who harbored the BRAFV600E mutation compared with those who had the WT gene (P<0.001) (Fig. 5A). Analysis of LDHA expression in light of PTC subtypes, namely classical/usual, follicular, tall-cell, and other uncommon PTC variants, revealed significantly higher LDHA level within the classical type than in the follicular variant type (P<0.001) (Fig. 5B), as well as in the tall-cell variant type than in the classical type (P<0.001). Taken together, these results indicate that LDHA overexpression is associated with the aggressiveness of PTC, as well as with the presence of the BRAFV600E mutation.
RESULTS
- Although partly attributed to overdiagnosis, the incidence of thyroid cancer, particularly PTC, has increased in recent years worldwide [7,8]. Nevertheless, a decreasing trend has been reported in thyroid cancer mortality [6]. Therefore, risk stratification and tailored management, along with the identification of novel prognostic markers, are crucial, yet unmet clinical goals in thyroid cancer management [20–22]. Herein, we showed that LDHA, a key glycolytic enzyme, could be used as a potential prognostic marker in thyroid cancer.
- We demonstrated that the levels of glycolytic enzymes, including LDHA, were significantly upregulated in PTC. These observations were further confirmed by the examination of the LDHA expression in a set of 465 cases of PTC from TCGA thyroid cancer database. Thus, similar to previous reports [13,14], the present study also revealed higher levels of GLUT1, PKM2, and LDHA in PTC compared with normal tissues.
- These dysregulated metabolic enzymes are the basis of cancer cell metabolic reprogramming. Abnormal overexpression of LDHA in several cancers is attributed to the activation of its upstream pathway by cancer-driving mutations [1]. A previous study demonstrated that the HIF1α–MYC–PGC-1β axis is altered by the BRAFV600E mutation, resulting in the inhibition of mitochondrial respiration and the enhancement of aerobic glycolysis. Moreover, LDHA and PKM2 are elevated in thyroid cancer samples with the BRAFV600E mutation [15]. Therefore, the levels of glycolytic enzymes in patients with PTC according to their BRAFV600E mutational status, which is the most common mutation found in thyroid cancer, were also evaluated. Contrary to results in previous studies [15,23], only LDHA expression was significantly higher in the BRAFV600E mutation group compared with that in the WT BRAF group. It might be due the different regulatory mechanism of each enzyme or sampling criteria [24]. LDHA is considered as a key checkpoint of anaerobic glycolysis. The relationship between the expression of LDHA and the presence of the BRAFV600E mutation was also supported by TCGA mRNA data.
- To elucidate the role of LDHA in thyroid cancer, further analysis of the relationship between aberrant LDHA expression and the presence of the BRAFV600E mutation was performed. LDHA levels were found to be significantly higher in BRAFV600E- than in WT BRAF-overexpressing thyroid cells. These cell line pairs are recognized as a suitable model to study the molecular alterations induced by the BRAFV600E mutation [25]. To the best of our knowledge, this study is the first to report that the BRAFV600E mutant protein causes LDHA overexpression in human thyroid cell lines. We validated this finding using a shBRAF in two human thyroid cell lines, showing that the BRAFV600E mutation plays a significant role in the regulation of LDHA expression in vitro. Notably, these findings are consistent with a recent report suggesting that BRAFV600E-mediated metabolic reprogramming increases glycolytic metabolism, which may mediate the Warburg effect [15]. However, we could not reveal the exact mechanism by which the BRAFV600E mutation regulated the expression of LDHA in this study. This is a limitation of our study.
- It was also demonstrated that high levels of LDHA correlate with aggressive clinical features of PTC, such as extrathyroidal extension, lymph node metastasis, and an advanced cancer stage. These aggressive features are related to the recurrence of PTC, poor response to treatment, and lower overall patient survival [26]. However, our survival analyses showed no differences between groups with different LDHA expression levels. This may be because most thyroid cancers grow slowly and are associated with a very favorable prognosis [21]. Univariate and multivariate analyses revealed that LDHA levels are an independent prognostic marker of lymph node metastasis in PTC. Furthermore, the data suggested that the BRAFV600E mutation may lead to tumor aggressiveness by altering the expression levels of glycolytic enzymes, such as LDHA. As indicated by recent studies, elevated LDHA levels promote the progression of malignant tumors by modulating lactic acid production, glycolysis, reactive oxygen species production, and the expression of numerous cancer-related proteins [1]. To the best of our knowledge, this is also the first study to evaluate and stratify clinicopathological characteristics of thyroid cancer according to the levels of LDHA expression.
- [18F]-FDG positron emission tomography integrated with computed tomography imaging is widely used in the diagnosis and prognostic evaluation of tumors. In particular, the [18F]-FDG uptake seems to be an indicator of poorly differentiated and highly malignant thyroid cancer [27]. Marked reduction in glucose consumption in LDHA-silenced cells may be accompanied by concurrent decrease in FDG uptake, suggesting a possible association between the FDG uptake and LDHA expression [24, 28]. It was also suggested that the presence of the BRAFV600E mutation is associated with the [18F]-FDG uptake and GLUT1 expression rates in PTC [29]. The relationship between LDHA levels and [18F]-FDG uptake was also analyzed but no relevant associations were identified (Supplemental Table S2). Possible reasons for this discordance include (1) [18F]-FDG uptake may not necessarily correlate with lactate production, because the upregulation of the pentose phosphate shunt may also result in increased glucose consumption; (2) glucose transporter activity is the major rate-limiting step of [18F]-FDG uptake in some tumors; and (3) very high incidence of BRAFV600E mutation may have made it difficult to evaluate the relationship [28]. However, further research is still needed.
- In summary, this study demonstrated that LDHA overexpression is correlated with aggressive clinical features of PTC. In particular, LDHA could serve as an independent prognostic marker of lymph node metastasis, and LDHA overexpression is associated with the presence of the BRAFV600E mutation in PTC. At present, the most widely accepted prognostic markers for thyroid cancer are the BRAFV600E mutation and mutations in the human telomerase reverse transcriptase promoter [30,31]. However, there is a clear need for novel prognostic markers [7]. The integration of LDHA expression with these well-established markers may help accurately predict poor prognosis in patients with thyroid cancer. To improve our current understanding of thyroid cancer, as well as its management and treatment, more in-depth insights into the role of LDHA are warranted.
DISCUSSION
Supplementary Information
Supplemental Table S1.
Supplemental Table S2.
Supplemental Fig. S1.
Supplemental Fig. S2.
-
Acknowledgements
- This study was supported by a faculty research grant from Yonsei University College of Medicine (6-2015-0054).
-
CONFLICTS OF INTEREST
No potential conflict of interest relevant to this article was reported.
-
AUTHOR CONTRIBUTIONS
Conception or design: E.J.B., D.K., K.H.N., K.K. Acquisition, analysis, or interpretation of data: E.J.B., D.K., J.K.K., S.W.K., J.L., J.J.J., K.H.N., W.Y.C. Drafting the work or revising: E.J.B., D.K., K.H.N. Final approval of the manuscript: K.H.N., W.Y.C., K.K.
Article information
| Variable | Univariate analysis | Multivariate analysisa | ||||
|---|---|---|---|---|---|---|
|
|
|
|||||
| OR | 95% CI | P value | OR | 95% CI | P value | |
| Age | 0.987 | 0.976–0.999 | 0.038 | |||
|
|
||||||
| Female sex | 0.599 | 0.394–0.910 | 0.016 | 0.735 | 0.461–1.174 | 0.198 |
|
|
||||||
| Multifocality | 1.461 | 1.007–2.120 | 0.046 | 1.602 | 1.057–2.428 | 0.026 |
|
|
||||||
| Extrathyroidal extension | ||||||
| Negative | - | - | - | - | - | - |
| Minimal | 2.596 | 1.688–3.992 | <0.001 | 1.516 | 0.797–2.882 | 0.205 |
| Moderate/advanced | 11.948 | 2.668–53.506 | 0.001 | 4.080 | 0.381–43.719 | 0.245 |
|
|
||||||
| Tumor size, cm | 1.198 | 1.062–1.351 | 0.003 | |||
|
|
||||||
| T stage | ||||||
| T1 | - | - | - | - | - | - |
| T2 | 1.600 | 0.981–2.610 | 0.060 | 1.705 | 1.006–2.890 | 0.048 |
| T3 | 2.933 | 1.803–4.774 | <0.001 | 2.121 | 1.074–4.188 | 0.030 |
| T4 | 12.267 | 3.384–44.463 | <0.001 | 3.398 | 0.407–28.396 | 0.259 |
|
|
||||||
| LDHA expression | ||||||
| Low | - | - | - | - | - | - |
| Moderate | 2.380 | 1.484–3.816 | 0.001 | 2.540 | 1.507–4.283 | <0.001 |
| High | 3.703 | 2.303–5.957 | <0.001 | 2.920 | 1.685–5.059 | <0.001 |
|
|
||||||
| BRAFV600E mutation | 1.466 | 1.015–2.118 | 0.041 | 0.962 | 0.623–1.484 | 0.861 |
- 1. Feng Y, Xiong Y, Qiao T, Li X, Jia L, Han Y. Lactate dehydrogenase A: a key player in carcinogenesis and potential target in cancer therapy. Cancer Med 2018;7:6124–36.ArticlePubMedPMC
- 2. Woodford MR, Chen VZ, Backe SJ, Bratslavsky G, Mollapour M. Structural and functional regulation of lactate dehydrogenase-A in cancer. Future Med Chem 2020;12:439–55.ArticlePubMed
- 3. Yao F, Zhao T, Zhong C, Zhu J, Zhao H. LDHA is necessary for the tumorigenicity of esophageal squamous cell carcinoma. Tumour Biol 2013;34:25–31.ArticlePubMed
- 4. Girgis H, Masui O, White NM, Scorilas A, Rotondo F, Seivwright A, et al. Lactate dehydrogenase A is a potential prognostic marker in clear cell renal cell carcinoma. Mol Cancer 2014;13:101.ArticlePubMedPMC
- 5. Sun X, Sun Z, Zhu Z, Guan H, Zhang J, Zhang Y, et al. Clinicopathological significance and prognostic value of lactate dehydrogenase A expression in gastric cancer patients. PLoS One 2014;9:e91068.ArticlePubMedPMC
- 6. Lim H, Devesa SS, Sosa JA, Check D, Kitahara CM. Trends in thyroid cancer incidence and mortality in the United States, 1974–2013. JAMA 2017;317:1338–48.ArticlePubMedPMC
- 7. Kim WB, Jeon MJ, Kim WG, Kim TY, Shong YK. Unmet clinical needs in the treatment of patients with thyroid cancer. Endocrinol Metab (Seoul) 2020;35:14–25.ArticlePubMedPMC
- 8. Wiltshire JJ, Drake TM, Uttley L, Balasubramanian SP. Systematic review of trends in the incidence rates of thyroid cancer. Thyroid 2016;26:1541–52.ArticlePubMed
- 9. Chung JH. BRAF and TERT promoter mutations: clinical application in thyroid cancer. Endocr J 2020;67:577–84.ArticlePubMed
- 10. Kim TH, Park YJ, Lim JA, Ahn HY, Lee EK, Lee YJ, et al. The association of the BRAF(V600E) mutation with prognostic factors and poor clinical outcome in papillary thyroid cancer: a meta-analysis. Cancer 2012;118:1764–73.ArticlePubMed
- 11. Song YS, Lim JA, Park YJ. Mutation profile of well-differentiated thyroid cancer in Asians. Endocrinol Metab (Seoul) 2015;30:252–62.ArticlePubMedPMC
- 12. Wen SS, Zhang TT, Xue DX, Wu WL, Wang YL, Wang Y, et al. Metabolic reprogramming and its clinical application in thyroid cancer. Oncol Lett 2019;18:1579–84.PubMedPMC
- 13. Kachel P, Trojanowicz B, Sekulla C, Prenzel H, Dralle H, Hoang-Vu C. Phosphorylation of pyruvate kinase M2 and lactate dehydrogenase A by fibroblast growth factor receptor 1 in benign and malignant thyroid tissue. BMC Cancer 2015;15:140.ArticlePubMedPMC
- 14. Ciampi R, Vivaldi A, Romei C, Del Guerra A, Salvadori P, Cosci B, et al. Expression analysis of facilitative glucose transporters (GLUTs) in human thyroid carcinoma cell lines and primary tumors. Mol Cell Endocrinol 2008;291:57–62.ArticlePubMed
- 15. Gao Y, Yang F, Yang XA, Zhang L, Yu H, Cheng X, et al. Mitochondrial metabolism is inhibited by the HIF1α-MYC-PGC-1β axis in BRAF V600E thyroid cancer. FEBS J 2019;286:1420–36.ArticlePubMed
- 16. Cancer Genome Atlas Research Network. Integrated genomic characterization of papillary thyroid carcinoma. Cell 2014;159:676–90.PubMedPMC
- 17. Cancer Genome Atlas Research Network. Weinstein JN, Collisson EA, Mills GB, Shaw KR, Ozenberger BA, et al. The cancer genome atlas pan-cancer analysis project. Nat Genet 2013;45:1113–20.ArticlePubMedPMC
- 18. Kim YH, Choi YW, Han JH, Lee J, Soh EY, Park SH, et al. TSH signaling overcomes B-RafV600E-induced senescence in papillary thyroid carcinogenesis through regulation of DUSP6. Neoplasia 2014;16:1107–20.ArticlePubMedPMC
- 19. Ko H, Kim S, Jin CH, Lee E, Ham S, Yook JI, et al. Protein kinase casein kinase 2-mediated upregulation of N-cadherin confers anoikis resistance on esophageal carcinoma cells. Mol Cancer Res 2012;10:1032–8.ArticlePubMed
- 20. Hanahan D, Weinberg RA. Hallmarks of cancer: the next generation. Cell 2011;144:646–74.ArticlePubMed
- 21. Iniguez-Ariza NM, Brito JP. Management of low-risk papillary thyroid cancer. Endocrinol Metab (Seoul) 2018;33:185–94.ArticlePubMedPMC
- 22. Jeon MJ, Kim WG, Kim TH, Kim HK, Kim BH, Yi HS, et al. Disease-specific mortality of differentiated thyroid cancer patients in Korea: a multicenter cohort study. Endocrinol Metab (Seoul) 2017;32:434–41.ArticlePubMedPMC
- 23. Grabellus F, Worm K, Schmid KW, Sheu SY. The BRAF V600E mutation in papillary thyroid carcinoma is associated with glucose transporter 1 overexpression. Thyroid 2012;22:377–82.ArticlePubMed
- 24. Miao P, Sheng S, Sun X, Liu J, Huang G. Lactate dehydrogenase A in cancer: a promising target for diagnosis and therapy. IUBMB Life 2013;65:904–10.ArticlePubMed
- 25. Kim BA, Jee HG, Yi JW, Kim SJ, Chai YJ, Choi JY, et al. Expression profiling of a human thyroid cell line stably expressing the BRAFV600E mutation. Cancer Genomics Proteomics 2017;14:53–67.ArticlePubMed
- 26. Feng C, Gao Y, Wang C, Yu X, Zhang W, Guan H, et al. Aberrant overexpression of pyruvate kinase M2 is associated with aggressive tumor features and the BRAF mutation in papillary thyroid cancer. J Clin Endocrinol Metab 2013;98:E1524–33.ArticlePubMed
- 27. Feine U, Lietzenmayer R, Hanke JP, Held J, Wohrle H, Muller-Schauenburg W. Fluorine-18-FDG and iodine-131-iodide uptake in thyroid cancer. J Nucl Med 1996;37:1468–72.PubMed
- 28. Guo J, Higashi K, Yokota H, Nagao Y, Ueda Y, Kodama Y, et al. In vitro proton magnetic resonance spectroscopic lactate and choline measurements, 18F-FDG uptake, and prognosis in patients with lung adenocarcinoma. J Nucl Med 2004;45:1334–9.PubMed
- 29. Barollo S, Pennelli G, Vianello F, Watutantrige Fernando S, Negro I, Merante Boschin I, et al. BRAF in primary and recurrent papillary thyroid cancers: the relationship with (131)I and 2-[(18)F]fluoro-2-deoxy-D-glucose uptake ability. Eur J Endocrinol 2010;163:659–63.ArticlePubMed
- 30. Liu R, Bishop J, Zhu G, Zhang T, Ladenson PW, Xing M. Mortality risk stratification by combining BRAF V600E and TERT promoter mutations in papillary thyroid cancer: genetic duet of BRAF and TERT promoter mutations in thyroid cancer mortality. JAMA Oncol 2017;3:202–8.ArticlePubMed
- 31. Xing M. Genetic-guided risk assessment and management of thyroid cancer. Endocrinol Metab Clin North Am 2019;48:109–24.ArticlePubMedPMC
References
Figure & Data
References
Citations
- Integrated proteogenomic and metabolomic characterization of papillary thyroid cancer with different recurrence risks
Ning Qu, Di Chen, Ben Ma, Lijun Zhang, Qiuping Wang, Yuting Wang, Hongping Wang, Zhaoxian Ni, Wen Wang, Tian Liao, Jun Xiang, Yulong Wang, Shi Jin, Dixin Xue, Weili Wu, Yu Wang, Qinghai Ji, Hui He, Hai-long Piao, Rongliang Shi
Nature Communications.2024;[Epub] CrossRef - Peripheral lymphocytes and lactate dehydrogenase correlate with response and survival in head and neck cancers treated with immune checkpoint inhibitors
Cassie Pan, Qian Vicky Wu, Jenna Voutsinas, Jeffrey J. Houlton, Brittany Barber, Zain H. Rizvi, Emily Marchiano, Neal Futran, George E. Laramore, Jay J. Liao, Upendra Parvathaneni, Renato G. Martins, Jonathan R. Fromm, Cristina P. Rodriguez
Cancer Medicine.2023; 12(8): 9384. CrossRef - LncRNA GLTC targets LDHA for succinylation and enzymatic activity to promote progression and radioiodine resistance in papillary thyroid cancer
Liang Shi, Rui Duan, Zhenhua Sun, Qiong Jia, Wenyu Wu, Feng Wang, Jianjun Liu, Hao Zhang, Xue Xue
Cell Death & Differentiation.2023; 30(6): 1517. CrossRef - Integrated analysis of circulating and tissue proteomes reveals that fibronectin 1 is a potential biomarker in papillary thyroid cancer
Guochao Ye, Xiaomei Zhang, Mansheng Li, Zixiang Lin, Yongcan Xu, Haoru Dong, Jie Zhou, Jiaqi Zhang, Sheng Wang, Yunping Zhu, Xiaobo Yu, Xu Qian
BMC Cancer.2023;[Epub] CrossRef - Targeting metabolism by B-raf inhibitors and diclofenac restrains the viability of BRAF-mutated thyroid carcinomas with Hif-1α-mediated glycolytic phenotype
Marianna Aprile, Simona Cataldi, Caterina Perfetto, Antonio Federico, Alfredo Ciccodicola, Valerio Costa
British Journal of Cancer.2023; 129(2): 249. CrossRef - circNFATC3 facilitated the progression of oral squamous cell carcinoma via the miR-520h/LDHA axis
Hongguo Xie, Xiaopeng Lu
Open Medicine.2023;[Epub] CrossRef - The potential role of reprogrammed glucose metabolism: an emerging actionable codependent target in thyroid cancer
Sai-li Duan, Min Wu, Zhe-Jia Zhang, Shi Chang
Journal of Translational Medicine.2023;[Epub] CrossRef - CENPE and LDHA were potential prognostic biomarkers of chromophobe renal cell carcinoma
Hui-feng Wu, Hao Liu, Zhe-wei Zhang, Ji-min Chen
European Journal of Medical Research.2023;[Epub] CrossRef - Classification for Staging and Managing Patients with Biopolymer-induced Human Adjuvant Disease
Jaime Eduardo Pachón Suárez, Marcela C. Salazar, Victor Z. Rizo
Plastic and Reconstructive Surgery - Global Open.2022; 10(2): e4137. CrossRef - Development of Metabolic Synthetic Lethality and Its Implications for Thyroid Cancer
Sang-Hyeon Ju, Seong Eun Lee, Yea Eun Kang, Minho Shong
Endocrinology and Metabolism.2022; 37(1): 53. CrossRef - Drug delivery for metabolism targeted cancer immunotherapy
Taravat Khodaei, Sahil Inamdar, Abhirami P. Suresh, Abhinav P. Acharya
Advanced Drug Delivery Reviews.2022; 184: 114242. CrossRef - Sulfur quantum dot based fluorescence assay for lactate dehydrogenase activity detection
Shengnan Fan, Xiaoqing Li, Fanghui Ma, Minghui Yang, Juan Su, Xiang Chen
Journal of Photochemistry and Photobiology A: Chemistry.2022; 430: 113989. CrossRef - STAT3/LINC00671 axis regulates papillary thyroid tumor growth and metastasis via LDHA-mediated glycolysis
Nan Huo, Rui Cong, Zhi-jia Sun, Wen-chao Li, Xiang Zhu, Chun-yuan Xue, Zhao Chen, Lu-yuan Ma, Zhong Chu, Yu-chen Han, Xiao-feng Kang, Song-hao Jia, Nan Du, Lei Kang, Xiao-jie Xu
Cell Death & Disease.2021;[Epub] CrossRef
 PubReader
 ePub Link
 Cite
Cite


