Characteristics Associated with Bone Loss after Spinal Cord Injury: Implications for Hip Region Vulnerability
Article information

Abstract
Background
In individuals with spinal cord injury (SCI), bone loss progresses rapidly to the area below the level of injury, leading to an increased risk of fracture. However, there are limited data regarding SCI-relevant characteristics for bone loss and the degree of bone loss in individuals with SCI compared with that in non-SCI community-dwelling adults.
Methods
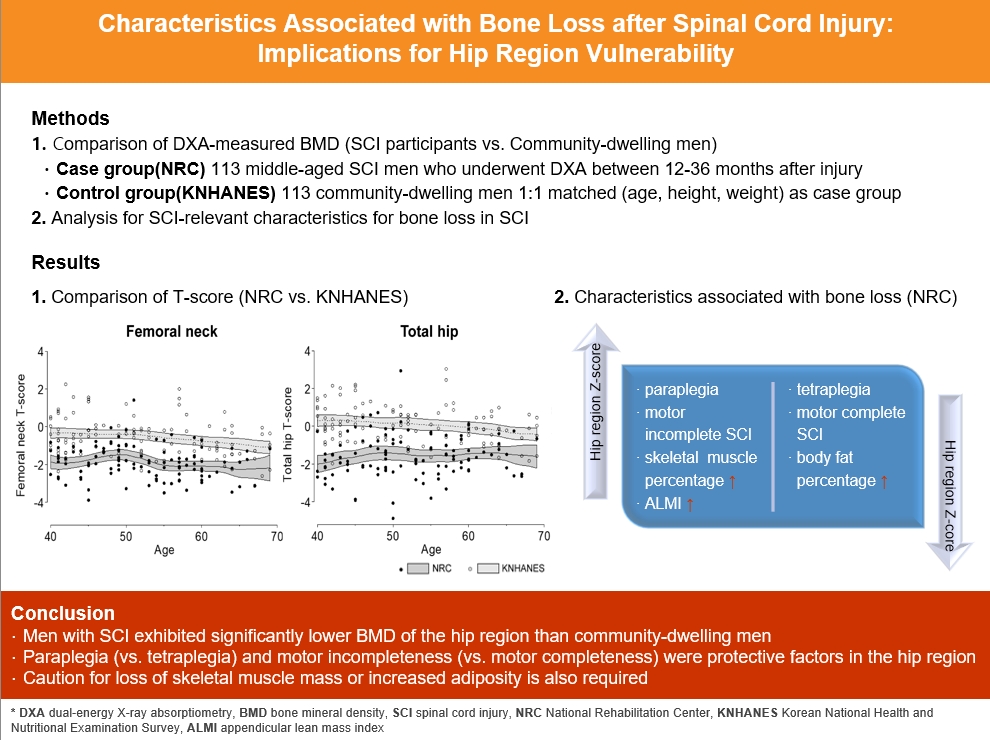
Data from men with SCI who underwent dual-energy X-ray absorptiometry at the National Rehabilitation Center (2008 to 2020) between 12 and 36 months after injury were collected and analyzed. Community-dwelling men were matched 1:1 for age, height, and weight as the control group, using data from the Korea National Health and Nutrition Examination Survey (KNHANES, 2008 to 2011).
Results
A comparison of the SCI and the matched control group revealed significantly lower hip region T-scores in the SCI group, whereas the lumbar spine T-score did not differ between groups. Among the 113 men with SCI, the paraplegia group exhibited significantly higher Z-scores of the hip region than the tetraplegia group. Participants with motor-incomplete SCI showed relatively preserved Z-scores of the hip region compared to those of the lumbar region. Moreover, in participants with SCI, the percentage of skeletal muscle displayed a moderate positive correlation with femoral neck Z-scores.
Conclusion
Men with SCI exhibited significantly lower bone mineral density of the hip region than community-dwelling men. Paraplegia rather than tetraplegia, and motor incompleteness rather than motor completeness were protective factors in the hip region. Caution for loss of skeletal muscle mass or increased adiposity is also required.
INTRODUCTION
Spinal cord injury (SCI) may cause motor or sensory somatic dysfunction, leading to immobility of the involved body part and decreased physical activity [1]. SCI alters bone metabolism homeostasis and increases bone resorption, leading to sublesional bone loss [2]. Bone loss in individuals with SCI is important because it increases the fracture risk of the lower limb, and lower limb fractures in SCI exhibit a significant correlation with lengthy hospitalization, various skin complications, nonunion, and increased premature mortality [3-5]. Hence, the extent of bone loss after SCI and SCI-relevant risk factors should be determined to facilitate appropriate interventional strategies to prevent osteoporotic fracture in this population.
Bone resorption in SCI progresses rapidly during the very early stages after SCI, with possibly up to 40% of bone loss occurring within 6 months post-injury; this rate of bone loss is significantly faster than that in non-SCI immobilized conditions [5,6]. Twelve months after the onset of SCI, bone loss tends to plateau, and decreased bone mineral density (BMD) on dual-energy X-ray absorptiometry (DXA) is prominent during this period [7]. Since DXA remains the gold standard tool for evaluating SCI-related bone loss, the stabilized bone loss levels can presumably be evaluated using DXA that is performed at ≥1 year after injury.
Previous studies have examined serial changes in the BMD of individuals with SCI, but they were confined to a small number of study subjects [8,9] or lacked focus on SCI-relevant characteristics such as the level or completeness of injury [10,11]. Few studies have analyzed clinical risk factors for bone loss in individuals with SCI compared with those in the general population [12,13], and some of the factors studied yielded mixed results in different reports [14]. Therefore, we aimed to explore the SCI-relevant risk factors for reduced bone mass and to compare DXA-measured BMD between middle-aged men with SCI and matched community-dwelling men.
METHODS
Ethics statements
Ethics approval was obtained from the National Rehabilitation Center (NRC) Institutional Review Board (IRB no. NRC-2021-01-011). Informed consent was obtained from all participants involved in the study.
Study populations
Case group: NRC cohort
This study included men diagnosed with SCI who were hospitalized in a rehabilitation program at the NRC from 2008 to 2020. The participants were adult men aged 40 to 69 years who underwent DXA between 12 and 36 months after developing SCI. Among the initial 125 participants, those without data on femoral neck BMD or artifacts/outliers (n=5) and those lacking lumbar spine BMD data (n=7) were excluded. A total of 113 men with SCI were included in the NRC cohort (Fig. 1), and further analyses were conducted to examine SCI-relevant characteristics in these participants.

Study flow chart. SCI, spinal cord injury; KNHANES, Korea National Health and Nutritional Examination Survey; DXA, dual-energy X-ray absorptiometry.
Control group: Korea National Health and Nutritional Examination Survey
Data of community-dwelling men without SCI were collected from Korea National Health and Nutrition Examination Survey (KNHANES). The KNHANES is a nationwide, population-based, cross-sectional survey and health examination conducted by the Korea Centers for Disease Control and Prevention [15]. KNHANES surveys are conducted annually using a rolling sampling design that involves a complex, stratified, multistage, probability cluster survey of the general population of Korea.
Overall, 6,631 community-dwelling men aged 40 to 69 years participated in the fifth KNHANES 2008 to 2011 survey. We excluded men without DXA scan data (n=2,318) and those whose height or weight was missing (n=9). In total, 4,304 men were included in the analysis and matched 1:1 with the NRC cohort using propensity score matching based on age, weight, and height. Finally, the data from 226 men (NRC cohort, n=113; KNHANES cohort, n=113) were analyzed (Fig. 1).
Measurements of BMD
NRC cohort
All BMD measurements of the lumbar spine, femoral neck, and total hip were performed at the NRC. However, the DXA machine was changed during the study period (from January 1, 2008 to January 20, 2019, GE Lunar, Madison, WI, USA; from January 21, 2019 to December 31, 2020, Hologic Inc., Bedford, MA, USA). Because there are known systemic differences in BMD values among various manufacturers, we used standardization formulas to convert BMD values from the GE Lunar to Hologic Inc. machine. The conversion equations are as follows: lumbar spine: Hologic Inc. BMD=0.918×GE Lunar BMD–0.038; femoral neck: Hologic Inc. BMD=0.8638×GE Lunar BMD–0.039; and total hip: Hologic Inc. BMD=0.971×GE Lunar BMD–0.037 [16]. The coefficients of variation for the lumbar spine, total hip, and femoral neck were all less than 1.5% respectively with Hologic Inc. machine. The BMD score for the hip region was taken as the lower of the two scores of the femoral neck and the total hip.
KNHANES cohort
In the KNHANES cohort, the bone mineral content and BMD at the lumbar spine, femoral neck, and total hip were measured by trained technicians using DXA (DISCOVERY-W fan-beam densitometer, Hologic Inc.). The coefficients of variation for the measurements of the lumbar spine, total hip, and femoral neck were 1.9%, 1.8%, and 1.5%, respectively. In both cohorts, the T-score was calculated based on the third National Health and Nutrition Examination Survey using data from young Caucasian women as a reference [17]. The primary outcome of this study was the difference in the femoral neck BMD between the NRC and KNHANES cohorts.
Covariates
NRC cohort
Covariates of the NRC cohort were obtained from medical records and included age, height, weight, and medical history (history of hypertension, type 2 diabetes mellitus [DM], and dyslipidemia). Hypertension was defined as systolic blood pressure ≥140 mm Hg, diastolic blood pressure ≥90 mm Hg, or the use of antihypertensive medications. DM was considered as fasting glucose level ≥126 mg/dL or if the participant was taking oral hypoglycemic agents or insulin. Smoking status was categorized as current smoker or nonsmoker. Heavy drinkers were defined as those drinking three or more units of alcohol per day. SCI-relevant characteristics were as follows: duration since injury, cause of injury (traumatic or non-traumatic), American Spinal Injury Association Impairment Scale (AIS) (AIS-A, B classified as motor-complete injury and AIS-C, D classified as motor-incomplete injury) [18], and neurological level of injury (cervical level was classified as tetraplegia and thoracolumbar level as paraplegia). The lower extremity motor score was calculated as the sum of manual muscle testing scores of both lower extremities from L2 to S1. To quantify the mobility of individuals with SCI, we calculated the sum of each item in the indoor and outdoor mobility scores of the Korean Spinal Cord Independence Measure III [19]. Lower extremity spasticity in both hip flexors and extensors, knee flexors and extensors, ankle dorsiflexors, and plantar flexors was measured using the modified Ashworth scale (MAS) [20]. To calculate the sum of all six sites measured in this study, MAS 0 was scored as 0, MAS 1 as 1, MAS 1+ as 2, MAS 2 as 3, MAS 3 as 4, and MAS 4 as 5. Skeletal muscle and body fat percentage were estimated in a subset of participants using bioelectrical impedance analysis (BIA) with an eight-point tactile electrode multifrequency BIA device (Inbody S10, Biospace, Seoul, Korea) according to the manufacturer’s instructions. During the test, clip-shaped electrodes were placed on the thumb and third finger of both hands and on both ankles, with the participant in the supine position. Body fat percentage or skeletal muscle percentage was calculated by dividing the amount of body fat or skeletal muscle mass by the total body weight. Appendicular lean mass index (ALMI) was calculated by dividing the appendicular skeletal muscle mass by the square of height (kg/m2).
KNHANES cohort
Covariates of the KNHANES, including anthropometric factors, medical history, smoking, and alcohol use histories were collected using standardized health questionnaires [21]. Smoking status was categorized as current smoker or nonsmoker. Heavy drinkers were defined as those drinking ≥3 drinks per day. Hypertension was defined as systolic blood pressure ≥140 mm Hg, diastolic blood pressure ≥90 mm Hg, or the use of antihypertensive medications. DM was considered as fasting glucose level ≥126 mg/dL or if the participant was taking oral hypoglycemic agents or insulin.
Statistical analysis
Data are presented as the mean±standard deviation or median (interquartile range) for continuous variables and as numerical values (%) for categorical variables. The independent two-sample t test, Wilcoxon rank-sum test, and chi-square test were used to compare the baseline characteristics of the study populations as appropriate.
We performed propensity score matching between the NRC and KNHANES cohorts using the nearest-neighbor algorithm within a specified caliper width (0.2 of the standard deviation of the logit of the propensity score) on a 1:1 basis, without replacement. The propensity score was calculated based on age, weight, and height. Covariate balance was assessed using a standardized bias with a threshold of 20%. Differences in the BMD between the NRC and KNHANES cohorts were compared using the independent two-sample t test and nonlinear modeling with a local polynomial curve. The independent effect of SCI on BMD changes was estimated using multivariable linear regression analysis. The independent t test was used to analyze differences in the Z-scores at each site based on the level of injury in the NRC cohort. The paired t test was performed to compare the Z-scores between motor-complete and motor-incomplete injury groups, and to analyze the site-related BMD differences within each group. In participants with SCI for whom BIA results were available, partial correlation analysis was adopted to evaluate the correlation between body composition and BMD.
Statistical analyses were performed using STATA version 14.1 (Stata Corp., College Station, TX, USA). Statistical significance was set at P<0.05.
RESULTS
General characteristics of the NRC cohort and differences from the KNHANES cohort
The baseline characteristics of the NRC and KNHANES cohorts are presented in Table 1, Supplemental Table S1. The mean age (52.1±8.3 years), and mean body mass index (BMI; 22.9±2.7 kg/m2) did not differ between the two cohorts. The femoral neck and total hip T-scores exhibited significant between-group differences (–1.9±0.9 vs. –0.6±1.0, P<0.001; and –1.6±1.1 vs. 0.1±1.0, P<0.001, respectively). However, the lumbar spine T-scores did not show a significant difference (–1.1±1.0 vs. –0.8±1.3, P=0.105) (Table 1). A local polynomial smooth curve was created to illustrate the difference between the two cohorts (Fig. 2).
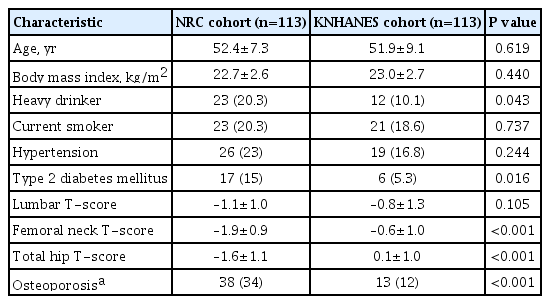
General Characteristics of Men with Spinal Cord Injury and Community-Dwelling Matched Controls
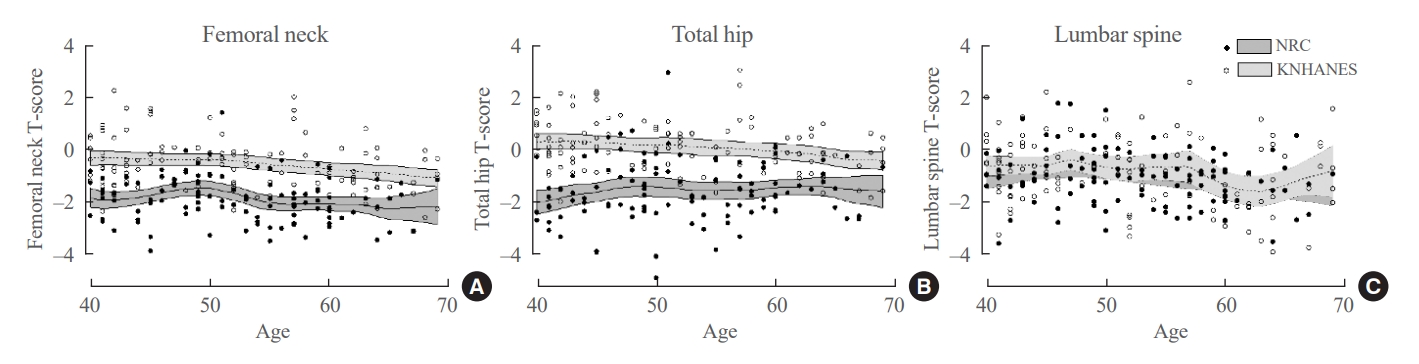
Polynomial curve showing differences in (A) femoral neck, (B) total hip, and (C) lumbar spine T-scores between the two cohorts. NRC, National Rehabilitation Center; KNHANES, Korea National Health and Nutritional Examination Survey.
BMD difference between men with SCI and the age-matched general population
Multivariable linear regression analysis was conducted to evaluate factors that affect BMD in the two groups. The femoral neck T-score was significantly lower in the NRC cohort than in the KNHANES cohort (adjusted β, –1.27; 95% confidence interval [CI], –1.50 to –1.02; P<0.001), even after adjusting for age, BMI, alcohol intake, smoking status, hypertension, and type 2 DM (Table 2). Older age (adjusted β, −0.02 per 1 year older; P=0.007) and lower BMI (adjusted β, −0.06, per 1 kg/m2 decrease; P=0.016) were independent predictors of bone loss in both cohorts. The total hip T-score was also significantly lower in the NRC cohort than in the KNHANES cohort (adjusted β, −1.58; 95% CI, −1.87 to −1.31; P<0.001) (Supplemental Table S2), but there was no significant between-group difference in the lumbar spine T-scores (adjusted β, −0.18 vs. KNHANES; 95% CI, −0.48 to 0.12) (data not shown).
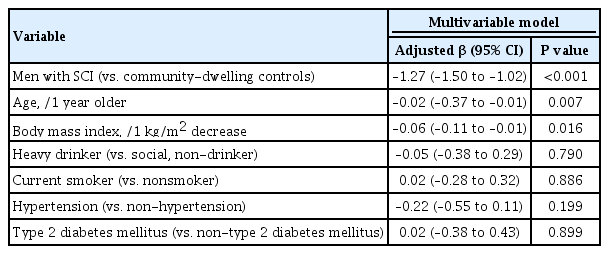
Effects of Spinal Cord Injury on Femoral Neck T-Score
Associations of SCI-relevant characteristics with BMD among men with SCI
Within the NRC cohort, additional analysis was conducted based on Z-scores to eliminate the influence of age. Regarding motor completeness (n=109), there was no statistically significant difference in Z-scores for the lumbar, femoral neck, and total hip between the motor-complete (n=58) and motor-incomplete (n=51) injury groups (P>0.05) (data not shown). A site-specific comparison of the Z-scores within the motor-complete injury group, showed no statistically significant differences for the femoral neck (−0.7±0.7) and total hip (−0.7±1.0) compared to the lumbar region (−0.5±0.9) (P=0.328 and P=0.329, respectively). In contrast, within the motor-incomplete injury group, significantly higher BMD was observed for both the femoral neck (−0.5±0.8) and total hip (−0.3±1.1) than for the lumbar region (−0.8±1.1) (P=0.045 and P=0.028, respectively) (Fig. 3). Regarding the level of injury (n=111), a comparison of the average Z-scores by sites between the tetraplegia group (n=78) and the paraplegia group (n=33) (Table 3), revealed statistically significant differences in the femoral neck (−0.7±0.8 vs. −0.3±0.8, P=0.009) and the hip region (−1.0±0.8 vs. −0.5±1.0, P=0.010). No significant difference was observed for the lumbar region (P=0.369). In this study, there were no statistically significant differences in BMD regarding the duration since injury and the cause of injury (P>0.05) (data not shown).
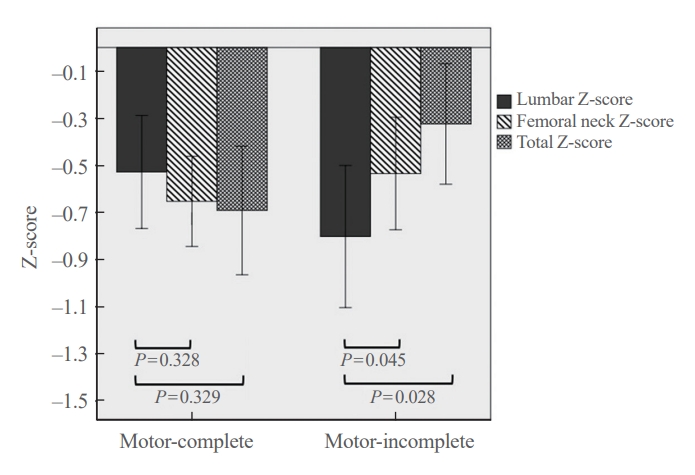
Comparison of site-specific Z-scores (lumbar, femoral neck, and total hip) in the National Rehabilitation Center cohort between motor-complete and motor-incomplete injury groups.
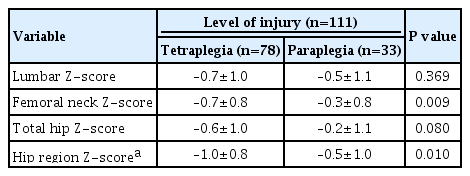
Comparison of Z-Score by Site between Tetraplegia and Paraplegia in Men with Spinal Cord Injury
Correlation of the body composition with BMD among men with SCI
Partial correlation analysis for the correlation between the body composition and Z-scores by sites was performed for 32 participants with available BIA data (Table 4). The skeletal muscle percentage exhibited a strong positive correlation with the Z-score of the femoral neck (r=0.53, P=0.002) (Fig. 4), and also showed a moderate positive correlation with that of the hip region (r=0.48, P=0.006). ALMI also exhibited moderate positive correlations with the Z-score of the femoral neck (r=0.41, P=0.023) and the hip region (r=0.37, P=0.042). The body fat percentage exhibited a moderate negative correlation with the Z-score of the femoral neck (r=−0.54, P=0.001) and with that of the hip region (r=0.50, P=0.005).
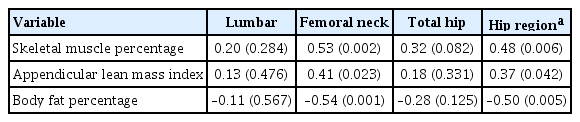
Partial Correlation Analysis of Body Composition and Z-Scores in Men with Spinal Cord Injury (n=32)
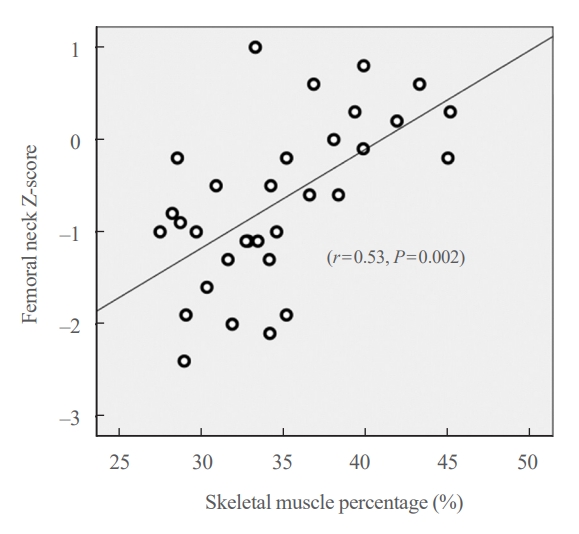
Partial correlation analysis showing moderate positive correlation between skeletal muscle percentage (%) and femoral neck Z-score in participants with available bioelectrical impedance analysis data in the National Rehabilitation Center cohort.
DISCUSSION
This study analyzed the degree of bone loss and the relevant risk factors associated with bone loss after SCI using BMD in middle-aged men with SCI compared to those if community-dwelling male adults without SCI. Overall, femoral neck and total hip T-scores in the SCI group were more than −1.3 lower than those in the general population group. Among SCI-relevant characteristics, motor-incomplete injury and paraplegia were relative protective factors against loss of bone mass in the hip region. The skeletal muscle percentage and ALMI showed a moderate positive correlation with the femoral neck and hip region BMD.
The overall femoral neck and total hip T-scores in men with SCI were −1.3 and −1.7 lower, respectively, compared with those in community-dwelling adults. Since every 1.0 reduction of the T-score reflects a 1.6 to 1.7-fold increase in fragility fracture risk of the vertebrae and upper and lower limbs [22], the men with SCI in their first to third year of injury should be regarded as a high fracture risk group; therefore, special attention regarding this heightened risk to facilitate earlier intervention and management to prevent fragility fracture is required. Vestergaard et al. [23] previously demonstrated that the crude fracture rate of patients with SCI was 2% per year, which was two times higher than that of controls, with a considerably higher rate of low-energy fractures. In another study of men with paraplegic SCI, Zehnder et al. [24] reported that the overall incidence of fragility fracture of the lower limb was 1% during the first year after injury, and the mean annual incidence of fracture increased significantly with time. However, the lumbar spine T-score did not exhibit any significant between-group difference in our study. This site-related bone loss discrepancy in men with SCI is consistent with the outcomes of earlier studies, in which the BMD of the lumbar spine was relatively preserved compared to that of the hip or femur [25,26]. The continuous weight-supporting function of the vertebrae is believed to partially contribute to this phenomenon, together with the effect of degenerative changes [27]. Because of these regional differences in the severity of bone loss, first-line preventive pharmacologic agents for individuals with SCI should consider primarily targeting lower limb fracture. Based on current evidence, various bisphosphonates, including oral etidronate and intravenous zoledronate, have shown efficacy in slowing the decline in BMD of the hip and knee regions [28-31]. Nevertheless, there are currently no definite pharmacologic guidelines to reduce the actual fracture risk in SCI [32,33]. Future research should propose evidence-based preventative measures with the fracture itself as an endpoint.
In the analysis of SCI-relevant characteristics, the Z-scores of the femoral neck and total hip were significantly higher than those of the lumbar among the motor-incomplete injury participants. Conversely in the motor-complete injury group, the Z-score of the overall hip region was lower than that of the lumbar region, but the difference was not significant. Consistent with our findings, several previous investigations reported that motor-complete SCI was associated with severe bone loss especially in the hip region [8,34]. Our findings implicitly suggest that men with SCI with residual muscle strength, namely those with motor-incomplete injury, are less susceptible to the loss of hip bone density. This may be attributed to the motor-incomplete injury group having a higher level of mobility in the lower limbs and participation in weight-bearing activities compared to those with motor-complete SCI [35]. Furthermore, in the current study tetraplegic participants exhibited lower hip region BMD compared to those with paraplegia. These findings for tetraplegic individuals may also result from relative deprivation of lower extremity mechanical loading, such as difficulty in standing up or ambulating, which necessarily requires assistive support using the upper extremities.
In the current study we found a positive correlation between skeletal muscle percentage and ALMI, and hip region BMD, as well as a negative correlation between body fat percentage and hip region BMD. These findings prompt the consideration of the impact of body composition on bone density in the SCI population. Some previous studies reported the tendency of increasing body fat composition in individuals with SCI, and Pelletier et al. [36] recently showed that 57% of individuals with SCI were sarcopenic [36-38]. Our findings suggest that insufficient skeletal muscle content or increased adiposity is one of the contributing factors of osteoporotic fractures in SCI population, which merits further validation. Further, to decrease adiposity or improve skeletal muscle composition in the SCI population, a few pilot studies advocated the combination of routine exercise training and dietary modification [39,40].
The present study has several limitations. First, the DXA equipment for measuring BMD was changed from the GE Lunar machine to the Hologic Inc. machine during the study period, and the precise percentages of the coefficient of variation in the NRC cohort were unobtainable. However, to minimize inter-device error, we converted all BMD values measured using the GE Lunar machine into Hologic Inc. values with a standardization equation formula. Second, the study population only included men with SCI; hence, precluding the generalizability of our findings to women. Nevertheless, the incidence of SCI is several times higher in men than in women [41], and excluding women when interpreting bone loss enabled us to exclude menopausal effects of female sex hormones. In addition, data on medication intake were unobtainable, including the use of anti-osteoporotic drugs. Finally, according to the International Society for Clinical Densitometry, the recommended measurement sites for BMD in SCI population are the total hip, distal femur, and proximal tibia [42], but the BMD values in the current study were only available for the total hip and femoral neck. This study showed significant BMD loss at the overall hip region in the SCI group, which merits further contextual investigation regarding the other recommended measurement sites. Moreover, as the International Society for Clinical Densitometry (ISCD) guidelines prefer the application of separate scoring categories, either T-score or Z-score based on the age of 50 for BMD interpretation in men, subsequent analysis with the segmented age groups could be warranted if technically feasible.
In conclusion, middle-aged men with SCI had significantly lower femoral neck and total hip BMD than community-dwelling men, independent of age, BMI, and other covariates in our study. Additionally, since several SCI-relevant characteristics and inappropriate body composition were possibly associated with higher bone loss in the hip region, prompt screening tests and proactive interventional strategies to prevent early fragility fractures should be emphasized in vulnerable individuals with SCI.
Supplementary Material
Supplemental Table S1.
Spinal Cord Injury-Specific Factors that Affect Sensory and Motor Injuries and Muscle Function
Supplemental Table S2.
Effects of Spinal Cord Injury on Total Hip T-Score
Notes
CONFLICTS OF INTEREST
No potential conflict of interest relevant to this article was reported.
AUTHOR CONTRIBUTIONS
Conception or design: S.H., S.S., O.K., N.H. Acquisition, analysis, or interpretation of data: S.H., S.S., O.K., N.H. Drafting the work or revising: S.H., S.S., O.K., N.H. Final approval of the manuscript: S.H., S.S., O.K., N.H.
Acknowledgements
This study was funded by a grant (NRCRSP-21TB03, NRCRSP-22TB04) by the Korea National Rehabilitation Center.