Association between N-Terminal Prohormone Brain Natriuretic Peptide and Decreased Skeletal Muscle Mass in a Healthy Adult Population: A Cross-Sectional Study
Article information

Abstract
Background
Although an inverse association between the N-terminal prohormone brain natriuretic peptide (NT-proBNP) and obesity exists, only few major studies have assessed the association between NT-proBNP levels and skeletal muscle mass in asymptomatic healthy adults. Therefore, this cross-sectional study was conducted.
Methods
We assessed participants who underwent health examinations at Kangbuk Samsung Hospital in South Korea from January 2012 to December 2019. Appendicular skeletal muscle mass was measured using a bioelectrical impedance analyzer, and the skeletal muscle mass index (SMI) was calculated. Participants were divided into the control, mildly low skeletal muscle mass (LMM) (−2 standard deviation [SD] < SMI ≤−1 [SD]), and severely LMM groups (SD ≤−2) based on their SMI. The association between elevated NT-proBNP level (≥125 pg/mL) and skeletal muscle mass was assessed using multivariable logistic regression analysis with adjustment for confounding factors.
Results
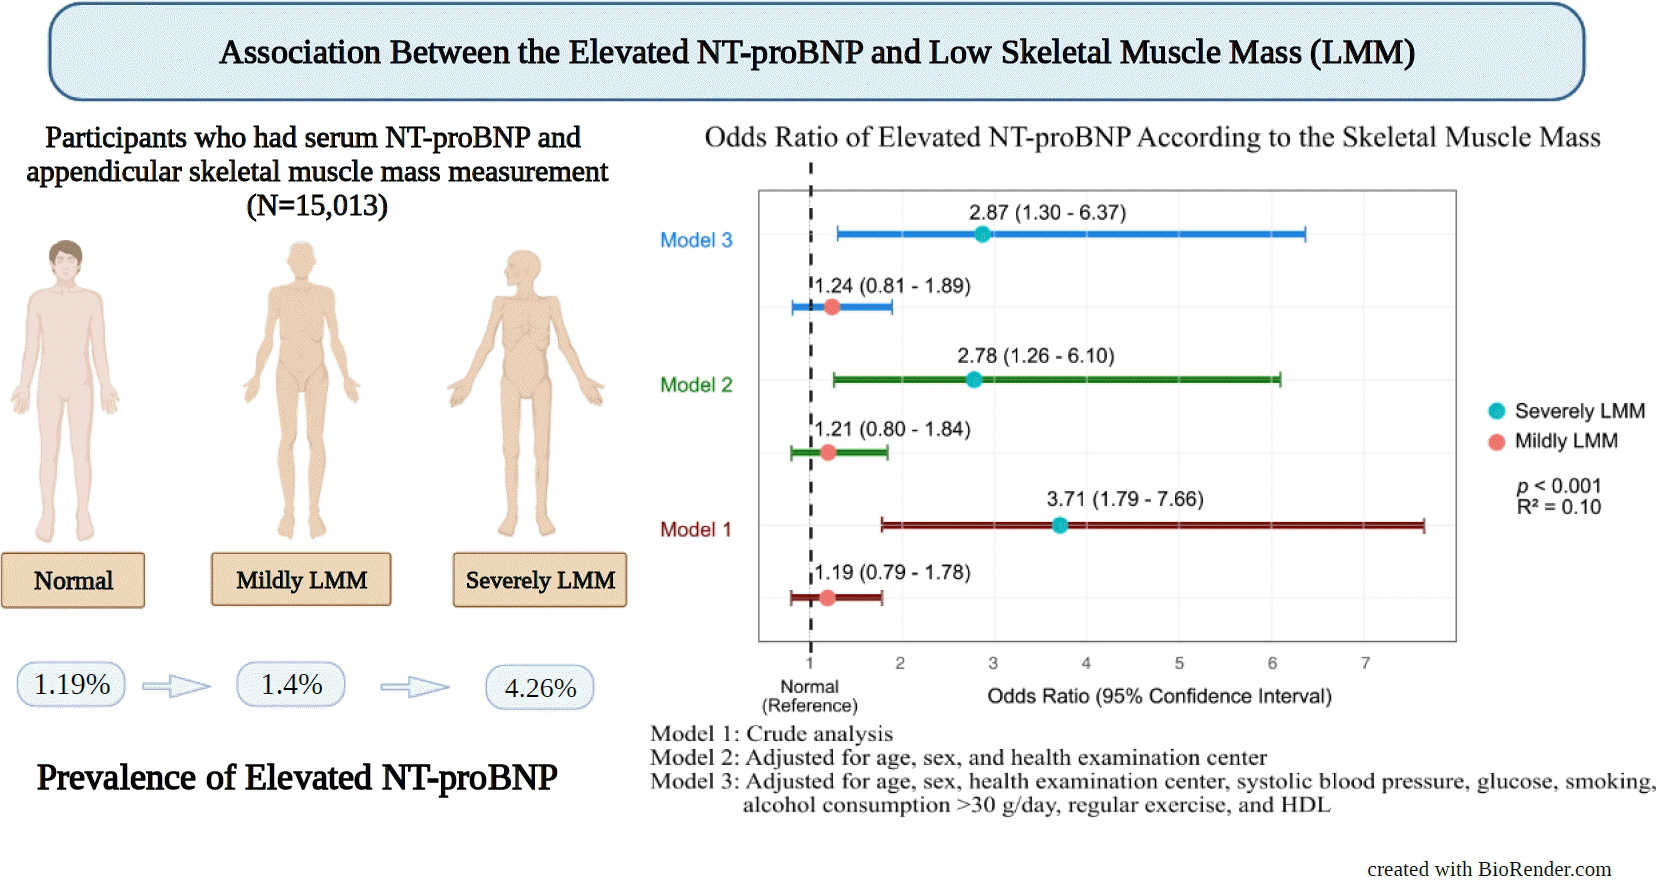
This study enrolled 15,013 participants (mean age, 37.52±9.52; men, 54.24%; control, n=12,827; mildly LMM, n=1,998; severely LMM, n=188). Prevalence of elevated NT-proBNP was higher in mildly and severely LMM groups than in the control group (control, 1.19%; mildly LMM, 1.4%; severely LMM, 4.26%; P=0.001). The adjusted odds ratio (OR) of elevated NT-proBNP was significantly higher in severely LMM (OR, 2.87; 95% confidence interval [CI], 1.3 to 6.37) than in control (OR, 1.00; reference) or mildly LMM groups (OR, 1.24; 95% CI, 0.81 to 1.89).
Conclusion
Our results showed that NT-proBNP elevation were more prevalent in participants with LMM. In addition, our study showed an association between skeletal muscle mass and NT-proBNP level in a relatively young and healthy adult population.
INTRODUCTION
Loss of muscle mass has been demonstrated to be a significant public health issue, with an estimated 10% prevalence of individuals (both sexes) with decreased skeletal muscle mass worldwide [1]. Decrease in the skeletal muscle mass is generally associated with the aging process, and this age-related decline in skeletal muscle mass may begin as early as >30 years of age [2]. In addition, owing to decreased physical activity in the middle-aged adult population, decreased skeletal muscle mass has become an increasingly important issue in the relatively young adult population [3].
N-terminal prohormone brain natriuretic peptide (NT-proBNP) is widely used in clinical settings, is associated with increased severity and acuity of heart failure (HF) [4], and is elevated in populations with impaired renal function [5,6].
NT-proBNP is also decreased among obese individuals, particularly men [7]. Nevertheless, despite the close relationship between skeletal muscle mass and obesity, both of which contribute to the nexus of body composition, the body of literature examining the association between NT-proBNP and skeletal muscle mass is limited. Most of the previous studies that assessed the association between low skeletal muscle mass (LMM) and NT-proBNP focused on a specific population, namely, HF or hemodialysis population, and only a few studies evaluated the association in young and healthy adult populations [8,9].
To fill this gap in clinical science, we conducted a cross-sectional study to characterize the association between decreased skeletal muscle mass and NT-proBNP levels in an asymptomatic healthy adult population.
METHODS
Kangbuk Samsung Health Study and study period
Details of the cohort explanation and measurement methods have been provided in the previous studies by our team [10,11]. In brief, this was a population-based cross-sectional study based on the Kangbuk Samsung Health Study, which is a cohort study that includes individuals who participated in an annual or biennial health checkup program in South Korea.
The data were collected from January 3, 2012 to December 31, 2019. This study initially enrolled 15,704 individuals with skeletal muscle mass index (SMI) and plasma NT-proBNP level measurements. The following participants were excluded: history of heart disease (angina, myocardial infarction, atrial fibrillation, heart valve diseases, HF, hypertrophic myocardial disease, debrillators, or an artificial heart machine, n=114), chronic kidney disease (CKD) (n=34), malignancy (n=424), chronic obstructive lung disease (n=117), stroke (n=76), and under medication for heart diseases (n=63) and stroke (n=28). Hence, after exclusion, of the 15,704 participants, 15,013 were included in the study (Fig. 1).
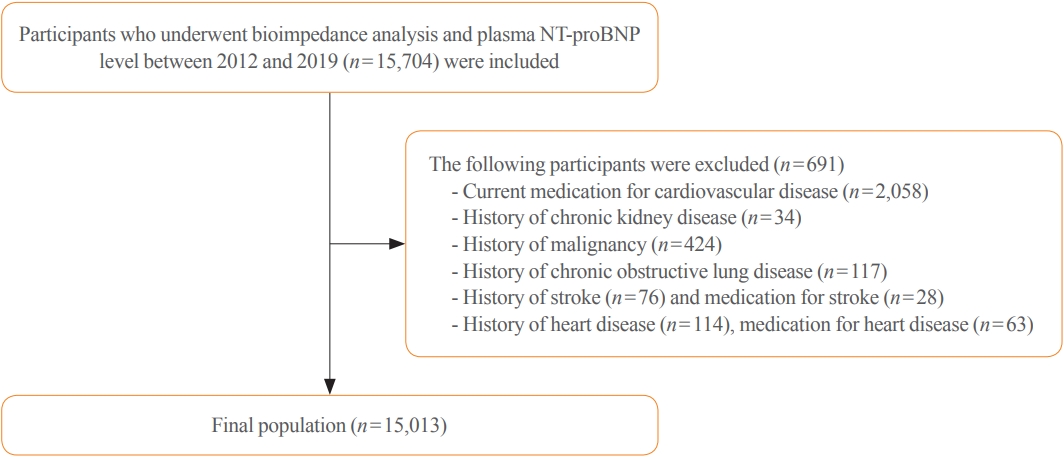
Flow diagram of study participants. NT-proBNP, N-terminal prohormone brain natriuretic peptide.
Anthropometric data, demographic information, and medical history of the participants were collected. Blood samples were collected and analyzed for NT-ProBNP levels and laboratory data. The appendicular skeletal muscle mass (kg) was measured using a bioelectrical impedance analyzer (BIA). The SMI was calculated by dividing appendicular skeletal muscle mass by the square of the height (kg/m2) [10]. Participants were considered to be engaged in regular exercise if they participated in >150 minutes of moderate-intensity exercise in a week [12].
The study protocol was approved by the Institutional Review Board (IRB) of Kangbuk Samsung Hospital (IRB no. KBSMC 2022-08-075). The requirement for informed consent was waived by the IRB of Kangbuk Samsung Hospital because we used unidentifiable datasets that were collected as part of the routine health checkup. Our study was done in accordance with the Ethical Principles for Medical Research Involving Human Subjects outlined in the Declaration of Helsinki in 1975.
Definition of LMM and elevated NT-proBNP
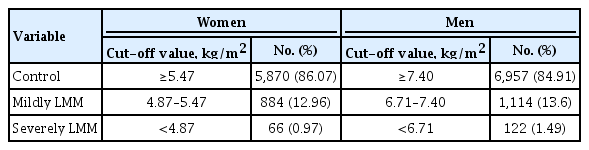
Participants were classified by the LMM category using the following criteria: control (SMI >–1 standard deviation [SD]), mildly LMM (–2 SD < SMI ≤–1 SD), and severely LMM (SMI ≤–2 SD) [13]. During the study period, the cut-off values for mildly LMM in men and women were 7.40 and 5.47 kg/m2 and that for severely LMM were 6.71 and 4.87 kg/m2, respectively (Table 1). NT-proBNP level of >125 pg/mL was defined as an elevated status [14].
Skeletal Muscle Index Cut-off Value
Data availability
The datasets used in the current study cannot be made publicly available to protect patient information. However, the corresponding author can provide a dataset upon reasonable request.
Statistical analyses
Participants were categorized into three groups according to their muscle mass and were used as categorical variables in the analysis. NT-proBNP status was considered a binary variable (normal or elevated) based on the abovementioned cut-off value. Chi-square test and one-way analysis of variance were used to compare the means of variables between groups. Post hoc Bonferroni analyses were performed to compare groups. Multivariable logistic regression analysis was conducted to assess the cross-sectional association between the LMM groups and NT-proBNP levels. We used three models with adjusted confounding factors: model 1, crude analysis; model 2, adjusted for age, sex, and health examination center; and model 3, adjusted for age, sex, health examination center, systolic blood pressure, serum glucose level, smoking, heavy alcohol consumption (alcohol >30 g), regular exercise, and high-density lipoprotein. Odds ratios (OR) with 95% confidence intervals (CI) were calculated.
In addition, we assessed the association between NT-proBNP and LMM, with NT-proBNP as a continuous variable. NT-proBNP values were log-transformed owing to its skewed distribution. Analysis of covariance was used to compare adjusted means of log-transformed NT-proBNP values of each group after adjusting for confounding factors in model 3. IBM SPSS version 26.0 (IBM Co., Armonk, NY, USA) was used for all statistical analyses, and a two-tailed P value of <0.05 was considered statistically significant.
RESULTS
Baseline demographic characteristics
Table 2 shows the baseline characteristics of the participants in the control and LMM groups. The control, mildly LMM, and severely LMM groups comprised 85.44% (n=12,827), 13.31% (n=1,998), and 1.25% (n=188) of the study population, respectively. The mean age of the participants in the control, mildly LMM, and severely LMM groups was 37.52±9.52 (>18 years old), 36.89±10.85, and 40.74±14.55, respectively. The control, mildly LMM, and severely LMM groups comprised 54.24% (n=6,957), 55.76% (n=1,114), and 64.89% (n=112) (P=0.007) men, respectively. The SMI of the participants in the control, mildly LMM, and severely LMM groups was 7.31±1.13, 6.32±0.95, and 5.87±0.87 kg/m2 (P<0.001), respectively. The appendicular skeletal muscle mass of the participants in the control, mildly LMM, and severely LMM groups was 21.09± 5.04, 17.52±4.06, and 15.75±3.57 kg (P<0.001), respectively. The percentage of the participants with regular exercise (>3 times/week) in the control, mildly LMM, and severely LMM groups was 14.1 (n=1,809), 8.06 (n=161), and 3.19 (n=6) (P<0.001), respectively.

Baseline Characteristics of Study Participants
Prevalence of elevated NT-proBNP in control, mildly LMM, and severely LMM groups
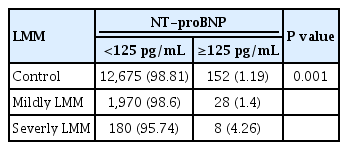
The prevalence of elevated NT-proBNP was 1.19% in control, 1.4% in mildly LMM, and 4.26% in severely LMM groups. The prevalence of normal NT-proBNP levels among the control, mildly LMM, and severely LMM groups was 98.81%, 98.6%, and 95.74%, respectively (P<0.001) (Table 3).
Prevalence of Elevated NT-ProBNP according to the Skeletal Muscle Level
Comparison of natural log transformed NT-proBNP level values between each group
Fig. 2 shows the association between log-transformed NT-proBNP levels (as a continuous variable) and the LMM groups. Log transformed adjusted mean of proBNP level was 3.04 (standard estimate, 0.004) in the control, 3.10 (standard estimate, 0.009) in mildly LMM, and 3.22 (standard estimate, 0.031) in severely LMM groups. There were significant differences in the comparisons between all the group (all post hoc Bonferroni, P<0.001).
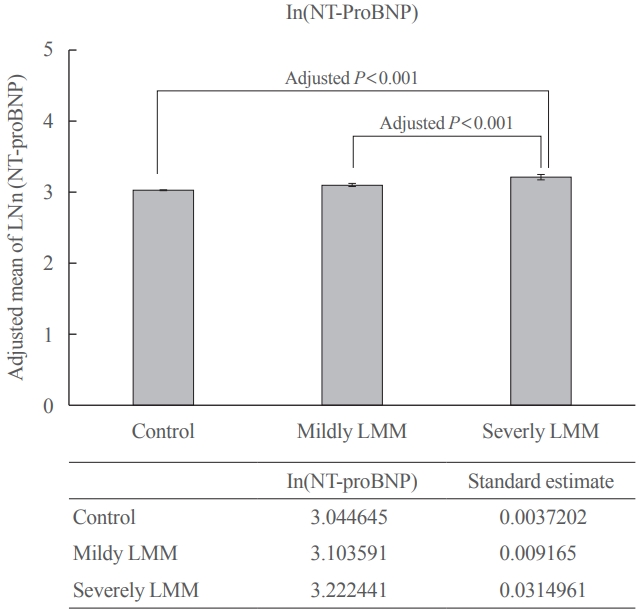
Comparison of adjusted mean of ln(N-terminal prohormone brain natriuretic peptide [NT-proBNP]) between normal, mildly low skeletal muscle mass (LMM), and severely LMM groups. Comparison of adjusted mean±standard error of natural-log transformed NT-proBNP levels in the groups was estimated using analysis of covariance (ANCOVA) after adjusting for the following confounding factors: age, sex, health examination center, systolic blood pressure, glucose, smoking, heavy alcohol consumption (>30 g/day), regular exercise, and high-density lipoprotein cholesterol level. Group difference was assessed by Bonferroni post hoc P<0.001.
Association between LMM and elevated NT-proBNP
Table 4 shows the association between LMM groups and NT-proBNP levels. In crude model, mild LMM group was not associated with elevated NT-proBNP levels; however, severe LMM group was significantly associated with elevated NT-proBNP levels (model 1, control, reference; mildly LMM [OR, 1.19; 95% CI, 0.79 to 1.78]; severely LMM [OR, 3.71; 95% CI, 1.79 to 7.66]). After the adjustment for age, sex, and health examination center, mildly LMM group was not associated with elevated proBNP levels, but severely LMM group was significantly associated with elevated NT-proBNP levels (model 2, mildly LMM [OR, 1.21; 95% CI, 0.80 to 1.84]; severely LMM [OR, 2.78; 95% CI, 1.26 to 6.10]). The trend was the same after full adjustment. Mildly LMM group was not associated with elevated NT-proBNP levels, but severely LMM group was significantly associated with elevated NT-proBNP levels (model 3, mildly LMM [OR, 1.24; 95% CI, 0.81 to 1.89]; severe LMM [OR, 2.87; 95% CI, 1.30 to 6.37]).

Odds Ratio of Elevated NT-ProBNP according to the Skeletal Muscle Mass
DISCUSSION
To the best of our knowledge, this is one of the few major studies to assess the relationship between LMM and elevated NT-proBNP levels in an asymptomatic population using BIA to assess skeletal muscle mass. Our study showed that elevated NT-proBNP levels were more prevalent in the LMM groups than in the control group. In addition, severely LMM group was significantly associated with elevated NT-proBNP levels. This association was significant, even after adjusting for multiple confounding factors. This finding indicates that skeletal muscle mass can affect NT-proBNP levels.
NT-proBNP is a useful biomarker for the diagnosis and assessment prognosis of patients with HF [15]. NT-proBNP is inversely associated with body composition such as visceral fat, body mass index, and waist circumference [16]. Patients with chronic HF and cachexia tend to have higher NT-proBNP levels than those without cachexia [8]. Selvaraj et al. [17] showed that axial muscle mass had a strong inverse relationship with NT-proBNP levels in patients with HF. However, their study had several limitations because they used axial muscle mass instead of appendicular muscle mass, even though appendicular muscle mass has more study data [17,18]. In addition, the study participants were mainly men and patients with HF [17]. By excluding patients with heart diseases at baseline and including both men and women in our study, we expanded the previous findings to the healthy adult population group. Furthermore, we used axial skeletal muscle mass, the sum of the muscle mass of the arms and legs, which is more widely used to assess muscle mass [18].
Ikeda et al. [8] used dual-energy X-ray absorptiometry (DEXA) to assess the association between NT-proBNP levels and loss of muscle mass in patients undergoing hemodialysis and showed that NT-proBNP levels were significantly higher in such patients experiencing muscle loss. The authors explained that this finding may be due to the lipolytic effect of natriuretic peptides [8,19]. Increased natriuretic peptides in the circulation can cause continuous release of free fatty acids, which can eventually cause increased energy dissipation by the skeletal muscle [20]. The authors stated that NT-proBNP level may be a useful marker of muscle mass loss in patients undergoing dialysis [8]. However, their study needs cautious interpretation as the participants were limited to patients undergoing hemodialysis. Additionally, the total number of participants was relatively small (n=238) [8]. Our study is novel in that it included a larger number of healthy cohorts without a history of CKD.
Yamashita et al. [9] showed that in participants with decreased thigh muscle cross-sectional area, the BNP levels were higher compared to that of the normal participants. Authors postulated that increased arterial stiffness, which is associated with loss of muscle mass, could have affected the hemodynamic change [9,21]. This altered change may mechanically stimulate BNP secretion [9,22]. In addition, the authors hypothesized that BNP levels increase to protect against further muscle damage, as BNP was found to reduce skeletal muscle mitochondrial dysfunction and oxidative stress after ischemia-reperfusion [9]. Although the study was meaningful in that it proposed a potential mechanism of increased BNP in participants with decreased skeletal muscle mass, the study is limited as it used thigh muscle cross-sectional area to assess the muscle mass of participants, which is not a commonly used method, compared to BIA or DEXA, to assess skeletal muscle mass [9,18].
The exact mechanisms of how muscle mass may relate to NT-proBNP are unclear [17]. Previous studies suggested several possible mechanisms. It was postulated that a substance produced in the lean mass suppresses the synthesis or release of natriuretic peptides from cardiomyocytes [23]. Another hypothesis was that sex steroid hormones, such as androgen, associated with increased lean mass, or estrogen, associated with lower lean mass, may affect natriuretic peptide levels [24]. Lastly, lean mass might secrete a substance that leads to NT-proBNP degradation or clearance [23].
Overall, our study is in line with previous studies showing that LMM is related to elevated NT-proBNP levels. In addition, compared with previous studies, our study has several strengths. First, we used BIA to assess the SMI, which correlates well with skeletal muscle mass and is widely available in clinical settings [25]. Second, compared to previous studies, we included a relatively larger number of participants, increasing the validity of our results. Third, we adjusted the participants’ physical activity levels as a confounding factor, which affects skeletal muscle and NT-proBNP levels [16].
Despite these strengths, our study has several limitations. First, it was a cross-sectional study. A causal inference between LMM and NT-proBNP levels could not be established. Second, there was a relatively small number of participants with severely LMM in our study population, manifesting as a small number of individuals with elevated levels of NT-proBNP. This is likely owing to the relatively young and healthy cohorts. In addition, the generalizability of our findings beyond this population requires cautious interpretation and judgement. Third, our study was conducted in a single ethnicity (Korean). Fourth, the LMM groups were less physically active than the other group. To overcome this limitation, we adjusted the physical activity level as a confounding factor to overcome this heterogeneity. Lastly, those with excessively elevated proBNP levels might have had subclinical abnormalities, which might have affected the relationship. However, this is less likely because the prevalence or incidence of HF and end-stage kidney disease in our cohort’s age group was very low in Korea [26,27]. Future prospective studies incorporating broader ethnicities and age groups are required to validate the study results.
In conclusion, this study demonstrated that the prevalence of elevated NT-proBNP levels was higher in the LMM populations. In addition, there was a significant association between severely LMM and elevated NT-proBNP levels in a relatively healthy adult population. Clinicians may need to consider skeletal muscle mass when interpreting elevated NT-proBNP levels in patients without HF or CKD.
Notes
CONFLICTS OF INTEREST
No potential conflict of interest relevant to this article was reported.
AUTHOR CONTRIBUTIONS
Conception or design: T.K.Y., C.H.P. Acquisition, analysis, or interpretation of data: T.K.Y., M.Y.L., C.H.P. Drafting the work or revising: T.K.Y., M.Y.C.W., M.S.K. Final approval of the manuscript: T.K.Y., M.Y.C.W., M.S.K., M.Y.L., Y.T.L., K.J.Y., C.H.P.
Acknowledgements
This work was supported by the National Research Foundation of Korea (NRF) grant funded by the Korea government (MSIT) (No. 2022R1F1A107487511).