Tumor Necrosis Factor-α as a Predictor for the Development of Nonalcoholic Fatty Liver Disease: A 4-Year Follow-Up Study
Article information
Abstract
Background
Tumor necrosis factor (TNF)-α is associated with insulin resistance and systemic inflammatory responses. The aim of this study was to investigate the relationship between TNF-α and the development of nonalcoholic fatty liver disease (NAFLD) in a longitudinal study.
Methods
Three hundred and sixty-three apparently healthy subjects (mean age, 40.5±6.1 years; male, 57.6%) without NAFLD were enrolled in 2003. Anthropometric and laboratory measurements were performed. The participants were grouped into tertiles according to their serum TNF-α levels from samples taken in 2003. At a 4-year follow-up, we compared the odds ratios (ORs) of the development of NAFLD according to the tertiles of TNF-α levels measured in 2003.
Results
At the 4-year follow-up, the cumulative incidence of NAFLD was 29.2% (106/363). The group that developed NAFLD had higher levels of TNF-α than those in the group without NAFLD (3.65±1.79 pg/mL vs. 3.15±1.78 pg/mL; P=0.016). When the 2003 serum TNF-α levels were categorized into tertiles: incidence of NAFLD observed in 2007 was significantly higher with increasing tertiles (22.6%, 35.8%, and 41.5%, respectively; P<0.05). The risk of developing NAFLD was significantly greater in the highest tertile of TNF-α than in the lowest tertile after adjusting for age, smoking, and BMI (OR, 2.20; 95% confidence interval, 1.12 to 4.01; P<0.05).
Conclusion
Higher serum TNF-α levels in subjects without NAFLD were associated with the development of NAFLD. The results of study might suggest a pathologic role of inflammation in NAFLD.
INTRODUCTION
Nonalcoholic fatty liver disease (NAFLD) is characterized by excessive hepatic accumulation of triglycerides and free fatty acids in the liver [1]. The pathologic spectrum of NAFLD is broad, ranging from simple steatosis to nonalcoholic steatohepatitis (NASH), potentially progressing to fibrosis and cirrhosis [2]. After fat infiltrates the liver, progression to hepatocellular inflammation and fibrosis may occur [3,4]. Additional factors, such as oxidative stress, mitochondrial abnormalities, and cytokines such as tumor necrosis factor (TNF)-α, are important in mediating this process. Serum levels of TNF-α are significantly increased in fatty liver disease, and are well correlated with the severity of liver disease [4].
TNF-α appears to play a central role in the development of hepatic steatosis. TNF-α is a proinflammatory cytokine that mediates hepatic inflammation, oxidative stress, and apoptosis or necrosis of liver cells [5,6]. The cytokine TNF-α is an important cytokine, exerting biological effects in different tissues and species at multiple levels [7].
Several clinical studies have investigated the role of TNF-α as a marker for NAFLD in cross-sectional analyses, but the results have been contradictory [8-10]. There have been no studies that have demonstrated a relationship between TNF-α and NAFLD in a longitudinal analysis.
Therefore, in this study, we investigated the relationship between TNF-α levels at baseline and the incidence of NAFLD development in a 4-year follow-up of a cohort of 363 apparently healthy Korean subjects.
METHODS
Participants
This study included 363 subjects in an observational cohort. Participants underwent medical screening at an industrial medical check-up in 2003 and at a follow-up in 2007. The results were previously reported as the Kangbuk Samsung Medical Center-Adipokine Study (KBSMC-Adipokine Study) [11]. Subjects with viral hepatitis B, hepatitis C, other liver diseases, acute or chronic inflammation, malignancy, or excessive alcohol consumption (>20 g/day) were excluded. Questionnaires were used to determine alcohol consumption (g/day). In addition, participants taking medications such as peroxisome proliferator-activated receptor-γ agonists, metformin, or antioxidants (vitamin E or C) were excluded. Alcohol intake, smoking habits, medication, and medical history were assessed by chart review and standardized questionnaire. The study protocol was approved by the Institutional Review Board and the Ethics Committee of Kangbuk Samsung Hospital.
Biochemical assays
Blood samples were obtained after 12 hours of overnight fasting and used to measure fasting plasma glucose, total cholesterol, low density lipoprotein cholesterol, high density lipoprotein cholesterol, fasting insulin, creatinine, direct bilirubin, and the following liver function parameters: aspartate aminotransferase (AST), alanine aminotransferase (ALT), gamma-glutamyltransferase (GGT), and alkaline phosphatase (ALP). Samples for measuring TNF-α were separated and stored at -80℃ prior to measurement of serum levels by enzyme-linked immunosorbent assay (ELISA, Bio Vendor Laboratory Medicine, Modrice, the Czech Republic). As a marker of insulin resistance (IR), homeostatic model assessment (HOMA) of IR was calculated as follows [12]: HOMA-IR=[fasting insulin (µIU/mL)×fasting glycaemia (mmol/L)]/22.5.
Ultrasonography
Abdominal ultrasonography (Logic Q700 MR, GE, Milwaukee, WI, USA) was performed in all subjects. Fatty liver was diagnosed based on standard criteria, including hepatorenal echo contrast, liver brightness, and vascular blurring, using a 3.5 MHz probe [12]. Several experienced radiologists, all of whom were blinded to the subjects' clinical status, performed the ultrasounds. We did not assess interobserver reliability.
Statistical analysis
Statistical analyses were performed with SPSS version 17.0 (SPSS Inc., Chicago, IL, USA). Normality was tested using the Kolmogorov-Smirnov test. The chi-squared test was used to compare categorical variables between groups. For continuous variables, parameters that followed a normal distribution were analyzed with a t test or analysis of variance (ANOVA) and described as the mean±SD. Parameters that did not follow a normal distribution were analyzed with the Mann-Whitney U test or the Kruskal-Wallis test and expressed as the median (interquartile range).
TNF-α levels were grouped into tertiles, and multiple logistic regression analysis was used to calculate odds ratios (ORs) for NAFLD. Subjects with higher TNF-α tertiles (second and third tertiles) were compared with the lowest tertile. Two-sided values of P<0.05 were considered significant.
RESULTS
The study cohort included 363 subjects (210 males, 153 females) with an average age of 40.5 years (range, 34 to 46). The subjects were divided into two groups: those with NAFLD (n=106) and those without NAFLD (n=257) in 2007. Table 1 shows a comparison of the baseline characteristics between subjects according to the presence or absence of NAFLD in 2007. The mean ages of the NAFLD and non-NAFLD groups were not significantly different. The NAFLD group had a significantly higher proportion of male subjects and a higher body mass index (BMI) (Table 1). Additionally, the baseline serum levels of ALP, GGT, direct bilirubin, and creatinine were significantly higher in the NAFLD group. The activities of the liver aminotransferases AST and ALT and the IR marker HOMA-IR were not significantly different between the two groups. Table 1 also shows the serum levels of TNF-α in 2003 according to the presence or absence of NAFLD in 2007. TNF-α levels were significantly higher in the NAFLD group than in the non-NAFLD group (3.65±1.78 pg/mL vs. 3.15±1.79 pg/mL; P=0.016).
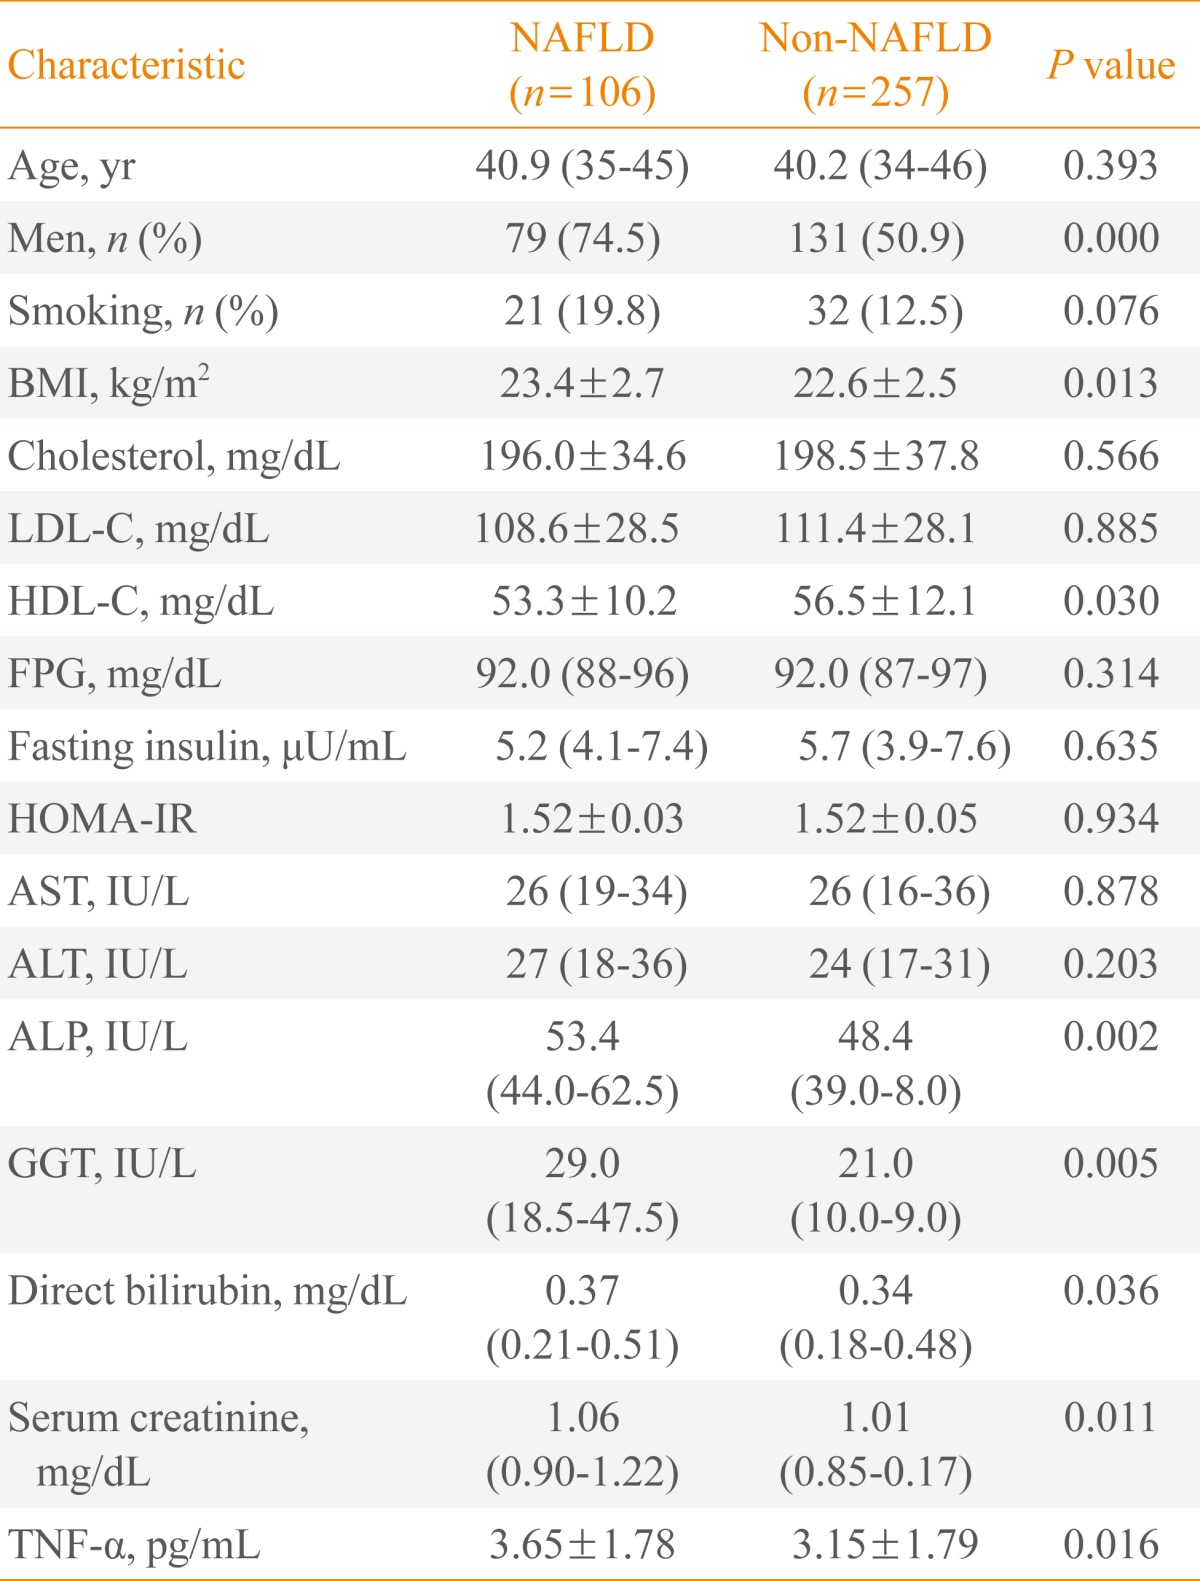
Baseline Clinical Characteristics of Subjects in 2003 Grouped by the Presence of Nonalcoholic Fatty Liver Disease in 2007
The range of levels of TNF-α for each tertile was as follows: tertile 1, 0 to 2.4 pg/mL (mean, 1.48); tertile 2, 2.4 to 3.8 pg/mL (mean, 3.14); and tertile 3, 3.8 to 12.0 pg/mL (mean, 5.25). When distributions of serum levels of TNF-α were expressed by tertile, we observed a statistically significant gradient for the development of NAFLD (22.6%, 35.8%, and 41.5%, respectively; P<0.05) (Table 2).
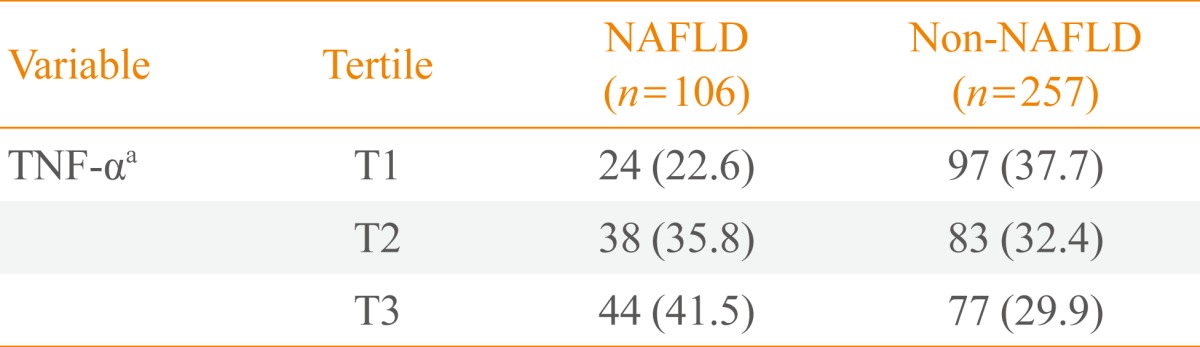
Tertile Distributions of Serum Tumor Necrosis Factor-α Levels Grouped by the Presence of Nonalcoholic Fatty Liver Disease in 2007
Table 3 shows the risk of NAFLD after 4 years of follow-up according to TNF-α levels separated by tertiles. The OR of the highest tertile compared with the lowest tertile was 2.20 (95% confidence interval, 1.21 to 4.01; P=0.010), even after adjustment for age, BMI, and smoking.
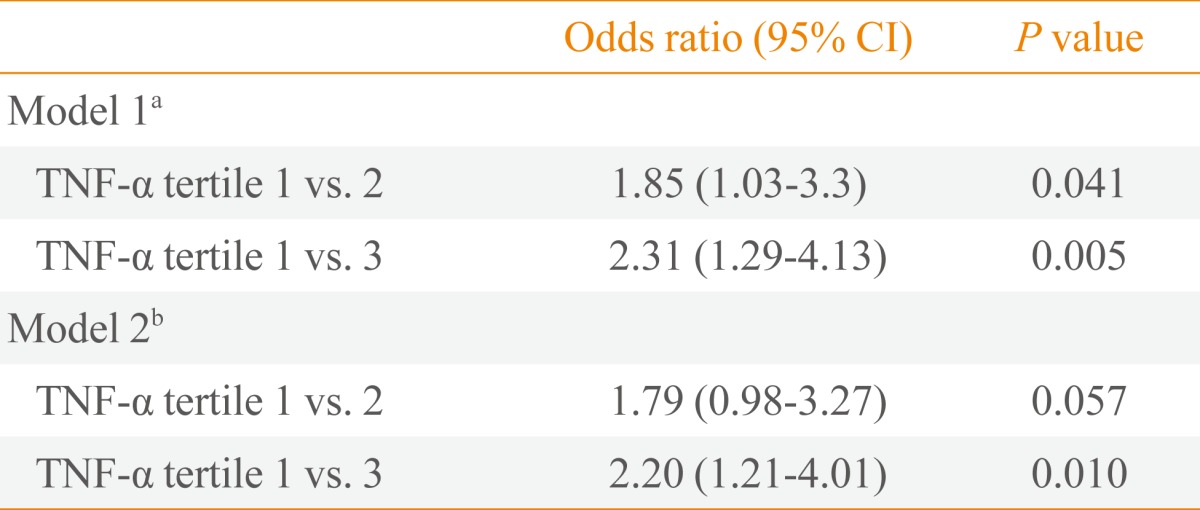
Odds Ratio (95% CI) for the Development of Nonalcoholic Fatty Liver Disease Associated with Each Tumor Necrosis Factor-α Tertile
DISCUSSION
In this study, we sought to fill a gap in the existing literature regarding the relationship between TNF-α and NAFLD. Previously, it had been hypothesized that TNF-α plays a role in the pathogenesis of diseases related to IR, including NAFLD [13,14]. Indeed, TNF-α production has been reported to be elevated in peripheral blood cell cultures collected from obese patients with NAFLD [7]. Nevertheless, direct evidence of TNF-α involvement in the early stages of NAFLD has not been previously described.
Human studies of TNF-α and NAFLD have shown conflicting results, probably due to heterogeneity in study populations or various factors that might affect serum levels of TNF-α. In a cross-sectional study by Hui et al. [8], TNF-α levels were found to be significantly higher in NAFLD patients compared to control patients, but there was no significant difference in TNF-α levels between patients with NAFLD and those with NASH as diagnosed by liver biopsy. In another cross-sectional study of patients with NASH, NAFLD, and control patients, serum TNF-α and soluble TNF receptor 1 were significantly higher in patients with NASH compared to patients with NAFLD and controls [9]. However, in a study by Musso et al. [10], there were no significant differences in TNF-α serum levels among nonobese, nondiabetic NASH patients and matched controls.
To date, a temporal association between TNF-α and NAFLD has not been demonstrated in a longitudinal analysis. We sought to determine whether or not TNF-α and NAFLD are significantly related over time. We observed a significant relationship between TNF-α and the development of NAFLD after 4 years.
TNF-α is a central mediator of IR, activating proinflammatory pathways such as c-jun N-terminal kinase and nuclear factor-κB. The proinflammatory cytokine TNF-α has an important role in these pathways, especially in patients with obesity or type 2 diabetes mellitus [15]. Thus, TNF-α may contribute to IR, which then may further promote inflammation by impairing the anti-inflammatory effect of insulin [16]. Furthermore, TNF-α is known to attract inflammatory leukocytes to the liver and to enhance the expression of sterol regulatory element binding protein-1c, which regulates de novo lipogenesis and is more highly expressed in NAFLD [17].
A study by Satapathy et al. [18] supported a potential role of TNF-α in the pathogenesis of NAFLD. In patients with NASH and elevated ALT, treatment with a TNF-α inhibitor (pentoxifylline) significantly reduced AST, ALT, and serum TNF-α levels and improved the IR index.
This study had several limitations. First, the diagnosis of NAFLD was not histologically confirmed, but was made by ultrasound, which has a reported sensitivity of 67% to 89% and specificity of 77% to 89% [19,20]. Second, alcohol intake was surveyed by a self-recorded questionnaire; therefore, we cannot rule out the possibility of misreporting or recall bias. In addition, lifestyle risk factors, which can affect future NAFLD, including exercise and dietary habits, were not considered. Thus, the data were subject to potential under- or overestimation. Third, we did not adjust for high sensitivity C-reactive protein (hs-CRP) and HOMA-IR. We did not measure hs-CRP, and there was no significant difference after adjustment for HOMA-IR. Lastly, our cohort was composed of participants who had volunteered for health check-ups, which might also introduce a selection bias.
In conclusion, this study showed a significant relationship between baseline TNF-α levels and the later development of NAFLD. The role of the cytokine TNF-α in NAFLD needs to be confirmed through further studies.
ACKNOWLEDGMENTS
This work was supported by MSD Korea research grant # MRI-110907-004 and Daewoong research grant # MRI-110907-005.
Notes
No potential conflict of interest relevant to this article was reported.