Articles
- Page Path
- HOME > Endocrinol Metab > Volume 35(1); 2020 > Article
-
Original ArticleClinical Study Association between Serum Free Thyroxine and Anemia in Euthyroid Adults: A Nationwide Study
-
Mijin Kim1
 , Bo Hyun Kim1, Hyungi Lee2, Min Hee Jang1, Jeong Mi Kim1, Eun Heui Kim1, Yun Kyung Jeon1, Sang Soo Kim1, In Joo Kim1
 -
Endocrinology and Metabolism 2020;35(1):106-114.
DOI: https://doi.org/10.3803/EnM.2020.35.1.106
Published online: March 19, 2020
1Department of Internal Medicine, Biomedical Research Institute, Pusan National University Hospital, Busan, Korea.
2Academic Research Organization, Clinical Trial Center, Biomedical Research Institute, Pusan National University Hospital, Busan, Korea.
- Corresponding author: Bo Hyun Kim. Division of Endocrinology and Metabolism, Department of Internal Medicine, Biomedical Research Institute, Pusan National University Hospital, 179 Gudeok-ro, Seo-gu, Busan 49241, Korea. Tel: +82-51-240-7236, Fax: +82-51-254-3237, pons71@pusan.ac.kr
Copyright © 2020 Korean Endocrine Society
This is an Open Access article distributed under the terms of the Creative Commons Attribution Non-Commercial License (http://creativecommons.org/licenses/by-nc/4.0/) which permits unrestricted non-commercial use, distribution, and reproduction in any medium, provided the original work is properly cited.
ABSTRACT
-
Background
- Studies on the relationship between thyroid function and anemia in the euthyroid range are scarce. We aimed to evaluate the association between anemia and serum free thyroxine (fT4) and thyrotropin (TSH) in euthyroid adults.
-
Methods
- Data on 5,352 participants aged ≥19 years were obtained from the Korea National Health and Nutrition Examination Survey VI (2013 to 2015). Anemia was defined as hemoglobin (Hb) <13 and <12 g/dL for men and women, respectively.
-
Results
- Overall, 6.1% of participants had anemia, and more women (9.9%) had anemia than men (2.8%, P<0.001). In multivariate analysis, serum fT4 levels, but not TSH, were positively associated with serum Hb levels in both sexes (P<0.001, each). Serum Hb levels linearly reduced across decreasing serum fT4 quartile groups in both sexes (P<0.001, each). After adjusting for potential confounding factors, participants with low-normal fT4 had 4.4 (P=0.003) and 2.8 times (P<0.001) higher risk for anemia than those with high-normal fT4 among men and women, respectively. When participants were divided into two groups at 50 years of age, in younger participants, men and women with the first quartile were at higher risk of anemia than men with the second quartile (odds ratio [OR], 3.3; P=0.029) and women with the forth quartile (OR, 3.2; P<0.001), respectively. This association was not observed in older participants.
-
Conclusion
- These results suggest that a low-normal level of serum fT4 was associated with a lower serum Hb level and a higher risk of anemia in euthyroid adults, especially in younger participants.
- Anemia is a multifactorial condition that affects 25% of the world's population, accounting for 8.8% of the total burden of the disease [12], and has been recognized as a complication of thyroid dysfunction [345]. A higher anemia prevalence of up to 57% was identified in patients with overt hyperthyroidism or in those with overt hypothyroidism than in those with euthyroidism [46]. The combination of anemia and thyroid dysfunction can be associated with diminished quality of life, worse clinical outcome, and increased health care cost [7]. Because of their high prevalence and close interrelation, both anemia and thyroid disease are significant clinical problems often encountered by physicians [489].
- Despite evidence supporting an association between anemia and overt thyroid disease, studies assessing subclinical or euthyroid conditions are limited [6101112]. A large cohort study reported that even in euthyroid patients, free thyroxine (fT4) levels are positively associated with erythrocyte indices such as hemoglobin (Hb), hematocrit, and erythrocyte count, with a negative correlation between thyrotropin (TSH) levels and the serum level of iron and transferrin saturation [10]. This association has a clinical impact on defining optimal thyroid function and therapeutic targets. Because the majority of people at risk of anemia have thyroid hormone levels within the reference range, it is clinically important to determine whether thyroid function is also associated with anemia in the euthyroid range. Thus, this study aimed to evaluate the association between anemia and serum fT4 and TSH levels in community-dwelling euthyroid adults.
INTRODUCTION
- Data source
- We obtained publicly available data from the sixth Korea National Health and Nutrition Examination Survey (KNHANES VI, 2013 to 2015), a nationwide cross-sectional survey that used hierarchical multistage cluster sampling to represent the Korean population. The KNHANES has been conducted every year since 1998 by the Korea Centers for Disease Control and Prevention to assess the health and nutritional status of Koreans [13]. Written informed consent was obtained from all participants prior to the survey and the protocol of this study was approved by the Institutional Review Board of the Pusan National University Hospital, Busan, Korea (No. 1908-022-082).
- Study population
- Overall, 6,037 participants aged ≥19 years had data on thyroid function tests and serum Hb level. Among them, participants who had a history of thyroid disease, those who were taking medicines that could influence thyroid function (n=251), and pregnant women (n=23) were excluded. In addition, participants were excluded if they had abnormal TSH (<0.62 or >6.86 mIU/L) and/or abnormal fT4 (<0.89 or >1.76 ng/mL) levels (n=411) [13].
- Laboratory measurements
- Serum TSH, fT4, and anti-thyroid peroxidase antibody (TPOAb) levels were measured according to an approved protocol, as previously reported [13]. A blood sample was collected from each participant in the morning after fasting for at least 8 hours, properly refrigerated, and sent to the testing facility. Serum TSH, fT4, and TPOAb levels were measured by an electrochemiluminescence immunoassay (Roche Diagnostics, Mannhein, Germany). Serum TSH levels were measured by an E-TSH kit (Roche Diagnostics), with a reference range of 0.35 to 5.50 mIU/L. Serum fT4 levels were measured by an E-Free T4 kit (Roche Diagnostics), with a reference range of 0.89 to 1.76 ng/mL. TPOAb levels were measured by an E-Anti-TPO kit (Roche Diagnostics), with a reference range of <34.0 IU/mL in humans. The measured serum TSH, fT4, and TPOAb levels met the quality control and assurance program of the College of American Pathology [13].
- Serum Hb was measured by an XN-9000 (Sysmex, Kobe, Japan). Serum creatinine (Cr) was measured using Jaffe or the rate-blanked compensated method (Hitachi Automatic Analyzer 7600-240, Hitachi, Tokyo, Japan). The estimated glomerular filtration rate (eGFR) was calculated from the equation developed using the Modification of Diet in Renal Disease study: eGFR (mL/min/1.73 m2)=175×(serum Cr mg/dL)−1.154×age−0.203×(0.742 for women) [14]. Urinary iodine concentrations (UICs) were measured using inductively coupled plasma mass spectrometry (ICP-MS, Perkin Elmer, Waltham, MA, USA) with iodine as the standard (Inorganic Venture, Christiansburg, VA, USA). UICs were adjusted using Cr levels to compensate for uneven water excretion rates during the spot urine specimen collection.
- Definitions
- Anemia was defined according to the World Health Organization criteria as an Hb level <13 g/dL for men and <12 g/dL for non-pregnant women [15]. Euthyroidism was defined as serum TSH and fT4 within the normal reference range of 0.62 to 6.86 mIU/L and 0.89 to 1.76 ng/mL, respectively, from the KNHANES VI data [13].
- Diabetes was defined as follows: (1) diagnosed with diabetes by doctor; (2) currently taking anti-diabetic medications; or (3) fasting plasma glucose ≥126 mg/dL. Hypertension was diagnosed when systolic blood pressure was ≥140 mm Hg, diastolic blood pressure ≥90 mm Hg, or if the patient was using anti-hypertensive medications. Participants were classified as having chronic kidney disease (CKD) when eGFR <60 mL/min/1.73 m2 or proteinuria ≥1+. Rheumatoid arthritis, malignancy history, smoking and economic status and limitation of physical activity were assessed based on self-reported questionnaires.
- Statistical analysis
- Statistical analyses were performed using the R program version 3.5.1 (R Foundation for Statistical Computing, Vienna, Austria; http://www.R-project.org). Data were evaluated using the weights assigned to individuals sampled to represent the Koreans. Continuous variables were presented as means with standard error of the mean±standard error of the mean or medians with interquartile ranges (IQRs) and were analyzed using the Student's t test. Categorical variables were presented as frequencies with percentages and were analyzed using the chi-square test. We performed multiple linear regression analysis to assess the finding that serum fT4 level is independently associated with serum Hb. The tendency of the serum Hb according to serum fT4 quartiles was evaluated by examining P for any trends based on multiple linear regression analyses. Multiple logistic regression analysis was done to estimate the odds ratios (ORs) with 95% confidence intervals (CIs) for anemia according to serum fT4 quartile categories. P<0.05 was considered statistically significant.
METHODS
- Baseline characteristics
- After excluding 685 participants, 5,352 (2,747 men and 2,605 women) were included in this analysis. The baseline characteristics of the participants are listed in Table 1. The mean age was 44.0±0.218 years, and men were younger than women (P=0.024). Overall, 6.1% of participants had anemia, and more women (9.9%) had anemia than men (2.8%, P<0.001). Mean serum Hb and fT4 levels were 14.4 g/dL and 1.24 ng/dL, respectively, and were 16.7% and 7.6% higher in men than in women (P<0.001 and P<0.001), whereas serum TSH level was 8.9% lower (P<0.001). The overall prevalence of TPOAb positivity was 5.2%, and the proportion of TPOAb positivity was higher in women than in men (7.3% vs. 3.3%, P<0.001). The median UIC was 280.7 µg/L (IQR, 150.4 to 650.5 µg/L), and there was no difference in UICs between both men and women.
- The percentages of participants with a past or current smoking habit, and those with diabetes and hypertension were significantly higher in men than in women (P<0.001, each). While women presented with a higher prevalence of rheumatoid arthritis compared with men (P<0.001). The proportion of participants with CKD, a malignancy, and activity limitation was 2.4%, 1.9%, and 5.5%, respectively, with no significant difference between men and women.
- Association between serum Hb and serum fT4
- Multiple linear regression analyses were conducted to evaluate the factors independently associated with serum Hb levels (Table 2). In men, serum Hb was associated positively with fT4 (β=0.865, P<0.001), current smoking (β=0.201, P<0.001) and hypertension (β=0.135, P=0.038), while inversely with age (β=−0.020, P<0.001), eGFR (β=−0.005, P=0.005), CKD (β=−0.478, P=0.019), rheumatoid arthritis (β=−0.587, P=0.010), and malignancies (β=−1.259, P<0.001). In women, serum fT4 (β=0.842, P<0.001), current smoking (β=0.431, P<0.001), and hypertension (β=0.203, P=0.003) were positively associated with serum Hb, and eGFR was inversely associated with serum Hb (β=−0.005, P=0.004). There was no independent correlation between serum TSH and serum Hb in both men (P=0.067) and women (P=0.247) (Supplemental Table S1).
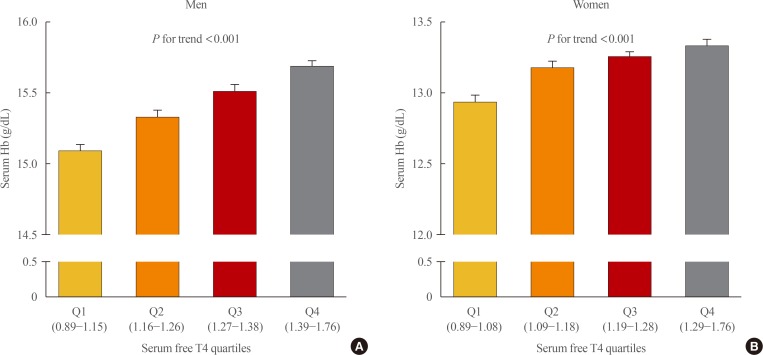
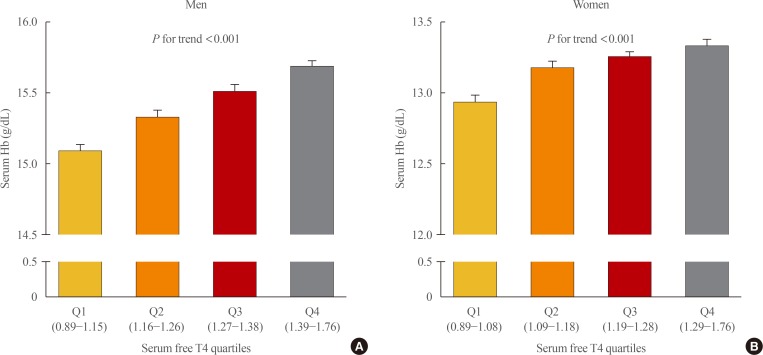
- Serum fT4 levels were divided into four groups based on the quartiles in each sex in order to examine whether the association between serum fT4 and serum Hb levels has a threshold effect. In both sexes, serum Hb levels linearly decreased across decreasing serum fT4 quartile groups (P for trend <0.001 in men and P for trend <0.001 in women) (Fig. 1).
- Risk for developing anemia according to serum fT4 levels
- Multivariate analysis was performed to identify ORs for anemia according to serum fT4 quartile groups (Table 3). In men, the prevalence of anemia was 5.6%, 3.2%, 1.7%, and 1.0% in quartiles 1, 2, 3, and 4, respectively. In an unadjusted model, the OR for anemia was 6.0 times higher among participants in the lowest quartile than among those in the highest quartile (95% CI, 2.42 to 14.68; P<0.001). After being adjusted for age, iodine intake, TPOAb positivity, and smoking status, the lowest quartile group had a significantly higher risk of anemia compared with the highest quartile group (OR, 3.9; 95% CI, 1.46 to 10.24; P=0.007 in model 1). In Model 2, which was adjusted for comorbidities, income level, and activity limitation in Model 1, the OR for anemia was still significantly higher in the lowest quartile group than in the highest quartile group (OR, 4.4; 95% CI, 1.66 to 11.73; P=0.003).
- In women, 15.4%, 8.7%, 8.7%, and 7.0% in quartiles 1, 2, 3, and 4, respectively, had anemia. In the unadjusted model, participants with the lowest quartile had 2.4 times higher OR for anemia than those with the highest quartile (95% CI, 1.58 to 3.70; P<0.001). With the multivariate analysis adjusted for age, iodine intake, TPOAb positivity, smoking status, comorbidities, income level, and activity limitation, participants with the lowest quartile were at a significantly greater risk for anemia than those with the highest quartile ([OR, 2.8; 95% CI, 1.78 to 4.48; P<0.001 in model 1] and [OR, 2.8; 95% CI, 1.78 to 4.51; P<0.001 in model 2]).
- Association between serum fT4 and anemia in younger and older participants
- The prevalence of anemia in each age group of 19 to 29, 30 to 39, 40 to 49, 50 to 59, 60 to 69, and ≥70 was 1.1%, 0.5%, 1.8%, 3.8%, 7.5%, and 10.7% in men, respectively, and 8.9%, 15.4%, 14.6%, 4.5%, 5.9%, and 10.6% in women, respectively (Supplemental Table S2). We further analyzed ORs for anemia according to the serum fT4 quartile groups in younger and older participants (Table 4). In participants with aged <50 years, the prevalence of anemia of quartiles 1, 2, 3, and 4 was 3.2%, 1.6%, 0%, and 0% in men, respectively, and 20.3%, 12.9%, 10.7%, and 7.7% in women, respectively. In the multivariate analysis, younger men in the first quartile had a significantly higher risk of anemia compared to those in the second quartile (OR, 3.3; 95% CI, 1.13 to 9.75; P=0.029). Also, younger women with low-normal fT4 had a 3.2 times higher OR than those with the high-normal fT4 (95% CI, 1.89 to 5.49; P<0.001). However, these associations were not observed in older men and women.
RESULTS
- In this nationwide cross-sectional study, we showed a significant association between serum fT4 levels and anemia in both euthyroid men and women. The prevalence of anemia was significantly higher in women than in men. After adjusting for major confounding parameters, serum fT4 levels, but not TSH, had an independently positive association with serum Hb levels in both sexes. In both sexes, serum Hb levels decreased linearly with decreasing serum fT4 quartile groups, and participants with low-normal fT4 had significantly higher risk of anemia than those with high-normal fT4. When participants were divided into younger and older groups at 50 years of age, in younger euthyroid participants, men and women with the first quartile were at higher risk of anemia than men with the second quartile and women with the forth quartile, respectively. However, this study did not find any association between the fT4 levels and anemia in older euthyroid participants.
- Despite evidence supporting the relationship between overt or subclinical thyroid disease and anemia, studies targeting euthyroid conditions are limited [6101112], although the relationship between thyroid hormones and erythrocyte indices in euthyroid subjects has been reported lately [101112]. According to a study conducted in a 1,011 euthyroid older participants, fT4 levels had a linear positive association with Hb levels and erythrocyte indices [10]. Similarly, based on a cohort of 708 euthyroid older participants, fT4 was significantly associated with Hb levels and erythrocyte parameters, whereas TSH was not, after adjusting for major confounding parameters [11]. The association between thyroid function and erythrocyte indices was further evaluated by Lippi et al. [12] in a retrospective cohort of 1,050 euthyroid older participants. Although that study failed to identify a relationship between thyroid function and Hb or hematocrit, it was the first to report a significantly positive relationship between red blood cell distribution width and thyroid hormone values [12]. Consistent with previous studies, we also found that serum fT4 levels, but not TSH levels, had an independently positive association with serum Hb levels in both sexes after adjusting for age, UIC, TPOAb positivity, smoking status, comorbidities, economic status, and activity limitation.
- Thyroid hormones have a crucial role in hematopoiesis, especially in erythropoiesis [8]. However, the mechanisms by which thyroid hormones modulate red blood cell production are not completely understood [3161718]. It seems that there are several mechanisms by which thyroid hormones regulate red blood cell production, including erythropoietin production and reactiveness, and affect iron transport and utilization [3161718]. These actions can be mediated either through TSH via the TSH receptor proposed to be present in erythrocytes and erythrocyte precursors, or through metabolic effects mediated by thyroid hormones [81119]. In this study, fT4, not TSH, was significantly related with Hb levels and an increased risk of anemia, indicating that the erythropoiesis impact of thyroid hormones is controlled by direct or indirect functions of fT4 rather than TSH receptor mediation, particularly in euthyroid individuals. Thus, fT4 may be a more appropriate physiological marker of thyroid hormone status than TSH in the euthyroid population.
- We used multivariate analysis to adjust for other potential confounding factors including age, iodine intake status, autoimmunity, smoking status, presence of comorbidities (diabetes, hypertension, CKD, rheumatoid arthritis, and malignancy), economic status, and physical activity. These factors are associated with both thyroid disease and anemia. Actually, the prevalence of thyroid disease and anemia increases with age [2021]. Patients with autoimmune thyroid disease are at higher risk of developing various forms of anemia, and pernicious anemia frequently coexists with autoimmune thyroid disease [9]. Iodine is also necessary for the synthesis of thyroid hormone, and high iodine intake is related to autoimmune thyroiditis and hypothyroidism [22]. Anemia is a well-known complication of CKD and renal function, represented as eGFR, is also related to thyroid function [2324]. Smoking, diabetes, hypertension, rheumatoid arthritis, malignancies, and socioeconomic status are also associated with the development of anemia [225262728]. In this study, we attempted to select appropriate confounders for multivariate analysis by minimizing the influence of other factors aside from thyroid function and anemia.
- Anemia burden also differed by age and sex. The prevalence of anemia was much higher in women than men under 50 years of age, while similar in men and women over 50 years of age. The major cause of anemia in young adults is related to gynecologic conditions that often present as iron deficiency [2]. When we divided participants into two groups using a cutoff age of 50 years, 87% of women underwent menopause. This study conducted a subgroup analysis based on age 50 years with the exception of pregnant women to minimize the effect of gynecological factors affecting anemia. In older adults, renal insufficiency, chronic disease, malignancies, and nutritional deficiency are the biggest contributors to total anemia burden in both sexes [29]. In our study, the association between serum fT4 and anemia was not observed in older participants. This finding demonstrates that many factors other than serum fT4 may contribute to the development of anemia in the elderly.
- This study has several limitations. First, the cross-sectional design did not provide us with the information to draw conclusions about causality. Second, we did not additionally measure ferritin and transferrin to distinguish iron deficiency anemia and anemia of chronic disease. Third, information on nutritional confounding factors including iron or vitamin supplements was not available for most participants. Forth, there was no participant with anemia among younger male with high-normal fT4. Nonetheless, to our knowledge, this is the first nationwide analysis to evaluate the risk of developing anemia according to thyroid function in euthyroid adults.
- In conclusion, data collected from a nationally representative cross-sectional survey showed that a low-normal serum fT4 level was related to lower serum Hb level and a higher risk of anemia in euthyroid adults, especially in younger adults. These findings demonstrate that the reference range of fT4 may not be appropriate from the viewpoint of anemia and that avoiding low-normal serum fT4 levels may help to avoid anemia in both men and women. Further studies are required to determine the feasibility of improving hematologic parameters through levothyroxine treatment in subjects with anemia and low-normal serum fT4.
DISCUSSION
-
CONFLICTS OF INTEREST: No potential conflict of interest relevant to this article was reported.
-
AUTHOR CONTRIBUTIONS:
Article information
SUPPLEMENTARY MATERIALS
Supplemental Table S1
- 1. de Benoist B, McLean E, Egli I, Cogswell M. WHO global database on anaemia; Geneva: World Health Organization; 2008.
- 2. Kassebaum NJ, Jasrasaria R, Naghavi M, Wulf SK, Johns N, Lozano R, et al. A systematic analysis of global anemia burden from 1990 to 2010. Blood 2014;123:615–624. ArticlePubMedPMCPDF
- 3. Fein HG, Rivlin RS. Anemia in thyroid diseases. Med Clin North Am 1975;59:1133–1145. ArticlePubMed
- 4. M'Rabet-Bensalah K, Aubert CE, Coslovsky M, Collet TH, Baumgartner C, den Elzen WP, et al. Thyroid dysfunction and anaemia in a large population-based study. Clin Endocrinol (Oxf) 2016;84:627–631. ArticlePubMed
- 5. Lippi G, Montagnana M, Salvagno GL, Guidi GC. Should women with abnormal serum thyroid stimulating hormone undergo screening for anemia? Arch Pathol Lab Med 2008;132:321–322. ArticlePubMed
- 6. Omar S, Hadj Taeib S, Kanoun F, Hammami MB, Kamoun S, Ben Romdhane N, et al. Erythrocyte abnormalities in thyroid dysfunction. Tunis Med 2010;88:783–788. PubMed
- 7. Wopereis DM, Du Puy RS, van Heemst D, Walsh JP, Bremner A, Bakker SJL, et al. The relation between thyroid function and anemia: a pooled analysis of individual participant data. J Clin Endocrinol Metab 2018;103:3658–3667. ArticlePubMedPMCPDF
- 8. Kawa MP, Grymula K, Paczkowska E, Baskiewicz-Masiuk M, Dabkowska E, Koziolek M, et al. Clinical relevance of thyroid dysfunction in human haematopoiesis: biochemical and molecular studies. Eur J Endocrinol 2010;162:295–305. ArticlePubMed
- 9. Szczepanek-Parulska E, Hernik A, Ruchała M. Anemia in thyroid diseases. Pol Arch Intern Med 2017;127:352–360. ArticlePubMedPDF
- 10. Bremner AP, Feddema P, Joske DJ, Leedman PJ, O'Leary PC, Olynyk JK, et al. Significant association between thyroid hormones and erythrocyte indices in euthyroid subjects. Clin Endocrinol (Oxf) 2012;76:304–311. ArticlePubMed
- 11. Schindhelm RK, ten Boekel E, Heima NE, van Schoor NM, Simsek S. Thyroid hormones and erythrocyte indices in a cohort of euthyroid older subjects. Eur J Intern Med 2013;24:241–244. ArticlePubMed
- 12. Lippi G, Danese E, Montagnana M. Thyroid hormone levels are associated with anisocytosis in a cohort of euthyroid older outpatients. Eur J Intern Med 2014;25:e4–e5. ArticlePubMed
- 13. Kim WG, Kim WB, Woo G, Kim H, Cho Y, Kim TY, et al. Thyroid stimulating hormone reference range and prevalence of thyroid dysfunction in the Korean population: Korea National Health and Nutrition Examination Survey 2013 to 2015. Endocrinol Metab (Seoul) 2017;32:106–114. ArticlePubMedPMC
- 14. Levey AS, Coresh J, Greene T, Stevens LA, Zhang YL, Hendriksen S, et al. Using standardized serum creatinine values in the modification of diet in renal disease study equation for estimating glomerular filtration rate. Ann Intern Med 2006;145:247–254. ArticlePubMed
- 15. Beutler E, Waalen J. The definition of anemia: what is the lower limit of normal of the blood hemoglobin concentration? Blood 2006;107:1747–1750. ArticlePubMedPMCPDF
- 16. Touam M, Guery B, Goupy C, Menoyo V, Drueke T. Hypothyroidism and resistance to human recombinant erythropoietin. Nephrol Dial Transplant 2004;19:1020–1021. ArticlePubMedPDF
- 17. Christ-Crain M, Meier C, Huber P, Zulewski H, Staub JJ, Muller B. Effect of restoration of euthyroidism on peripheral blood cells and erythropoietin in women with subclinical hypothyroidism. Hormones (Athens) 2003;2:237–242. ArticlePubMed
- 18. Cinemre H, Bilir C, Gokosmanoglu F, Bahcebasi T. Hematologic effects of levothyroxine in iron-deficient subclinical hypothyroid patients: a randomized, double-blind, controlled study. J Clin Endocrinol Metab 2009;94:151–156. ArticlePubMedPDF
- 19. Perrin MC, Blanchet JP, Mouchiroud G. Modulation of human and mouse erythropoiesis by thyroid hormone and retinoic acid: evidence for specific effects at different steps of the erythroid pathway. Hematol Cell Ther 1997;39:19–26. ArticlePubMedPDF
- 20. Gaskell H, Derry S, Andrew Moore R, McQuay HJ. Prevalence of anaemia in older persons: systematic review. BMC Geriatr 2008;8:1ArticlePubMedPMCPDF
- 21. Cooper DS, Biondi B. Subclinical thyroid disease. Lancet 2012;379:1142–1154. ArticlePubMed
- 22. Jeon MJ, Kim WG, Kwon H, Kim M, Park S, Oh HS, et al. Excessive iodine intake and thyrotropin reference interval: data from the Korean National Health and Nutrition Examination Survey. Thyroid 2017;27:967–972. ArticlePubMed
- 23. Wolf G, Muller N, Hunger-Battefeld W, Kloos C, Muller UA. Hemoglobin concentrations are closely linked to renal function in patients with type 1 or 2 diabetes mellitus. Kidney Blood Press Res 2008;31:313–321. ArticlePubMed
- 24. Sun MT, Hsiao FC, Su SC, Pei D, Hung YJ. Thyrotropin as an independent factor of renal function and chronic kidney disease in normoglycemic euthyroid adults. Endocr Res 2012;37:110–116. ArticlePubMed
- 25. Nordenberg D, Yip R, Binkin NJ. The effect of cigarette smoking on hemoglobin levels and anemia screening. JAMA 1990;264:1556–1559. ArticlePubMed
- 26. Wolfe F, Michaud K. Anemia and renal function in patients with rheumatoid arthritis. J Rheumatol 2006;33:1516–1522. PubMed
- 27. Gaspar BL, Sharma P, Das R. Anemia in malignancies: pathogenetic and diagnostic considerations. Hematology 2015;20:18–25. ArticlePubMed
- 28. Styszynski A, Mossakowska M, Chudek J, Puzianowska-Kuznicka M, Klich-RaczkaA , Neumann-Podczaska A, et al. Prevalence of anemia in relation to socio-economic factors in elderly Polish population: the results of PolSenior study. J Physiol Pharmacol 2018;69:75–81. PubMed
- 29. Guralnik JM, Eisenstaedt RS, Ferrucci L, Klein HG, Woodman RC. Prevalence of anemia in persons 65 years and older in the United States: evidence for a high rate of unexplained anemia. Blood 2004;104:2263–2268. ArticlePubMedPDF
References
Serum hemoglobin (Hb) levels according to serum free thyroxine (T4) quartiles in (A) euthyroid men and (B) women. Values are presented as the estimated mean with standard error of the means.
Baseline Characteristics of Euthyroid Subjects (≥19 Years) Who Underwent Thyroid Function Tests and Serum Hemoglobin Levels Measurements in KNHANES VI (2013 to 2015)
Values are expressed as mean±standard error of the mean, number (%), or median (interquartile range).
KNHANES, Korea National Health and Nutrition Examination Survey; T4, thyroxine; TSH, thyrotropin; eGFR, estimated glomerular filtration rate; TPOAb, anti-thyroid peroxidase antibody; UIC, urinary iodine concentration.
aTPOAb positivity was defined as levels >34 IU/mL; bWeighted percentage
Multiple Linear Regression Analysis to Determine Which Covariates Including Serum fT4 Level Are Independently Associated with Serum Hb Level
Multiple Logistic Regression Analyses to Determine the ORs of Having Anemia According to Serum fT4 Quartile Categories
Model 1 was adjusted for age, iodine intake, autoimmunity, and smoking. Model 2 was adjusted by Model 1, comorbidities (diabetes, hypertension, chronic kidney disease, rheumatoid arthritis, cancer history), income level, and activity limitation.
OR, odds ratio; fT4, free thyroxine; CI, confidence interval.
aWeighted percentage.
ORs of Having Anemia According to Serum fT4 Quartile Categories in Younger and Older Participants
Figure & Data
References
Citations
- Thyroid Function and Risk of Anemia: A Multivariable-Adjusted and Mendelian Randomization Analysis in the UK Biobank
Nicolien A van Vliet, Annelies E P Kamphuis, Wendy P J den Elzen, Gerard J Blauw, Jacobijn Gussekloo, Raymond Noordam, Diana van Heemst
The Journal of Clinical Endocrinology & Metabolism.2022; 107(2): e643. CrossRef - Thyroid function, pernicious anemia and erythropoiesis: a two-sample Mendelian randomization study
Alisa D Kjaergaard, Alexander Teumer, Eirini Marouli, Panos Deloukas, Aleksander Kuś, Rosalie Sterenborg, Bjørn O Åsvold, Marco Medici, Christina Ellervik
Human Molecular Genetics.2022; 31(15): 2548. CrossRef - Changes of hematological indices in patients with diffuse toxic goiter
F. H. Saidova, L. M. Ahmedova, Zh. B. Aslanova, N. A. Najafov
Klinicheskaia khirurgiia.2021; 88(3-4): 76. CrossRef - Association between Serum Free Thyroxine and Anemia in Euthyroid Adults: A Nationwide Study (Endocrinol Metab 2020;35:106-14, Mijin Kim et al.)
Zheng Feei Ma
Endocrinology and Metabolism.2020; 35(2): 484. CrossRef - Association between Serum Free Thyroxine and Anemia in Euthyroid Adults: A Nationwide Study (Endocrinol Metab 2020;35:106-14, Mijin Kim et al.)
Mijin Kim, Bo Hyun Kim
Endocrinology and Metabolism.2020; 35(3): 669. CrossRef
 PubReader
 ePub Link
 Cite
Cite