Articles
- Page Path
- HOME > Endocrinol Metab > Volume 34(3); 2019 > Article
-
Original ArticleEndocrine Research Effects of Oxytocin on Cell Proliferation in a Corticotroph Adenoma Cell Line
-
Jung Soo Lim1,2
 , Young Woo Eom3, Eun Soo Lee1, Hyeong Ju Kwon4, Ja-Young Kwon5, Junjeong Choi6, Choon Hee Chung1, Young Suk Jo7, Eun Jig Lee7
 -
Endocrinology and Metabolism 2019;34(3):302-313.
DOI: https://doi.org/10.3803/EnM.2019.34.3.302
Published online: September 26, 2019
1Department of Internal Medicine, Yonsei University Wonju College of Medicine, Wonju, Korea.
2Institute of Evidence-based Medicine, Yonsei University Wonju College of Medicine, Wonju, Korea.
3Cell Therapy and Tissue Engineering Center, Yonsei University Wonju College of Medicine, Wonju, Korea.
4Department of Pathology, Yonsei University Wonju College of Medicine, Wonju, Korea.
5Department of Obstetrics and Gynecology, Yonsei University College of Medicine, Seoul, Korea.
6Yonsei Institute of Pharmaceutical Sciences, Yonsei University College of Pharmacy, Incheon, Korea.
7Department of Internal Medicine, Yonsei University College of Medicine, Seoul, Korea.
- Corresponding author: Eun Jig Lee. Division of Endocrinology, Department of Internal Medicine, Yonsei University College of Medicine, 50-1 Yonsei-ro, Seodaemun-gu, Seoul 03722, Korea. Tel: +82-2-2228-1983, Fax: +82-2-393-6884, ejlee423@yuhs.ac
Copyright © 2019 Korean Endocrine Society
This is an Open Access article distributed under the terms of the Creative Commons Attribution Non-Commercial License (http://creativecommons.org/licenses/by-nc/4.0/) which permits unrestricted non-commercial use, distribution, and reproduction in any medium, provided the original work is properly cited.
ABSTRACT
-
Background
- Oxytocin (OXT) has been reported to act as a growth regulator in various tumor cells. However, there is a paucity of data on the influence of OXT on cell proliferation of corticotroph adenomas. This study aimed to examine whether OXT affects cell growth in pituitary tumor cell lines (AtT20 and GH3 cells) with a focus on corticotroph adenoma cells.
-
Methods
- Reverse transcription polymerase chain reaction and enzyme-linked immunosorbent assay were conducted with AtT20 cells to confirm the effects of OXT on hormonal activity; flow cytometry was used to assess changes in the cell cycle after OXT treatment. Moreover, the impact of OXT on proliferating cell nuclear antigen (PCNA), nuclear factor κB, and mitogen-activated protein kinase signaling pathway was analyzed by Western blot.
-
Results
- OXT treatment of 50 nM changed the gene expression of OXT receptor and pro-opiomelanocortin within a short time. In addition, OXT significantly reduced adrenocorticotropic hormone secretion within 1 hour. S and G2/M populations of AtT20 cells treated with OXT for 24 hours were significantly decreased compared to the control. Furthermore, OXT treatment decreased the protein levels of PCNA and phosphorylated extracellular-signal-regulated kinase (P-ERK) in AtT20 cells.
-
Conclusion
- Although the cytotoxic effect of OXT in AtT20 cells was not definite, OXT may blunt cell proliferation of corticotroph adenomas by altering the cell cycle or reducing PCNA and P-ERK levels. Further research is required to investigate the role of OXT as a potential therapeutic target in corticotroph adenomas.
- Cushing's disease (CD), the most common cause of endogenous Cushing's syndrome, is caused by an adrenocorticotropic hormone (ACTH)-secreting pituitary tumor (corticotroph adenoma) that overproduces glucocorticoid from the adrenal cortex [1]. CD is associated with significant mortality and morbidity [1]; therefore, appropriate treatment is essential. Surgery is generally considered the initial treatment of choice for patients with CD. However, relatively high recurrence rates ranging from 20% to 25% on long-term follow-up remain a challenge [23]. Radiotherapy, either alone or in combination with adrenolytic drugs, may be used if surgery fails [4]. Nevertheless, none of the current treatment modalities ensures a full and permanent cure. Therefore, novel medical treatments for patients with CD are urgently needed.
- Oxytocin (OXT), a well-known neurohypophysial hormone, plays an essential role in mammalian labor and lactation [5]. In addition to its classical role in reproductive physiology, growing evidence indicates that OXT may be involved in a wide spectrum of neuropsychiatric functions, including prosocial behavior and promotion of learning and memory. OXT can also regulate responses to stressors and inflammation and may be inhibited by stressful events [6]. Moreover, recent research has shown that OXT plays an important role in energy and bone metabolism. Although the reference value of plasma OXT level in humans is not clearly established, one study demonstrated that serum OXT level was lower in a group with type 2 diabetes and obesity than in a group with normal glucose tolerance [7]. In addition, high OXT level was associated with high bone mineral density in a 6-year prospective study of a population-based cohort [8]. Promoted by this background, OXT has attained research attention as a potential treatment target for endocrine disorders. OXT is synthesized in the hypothalamic paraventricular and supraoptic nuclei and released into systemic circulation via the neurohypophysis [9]. OXT is also produced in peripheral tissues, including uterus, placenta, amnion, corpus luteum, testis, gut, and heart [1011]. Plasma OXT in humans has been reported to show no diurnal variations [12], and females usually tend to present with higher concentration of OXT [613].
- There have been several studies of the effects of OXT on proliferation of various tumor cells [1415]. OXT functions as a growth regulator by activating the OXT receptor in tumor cells [15]. In neoplastic cells derived from trophoblast or choriocarcinoma cells [16] and small-cell lung carcinoma [17], OXT promotes cell growth. On the other hand, OXT can inhibit cell growth in carcinomas of the endometrium [18] or ovary [19]. In osteosarcoma [20], breast cancer [2122], neuroblastoma [2324], and prostate cancer [25], OXT has been reported to show both stimulatory and inhibitory functions [1415]. According to a previous research, OXT is capable of stimulating prolactin release in vitro [26]. Moreover, a recent study demonstrated that OXT can induce transient elevation of intracellular Ca2+ concentration in gonadotrophs, lactotrophs, and somatotrophs, thereby mimicking secretagogues of each cell, suggesting that OXT signaling might serve to coordinate the release of anterior pituitary hormones during specific physiological conditions [27]. However, there is a paucity of data on the effects of OXT on cell proliferation or hormone secretion in ACTH-secreting tumors.
- Therefore, this study aimed to examine whether OXT affects cell proliferation in pituitary tumor cell lines, focusing on corticotroph adenoma cells. OXT is also involved in activation of the mitogen-activated protein kinase (MAPK) cascade, which is associated with cell proliferation. The effects of OXT on MAPK signaling pathways and the cell cycle were also investigated to understand the mechanism underlying OXT effects on cell growth in corticotroph adenomas.
INTRODUCTION
- Cell culture
- Mouse pituitary corticotroph cells (AtT20, Cat No. CCL-89, ATCC, Manassas, VA, USA) and rat somatotroph cells (GH3, Cat No. CCL-82.1, ATCC) were cultured with low-glucose Dulbecco's modified Eagle medium (DMEM) with 10% fetal bovine serum, 100 U/mL penicillin, and 100 µg/mL streptomycin. These cells (25,000 cells/cm2) were incubated in a humidified incubator at 37℃ with 5% CO2.
- Immunohistochemical staining and interpretation
- Immunohistochemical staining was performed to evaluate whether OXT receptor was expressed in normal mouse pituitary gland. Animal experiments were conducted according to the applicable Korean laws, reviewed and approved by the Institutional Animal Care and Use Committee (IACUC) of the Yonsei University Severance Hospital, Seoul, Korea (IACUC Approval No: 2015-0025), and performed in accordance with the approved guidelines by the IACUC. Deparaffinization, rehydration, and antigen retrieval were performed using CC1 (prediluted; pH 8.0) antigen retrieval solution (Ventana Medical Systems, Roche Group, Tucson, AZ, USA) on the BenchMark ULTRA automated slide stainer (Ventana) for 64 minutes at 100℃ (default temperature on ULTRA). After heat-induced antigen retrieval, rabbit polyclonal OXT receptor antibody (Cat No. bs-1314R, dilution 1:100, Bioss Antibodies, Woburn, MA, USA) was incubated with samples for 15 minutes. Binding of the primary antibody was detected using an OptiView DAB IHC Detection Kit (Ventana) according to the manufacturer's instructions. Intensity was defined as follows: 0 for no detectable staining, 1+ for weak reactivity mainly detectable at high magnification (×20 to 40 objective), and 2+ or 3+ for more intense (moderate or strong, respectively) reactivity easily detectable at low magnification (×4 objective).
- Immunofluorescence staining and interpretation
- Immunofluorescence staining for OXT receptor was performed in AtT20 and GH3 cells. Moreover, in order to evaluate OXT receptor and corticotropin-releasing hormone (CRH) receptor in the AtT20 cell line, cells were seeded into chamber slides and cultured for 24 hours. After 24 hours, the culture media was removed, and 4% paraformaldehyde solution was added for 15 minutes at room temperature to fix cells. After cell fixation, OXT receptor (Cat No. bs-1314R, dilution 1:200, Bioss Antibodies) and CRH receptor (CRF-RI, Cat No. sc-12381, dilution 1:200, Santa Cruz Biotechnology, Santa Cruz, CA, USA) antibodies were co-stained using a commercial immunohistochemistry kit in accordance with the manufacturer's instructions (Thermo Scientific, Rockford, IL, USA). Briefly, primary antibody was incubated for 24 hours at 4℃, and secondary antibody was incubated for 3 hours at room temperature. Stained slides were mounted with 4′,6-diamidino-2-phenylindole (DAPI)-containing mounting medium and analyzed with a confocal LASER microscope.
- MTT assay
- The effects of OXT (Cat No. 50-56-6, Cayman Chemical, Ann Arbor, MI, USA) or OXT receptor antagonist (L-368,899, Cat No. 1910, TOCRIS Bioscience, Bristol, UK) on proliferation of AtT20 and GH3 cells were determined by MTT assay. AtT20 and GH3 cells (2×10⁴ cells/cm2) were plated in 96-well plates. After 24 hours, cells were treated with OXT (0 to 500 nM) or L-368,899 (0 to 500 nM) for 24 to 48 hours, and then MTT (Sigma-Aldrich, St. Louis, MO, USA) dissolved in phosphate-buffered saline was added to each well at a final concentration of 5 mg/mL. The cells were incubated at 37℃ for 2 hours. Formazan (formed in plates during the assay) was dissolved in 100 µL dimethyl sulfoxide (DMSO), and a microplate reader (BioTek Instruments, Winooski, VT, USA) was used to read the optical density of each well at 570 nm.
- Cell cycle analysis
- The Cycle TEST Plus DNA Reagent Kit (BD Biosciences, San Jose, CA, USA) was used to analyze cellular DNA contents per the manufacturer's instructions. AtT20 cells were trypsinized, and trypsinization was then neutralized by adding DMEM. Next, AtT20 cells were centrifuged at 1,800 rpm for 5 minutes. Cells were washed twice using wash buffer provided in the kit. Thereafter, cells were sequentially treated with solutions A, B, and C in a dark room in compliance with the manufacturer's instructions. Cellular DNA contents were analyzed by flow cytometry (BD FACSAria III, BD Biosciences).
- Quantitative real-time polymerase chain reaction
- OXT receptor and pro-opiomelanocortin (POMC) primers were used to confirm the effects of OXT treatment on hormonal activity in AtT20 cells. The following primers were used mouse OXT receptor: sense 5′-TGGCCTTCATCGTGTGCTGGA-3′, antisense 5′-AGAGGAAGCGCTGCACGAGTT-3′; mouse POMC: sense 5′-CAGGTCCTGGAGTCCGAC-3′, antisense 5′-CATGAAGCCACCGTAACG-3′; mouse glyceraldehyde-3-phosphate dehydrogenase: sense 5′-CTGGAGAAACCTGCCAAGTA-3′, antisense 5′-AGTGGGAGTTGCTGTTGAAG-3′. Total RNA was extracted from AtT20 cell lines with the TRIzol Reagent (Invitrogen, Carlsbad, CA, USA). Complementary DNA (cDNA) was made from 1 µg total RNA using a cDNA synthesis kit (Toyobo, Osaka, Japan) according to the manufacturer's instructions. Mixtures were incubated for 5 minutes at 37℃, 15 minutes at 37℃, 5 minutes at 98℃, and then held at 4℃. Obtained templates were performed using quantitative real-time polymerase chain reaction (qRT-PCR; 10℃, 2 minutes for 1 cycle; 95℃, 10 minutes; 95℃, 15 seconds; 60℃, 1 minute for 40 cycles) with TOPrea qPCR 2X PreMIX (Enzynomics, Daejeon, Korea) and run on an ABI PRISM 7900HT sequence detection system (Applied Biosystems, Foster City, CA, USA).
- Enzyme-linked immunosorbent assay
- ACTH concentrations of the medium before and after OXT treatment in AtT20 cells were measured by a mouse ACTH enzyme-linked immunosorbent assay (ELISA) kit (AE23625MO, Abebio, Wuhan, China) according to the manufacturer's instructions.
- Western blot analysis
- AtT20 and GH3 cells were used to detect changes in OXT receptor according to OXT treatment time and concentration; equal numbers of cells were subjected to electrophoresis on 12% sodium dodecyl sulfate-polyacrylamide gel electrophoresis (SDS-PAGE) gels, and separated proteins were transferred electrophoretically onto nitrocellulose membrane (0.45 µm, Bio-Rad, Hercules, CA, USA). Proliferating cell nuclear antigen (PCNA) antibody (Santa Cruz Biotechnology) was used to confirm the effects of OXT treatment on cell proliferation. Extracellular-signal-regulated kinase (ERK)1/2, phosphorylated ERK1/2 (P-ERK1/2), p38, P-p38, Jun N-terminal kinase (JNK), and phosphorylated-JUK (P-JNK) antibodies (Cat No. 9102S for ERK; 9101S for P-ERK; 8690S for p38; 4511S for P-p38; 9252S for JNK; 4671S for p-JNK, dilution 1:1,000; Cell Signaling Technology, Danvers, MA, USA) were used to evaluate changes in the MAPK signaling pathway after OXT treatment. IκBa and P-IκBa (Santa Cruz Biotechnology; sc-1643 and sc-8404, respectively) antibodies were used to investigate whether OXT treatment affects the nuclear factor κB (NF-κB) signaling pathway in AtT20 and GH3 cells. Analysis was performed after selective OXT receptor antagonist treatment. After blocking with 5% non-fat milk, the membrane was incubated with primary antibodies at room temperature for 1 hour. The membrane was developed with SuperSignal West Femto maximum sensitivity substrate (Pierce, Rockford, IL, USA) following the manufacturer's instructions and detected with a CCD camera Las-3000 (Fujifilm Life Science, Cambridge, MA, USA). The relative density of immunostained bands was quantified using Quantity One software version 4.6.1. (Bio-Rad).
- Statistical analysis
- Data are presented as the mean±standard deviation (SD) or mean±standard error of the mean (SEM). To compare mean values between different groups, Student's t test and one-way analysis of variance were used, followed by the Dunnett post hoc test. Statistical analysis was performed using IBM SPSS version 23.0 for Windows (IBM Co., Armonk, NY, USA). Differences were considered statistically significant at P<0.05.
METHODS
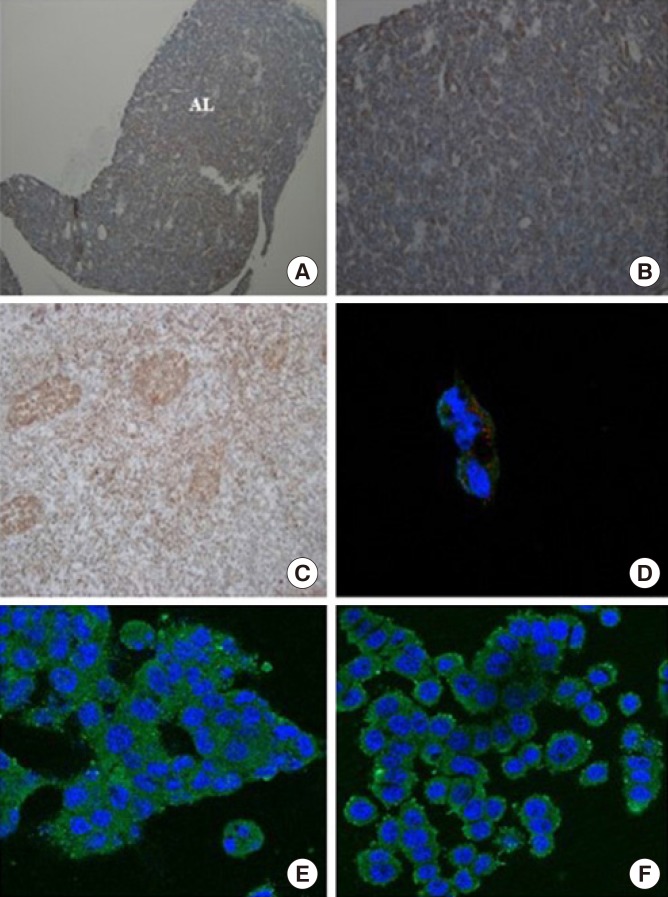
- OXT receptors are diffusely expressed in normal mouse pituitary gland and GH3 cells, and co-existence of OXT receptor with CRH receptor is observed in AtT20 cells
- Immunohistochemical staining was performed using paraffin blocks of normal mouse pituitary. Fig. 1A, 1B, and Supplemental Fig. S1 show the results of OXT receptor staining in normal mouse pituitary gland. As shown in Fig. 1A and 1B, normal mouse pituitary gland was diffusely stained for OXT receptor (intensity 2+; extent 80%), although OXT receptors were less frequently expressed in the intermediate lobe than in the anterior lobe (Supplemental Fig. S1). Fig. 1C illustrates the result of OXT receptor staining in uterine endometrial tissue, which was used as a positive control (intensity 3+; extent >90%). Pituitary ACTH is released in response to CRH and then rapidly stimulates glucocorticoid synthesis in the adrenal gland. In addition, because CRH was reported to stimulate secretion of both OXT and vasopressin as well as ACTH in patients with Cushing's syndrome, immunofluorescence co-staining for OXT receptor and CRH receptor was performed in AtT20 cells. OXT receptor and CRH receptor were partly co-expressed in AtT20 cells (Fig. 1D), although the intensity of staining for OXT receptor was weaker than that of CRH receptor. Moreover, as shown in Fig. 1E, F, OXT receptor was expressed in both AtT20 and GH3 cells.
- High concentration of OXT tends to reduce cell viability in AtT20 cells but not GH3 cells
- To evaluate the effect of OXT on cell proliferation in AtT20 cells, cells were exposed to OXT (0 to 500 nM) for 24 hours (Supplemental Fig. S2A). OXT at greater than 50 nM had a tendency to slow AtT20 cell growth; cells treated with 50 nM OXT for 24 hours showed only a 9% increase compared to the control group (23.8%). Moreover, Supplemental Fig. S2B shows that L-368,899 (0 to 500 nM), an OXT receptor antagonist, tended to mitigate the effect of OXT on AtT20 cell proliferation. As shown in Supplemental Fig. S2C, when GH3 cells were also treated with OXT for 48 hours, the effects on cell growth were not remarkable except for a significant increase found with 500 nM OXT. As the concentration of L-368,899 increased, GH3 cell viability tended to decrease (Supplemental Fig. S2D).
- Oxytocin can affect the cell cycle of AtT20 cells
- The G0 population of AtT20 cells treated with OXT for 6 hours increased by about 10%, and the S and G2/M populations decreased by 6% or 5.5%, respectively. As shown in Fig. 2, the OXT-induced G0 population was slightly reduced at 6 hours by OXT receptor antagonist L-368,899. Moreover, in AtT20 cells treated with OXT and L-368,899 for 24 hours, G0 phase decreased by 3%, but G2/M phase increased by 2.5% compared to the control. After treatment with OXT for 6 or 24 hours, the S and G2/M populations were significantly reduced compared to the control; the OXT receptor antagonist recovered these populations. These results suggest that OXT may blunt proliferation of AtT20 cells by delaying cell division.
- OXT significantly reduces gene expression of OXT receptor and POMC in AtT20 cells
- Because pituitary ACTH is derived from the POMC precursor peptide, we investigated whether OXT influences POMC gene expression in AtT20 cells. After treatment with 50 nM OXT, the mRNA levels of POMC and OXT receptor genes were estimated at each time point using qRT-PCR. As shown in Fig. 3, gene expression of the OXT receptor and POMC was significantly affected within 30 minutes by incubation with 50 nM OXT. Various effects on OXT receptor gene expression were induced according to time point.
- OXT significantly reduces ACTH level within a short time in AtT20 cells
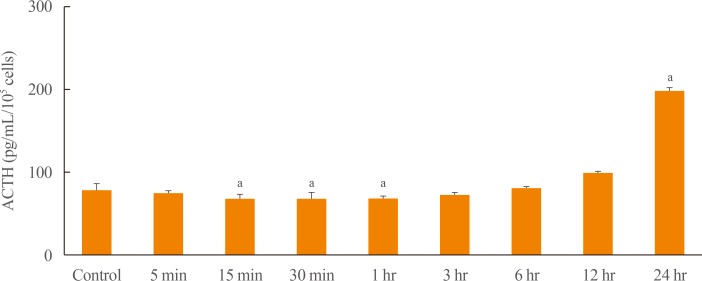
- To examine whether OXT affects ACTH secretion in AtT20 cells, AtT20 cells were treated with OXT (50 nM) for 24 hours. The level of ACTH in medium was measured at each time point (baseline, 5, 15, 30 minutes, 1, 3, 6, 12, and 24 hours) using ELISA. Fig. 4 demonstrates that OXT significantly reduced ACTH level for 1 hour in AtT20 cells compared with the control; ACTH level was significantly increased at 24 hours. These findings suggest that OXT has different effects on ACTH secretion in AtT20 cells according to time point.
- OXT treatment significantly decreases P-ERK and PCNA in AtT20 cells within a short time
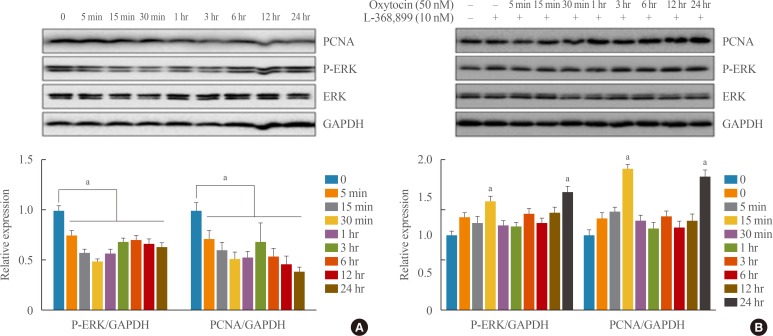
- The MAPK family is closely related to cell proliferation and apoptosis. To address whether the MAPK pathway may be involved in the effect of OXT on AtT20 cell proliferation, PCNA, ERK, p38, and JNK were assayed. Because OXT has known anti-inflammatory effects, the effect of OXT on NF-κB signaling was also investigated. As shown in Fig. 5A, after treatment with OXT (50 nM) for 24 hours, the protein levels of PCNA and P-ERK were significantly reduced compared to the control group. However, changes in P-p38, P-JNK, and P-IκBa were not detected after OXT treatment in AtT20 cells (data not shown). Moreover, as shown in Fig. 5B, OXT receptor antagonist L-368,899 significantly mitigated the reduction of PCNA and P-ERK at 15 minutes and 24 hours compared to the control group. These results indicate that OXT may blunt proliferation of AtT20 cells by reducing PCNA and P-ERK levels.
- OXT treatment also decreases P-ERK level in GH3 cells within a short time
- To determine whether the MAPK signaling pathway was also affected by OXT in GH3 cells, ERK, p38, and JNK were assayed. Moreover, the effect of OXT on NF-κB signaling in GH3 cells was investigated. After treatment with OXT (50 nM) for 24 hours, the protein level of P-ERK was significantly reduced within 5 minutes compared to the control group; this change was maintained for 12 hours. In contrast, PCNA level was significantly increased by OXT treatment (Fig. 6A). Additionally, changes in P-p38, P-JNK, and P-IκBa were not detected in GH3 cells after OXT treatment (data not shown). Fig. 6B also demonstrates that OXT receptor antagonist L-368,899 significantly recovered reduction of P-ERK level within 5 minutes compared to the control group; this change was maintained for 3 hours. However, after treatment with OXT receptor antagonist for 24 hours, the protein level of PCNA was significantly reduced compared to that of the control group. These results suggest that OXT does not have an inhibitory effect on the growth of GH3 cells, although it might affect P-ERK level in these cells.
RESULTS
- Corticotroph adenomas account for 5% to 10% of newly diagnosed pituitary tumors [28]. Although the incidence of this tumor is somewhat low, subjects with uncontrolled hypercortisolism show a 4- to 5-fold increase in overall mortality compared to the general population [1]. Hypercortisolism is associated with increased risk for a variety of comorbidities, including arterial hypertension, diabetes mellitus, and osteoporosis [12]. Therefore, early detection and appropriate treatment are essential. The primary treatment is surgery to remove the pituitary tumor [1]. However, due to high recurrence rates, patients who fail to achieve cure require additional treatment options, including radiotherapy alone or in combination with adrenalectomy [4]; both are of limited use because of high risk of subsequent hormone deficiencies [4]. Furthermore, medical therapy such as steroidogenesis inhibitors and pituitary-directed medication may be effective but does show some side effect [29]; several agents are experimental and not currently available in human clinical trials [4]. Hence, novel therapeutic targets for medical intervention are necessary in patients with CD.
- Development of pituitary tumors is a multistep process that involves the accumulation of a wide range of genetic and phenotypic alterations leading to aberrant expression of genes that regulate cell proliferation [30]. Evidence has shown that abnormal cell signaling pathways, such as MAPK cascades, Raf, and Akt/protein kinase B, and alteration in tumor suppressor genes (e.g., P53 and RB) or oncogenes (e.g., Ras-family and pituitary tumor transforming gene) might be involved in the pathogenesis of the corticotroph adenomas causing CD [30]. Moreover, cell cycle dysregulation is thought to be associated with development of pituitary tumor [2830]. Particularly, cyclin E up-regulation and p27Kip1 loss-of-function may act cooperatively on development of corticotroph adenomas [31]. Nevertheless, pathogenetic mechanisms that underlie pituitary tumorigenesis have not been fully elucidated.
- OXT exerts various biological functions [1415] and plays important roles in the physiology of reproduction, behavior, energy metabolism, and bone metabolism [7832]. Moreover, OXT has anti-oxidant, anti-inflammatory, and cardioprotective effects; OXT treatment has reduced cardiac hypertrophy, apoptosis, and fibrosis [32]. Other than conventional target organs for OXT such as uterus and mammary gland, OXT receptor is expressed in many other tissues including brain, kidney, heart, vasculature, and bone. A variety of peripheral and central actions are all mediated by only one type of OXT receptor [13], which belongs to the class I family of G-protein coupled receptors with a typical seven transmembrane domain structure [5]. For this reason, OXT and OXT receptor-associated mechanisms have been considered potential therapeutic targets in various diseases.
- The first step of this study was to identify the presence of OXT receptor in pituitary tissue. There is a paucity of data on OXT receptor expression in pituitary tumor cells, especially corticotroph adenoma cells. Breton et al. [33] showed the OXT receptor gene expression in five different pituitary cell lines, including AtT20 and GH3 cell lines, by a semi-qRT-PCR; a positive amplification signal was detected only in lactotroph-derived cell lines. However, they did not directly confirm the expression of OXT receptor in each pituitary cell using immunohistochemical or immunofluorescence stainings. In this study, OXT receptors were confirmed to be present in normal mouse pituitary gland, AtT20, and GH3 cells. Furthermore, OXT receptor and CRH receptor were co-localized in AtT20 cells, indicating that OXT influences CRH-mediated ACTH secretion in corticotroph adenomas. The aggressiveness and clinical features of corticotroph adenomas may be determined by hormonal activity, unlike in cancers. Shibasaki and Masui [34] demonstrated using a cultured pituitary adenoma of which various neuropeptides such as arginine vasopressin and OXT stimulate the secretion of POMC-derived peptides to cause Nelson's syndrome, which is a rare syndrome arising from an ACTH-secreting pituitary tumor after bilateral adrenalectomy. Additionally, OXT at physiologic concentrations was previously reported to evoke ACTH release from rat corticotrophs by increasing intracellular free calcium level mobilized from intracellular stores [35]. Therefore, OXT may affect POMC gene expression and ACTH secretion in AtT20 cells.
- In our study, OXT treatment reduced the gene expression of OXT receptor and POMC within 30 minutes in AtT20 cells, as expected. In addition, ACTH level in AtT20 cells was significantly decreased within a short time by OXT treatment compared with the control, and it increased at 24 hours. Previous studies have shown that OXT acutely increased corticosterone level in rats [36]. Conversely, chronic treatment of female rats with OXT induces a transient increase of corticosterone, followed by sustained suppression of the HPA axis [37]. Furthermore, OXT stimulates release of ACTH from the rat pituitary through arginine vasopressin receptors of the V1btype [38]. In human male volunteers, OXT infusion completely inhibited CRH-medicated ACTH secretion [39]. These findings suggest that the influence of OXT on the pituitary might differ according to treatment time, drug concentration, presence of tumor, and species.
- Growing evidence suggests a regulatory role of OXT in the growth and differentiation of various cells [1415]. Nevertheless, there are few studies on the effects of OXT on cell proliferation in pituitary tumor cell lines. OXT treatment can promote neural differentiation of adipose tissue-derived stem cells in a dose-dependent manner [40]. In the neoplastic context, OXT may act as a stimulator or inhibitor of cell proliferation in different types of tumor cells [15]. In in vitro experiments, endometrial carcinoma [18] and ovarian carcinoma cells [19] were inhibited by OXT treatment. In contrast, OXT stimulated cell growth of small cell lung cancer [17] and choriocarcinoma cells [16]. OXT reduced cell viability in AtT20 cells but not in GH3 cells; OXT receptor antagonist tended to recover the effect of OXT on AtT20 cell proliferation. To identify the underlying mechanism, the next question was whether OXT affects the MAPK signaling pathway, inflammatory process, or cell cycle, especially in AtT20 cells.
- In this study, OXT treatment for 24 hours in AtT20 cells significantly reduced the protein levels of PCNA and P-ERK; GH3 cells showed a similar pattern of change in P-ERK level to AtT20 cells but did not show a change in PCNA level. These results suggest that OXT might delay the proliferation of AtT20 cells by reducing PCNA and P-ERK levels, unlike in GH3 cells. Furthermore, although the cytotoxic effect of OXT in AtT20 cells was not definite, our findings demonstrated that OXT might alter the S or G2/M phase of the cell cycle to slow cell growth of corticotroph adenoma. However, OXT treatment does not seem to have a significant effect on p38 or JNK level in AtT20 and GH3 cells; changes in P-IκBa were not observed in either cell line.
- ERK1/2 is an important regulator because it is over-phosphorylated in all types of pituitary tumors, including ACTH-secreting pituitary tumors [41]. According to the proposed mechanism of cell proliferation, OXT can induce both transient and sustained ERK1/2 phosphorylation; while the former is related to cell proliferation, the latter is associated with anti-proliferative effects on the cell cycle [15]. Previous studies revealed that the opposite effects of OXT on cell growth were associated with different signaling pathways, including MAPK, cyclic adenosine monophosphate (cAMP)-protein kinase A, intracellular (Ca2+), and the inositol pathway [14]. Additionally, Guzzi et al. [42] proposed that localization of the OXT receptor within the cell membrane plays an important role in determining the effects of OXT on cell proliferation. When the majority of OXT receptors is localized outside lipid rafts enriched in caveolin-1, OXT has an inhibitory effect on cell growth; however, if OXT receptors are located in lipid rafts, OXT has a strong mitogenic effect [42]. Based on our findings, we speculate that OXT may have potential to inhibit cell growth as well as hormone secretion in some pituitary tumors. Therefore, further research using animal models is needed to clarify the effects of OXT-induced ERK dephosphorylation on the cell cycle in corticotroph adenomas as well as other pituitary tumors.
- In conclusion, OXT is thought to regulate the physiologic activity of AtT20 cells by controlling expression of the OXT receptor gene. OXT might have different effects on ACTH secretion in AtT20 cells according to time point. Moreover, OXT may blunt growth of AtT20 cells by inducing changes in the cell cycle or reducing PCNA and P-ERK levels. In the future, more study is required to better understand the role of OXT-OXT receptor signaling in corticotroph adenomas, which will provide insight into the potential of OXT as a new therapeutic target in patients with CD.
DISCUSSION
-
CONFLICTS OF INTEREST: No potential conflict of interest relevant to this article was reported.
-
AUTHOR CONTRIBUTIONS:
Article information
SUPPLEMENTARY MATERIALS
Supplemental Fig. S1
Supplemental Fig. S2
- 1. De Martin M, Pecori Giraldi F, Cavagnini F. Cushing's disease. Pituitary 2006;9:279–287. ArticlePubMedPDF
- 2. Patil CG, Prevedello DM, Lad SP, Vance ML, Thorner MO, Katznelson L, et al. Late recurrences of Cushing's disease after initial successful transsphenoidal surgery. J Clin Endocrinol Metab 2008;93:358–362. ArticlePubMedPDF
- 3. Sonino N, Zielezny M, Fava GA, Fallo F, Boscaro M. Risk factors and long-term outcome in pituitary-dependent Cushing's disease. J Clin Endocrinol Metab 1996;81:2647–2652. ArticlePubMed
- 4. Biller BM, Grossman AB, Stewart PM, Melmed S, Bertagna X, Bertherat J, et al. Treatment of adrenocorticotropin-dependent Cushing's syndrome: a consensus statement. J Clin Endocrinol Metab 2008;93:2454–2462. ArticlePubMedPMCPDF
- 5. Gimpl G, Fahrenholz F. The oxytocin receptor system: structure, function, and regulation. Physiol Rev 2001;81:629–683. ArticlePubMed
- 6. Carter CS. Sex differences in oxytocin and vasopressin: implications for autism spectrum disorders? Behav Brain Res 2007;176:170–186. ArticlePubMed
- 7. Qian W, Zhu T, Tang B, Yu S, Hu H, Sun W, et al. Decreased circulating levels of oxytocin in obesity and newly diagnosed type 2 diabetic patients. J Clin Endocrinol Metab 2014;99:4683–4689. ArticlePubMed
- 8. Breuil V, Panaia-Ferrari P, Fontas E, Roux C, Kolta S, Eastell R, et al. Oxytocin, a new determinant of bone mineral density in post-menopausal women: analysis of the OPUS cohort. J Clin Endocrinol Metab 2014;99:E634–E641. ArticlePubMedPDF
- 9. Green L, Fein D, Modahl C, Feinstein C, Waterhouse L, Morris M. Oxytocin and autistic disorder: alterations in peptide forms. Biol Psychiatry 2001;50:609–613. ArticlePubMed
- 10. Kiss A, Mikkelsen JD. Oxytocin: anatomy and functional assignments. A minireview. Endocr Regul 2005;39:97–105. PubMed
- 11. Yu Q, Ji R, Gao X, Fu J, Guo W, Song X, et al. Oxytocin is expressed by both intrinsic sensory and secretomotor neurons in the enteric nervous system of guinea pig. Cell Tissue Res 2011;344:227–237. ArticlePubMedPDF
- 12. Amico JA, Tenicela R, Johnston J, Robinson AG. A time-dependent peak of oxytocin exists in cerebrospinal fluid but not in plasma of humans. J Clin Endocrinol Metab 1983;57:947–951. ArticlePubMedPDF
- 13. Zingg HH, Laporte SA. The oxytocin receptor. Trends Endocrinol Metab 2003;14:222–227. ArticlePubMed
- 14. Cassoni P, Sapino A, Marrocco T, Chini B, Bussolati G. Oxytocin and oxytocin receptors in cancer cells and proliferation. J Neuroendocrinol 2004;16:362–364. ArticlePubMed
- 15. Imanieh MH, Bagheri F, Alizadeh AM, Ashkani-Esfahani S. Oxytocin has therapeutic effects on cancer, a hypothesis. Eur J Pharmacol 2014;741:112–123. ArticlePubMed
- 16. Cassoni P, Sapino A, Munaron L, Deaglio S, Chini B, Graziani A, et al. Activation of functional oxytocin receptors stimulates cell proliferation in human trophoblast and choriocarcinoma cell lines. Endocrinology 2001;142:1130–1136. ArticlePubMedPDF
- 17. Pequeux C, Breton C, Hendrick JC, Hagelstein MT, Martens H, Winkler R, et al. Oxytocin synthesis and oxytocin receptor expression by cell lines of human small cell carcinoma of the lung stimulate tumor growth through autocrine/paracrine signaling. Cancer Res 2002;62:4623–4629. PubMed
- 18. Cassoni P, Fulcheri E, Carcangiu ML, Stella A, Deaglio S, Bussolati G. Oxytocin receptors in human adenocarcinomas of the endometrium: presence and biological significance. J Pathol 2000;190:470–477. ArticlePubMed
- 19. Morita T, Shibata K, Kikkawa F, Kajiyama H, Ino K, Mizutani S. Oxytocin inhibits the progression of human ovarian carcinoma cells in vitro and in vivo. Int J Cancer 2004;109:525–532. ArticlePubMed
- 20. Petersson M. Opposite effects of oxytocin on proliferation of osteosarcoma cell lines. Regul Pept 2008;150:50–54. ArticlePubMed
- 21. Taylor AH, Ang VT, Jenkins JS, Silverlight JJ, Coombes RC, Luqmani YA. Interaction of vasopressin and oxytocin with human breast carcinoma cells. Cancer Res 1990;50:7882–7886. PubMed
- 22. Cassoni P, Sapino A, Fortunati N, Munaron L, Chini B, Bussolati G. Oxytocin inhibits the proliferation of MDA-MB231 human breast-cancer cells via cyclic adenosine monophosphate and protein kinase A. Int J Cancer 1997;72:340–344. ArticlePubMed
- 23. Cassoni P, Sapino A, Stella A, Fortunati N, Bussolati G. Presence and significance of oxytocin receptors in human neuroblastomas and glial tumors. Int J Cancer 1998;77:695–700. ArticlePubMed
- 24. Bakos J, Strbak V, Ratulovska N, Bacova Z. Effect of oxytocin on neuroblastoma cell viability and growth. Cell Mol Neurobiol 2012;32:891–896. ArticlePubMedPDF
- 25. Whittington K, Connors B, King K, Assinder S, Hogarth K, Nicholson H. The effect of oxytocin on cell proliferation in the human prostate is modulated by gonadal steroids: implications for benign prostatic hyperplasia and carcinoma of the prostate. Prostate 2007;67:1132–1142. ArticlePubMed
- 26. Liu JW, Ben-Jonathan N. Prolactin-releasing activity of neurohypophysial hormones: structure-function relationship. Endocrinology 1994;134:114–118. ArticlePubMedPDF
- 27. Gonzalez-Iglesias AE, Fletcher PA, Arias-Cristancho JA, Cristancho-Gordo R, Helena CV, Bertram R, et al. Direct stimulatory effects of oxytocin in female rat gonadotrophs and somatotrophs in vitro: comparison with lactotrophs. Endocrinology 2015;156:600–612. ArticlePubMedPDF
- 28. Asa SL, Ezzat S. The pathogenesis of pituitary tumors. Annu Rev Pathol 2009;4:97–126. ArticlePubMed
- 29. Langlois F, McCartney S, Fleseriu M. Recent progress in the medical therapy of pituitary tumors. Endocrinol Metab (Seoul) 2017;32:162–170. ArticlePubMedPMC
- 30. Dworakowska D, Grossman AB. The molecular pathogenesis of corticotroph tumours. Eur J Clin Invest 2012;42:665–676. ArticlePubMed
- 31. Roussel-Gervais A, Bilodeau S, Vallette S, Berthelet F, Lacroix A, Figarella-Branger D, et al. Cooperation between cyclin E and p27(Kip1) in pituitary tumorigenesis. Mol Endocrinol 2010;24:1835–1845. ArticlePubMedPMCPDF
- 32. Jankowski M, Broderick TL, Gutkowska J. Oxytocin and cardioprotection in diabetes and obesity. BMC Endocr Disord 2016;16:34. ArticlePubMedPMCPDF
- 33. Breton C, Pechoux C, Morel G, Zingg HH. Oxytocin receptor messenger ribonucleic acid: characterization, regulation, and cellular localization in the rat pituitary gland. Endocrinology 1995;136:2928–2936. ArticlePubMedPDF
- 34. Shibasaki T, Masui H. Effects of various neuropeptides on the secretion of proopiomelanocortin-derived peptides by a cultured pituitary adenoma causing Nelson's syndrome. J Clin Endocrinol Metab 1982;55:872–876. ArticlePubMedPDF
- 35. Link H, Dayanithi G, Fohr KJ, Gratzl M. Oxytocin at physiological concentrations evokes adrenocorticotropin (ACTH) release from corticotrophs by increasing intracellular free calcium mobilized mainly from intracellular stores. Oxytocin displays synergistic or additive effects on ACTH-releasing factor or arginine vasopressin-induced ACTH secretion, respectively. Endocrinology 1992;130:2183–2191. ArticlePubMed
- 36. Gibbs DM. Dissociation of oxytocin, vasopressin and corticotropin secretion during different types of stress. Life Sci 1984;35:487–491. ArticlePubMed
- 37. Petersson M, Hulting AL, Uvnas-Moberg K. Oxytocin causes a sustained decrease in plasma levels of corticosterone in rats. Neurosci Lett 1999;264:41–44. ArticlePubMed
- 38. Nakamura K, Fujiwara Y, Mizutani R, Sanbe A, Miyauchi N, Hiroyama M, et al. Effects of vasopressin V1b receptor deficiency on adrenocorticotropin release from anterior pituitary cells in response to oxytocin stimulation. Endocrinology 2008;149:4883–4891. ArticlePubMedPDF
- 39. Page SR, Ang VT, Jackson R, White A, Nussey SS, Jenkins JS. The effect of oxytocin infusion on adenohypophyseal function in man. Clin Endocrinol (Oxf) 1990;32:307–313. ArticlePubMed
- 40. Jafarzadeh N, Javeri A, Khaleghi M, Taha MF. Oxytocin improves proliferation and neural differentiation of adipose tissue-derived stem cells. Neurosci Lett 2014;564:105–110. ArticlePubMed
- 41. Dworakowska D, Wlodek E, Leontiou CA, Igreja S, Cakir M, Teng M, et al. Activation of RAF/MEK/ERK and PI3K/AKT/mTOR pathways in pituitary adenomas and their effects on downstream effectors. Endocr Relat Cancer 2009;16:1329–1338. ArticlePubMed
- 42. Guzzi F, Zanchetta D, Cassoni P, Guzzi V, Francolini M, Parenti M, et al. Localization of the human oxytocin receptor in caveolin-1 enriched domains turns the receptor-mediated inhibition of cell growth into a proliferative response. Oncogene 2002;21:1658–1667. ArticlePubMedPDF
References
Expression of oxytocin (OXT) receptor in normal mouse pituitary gland and immunofluorescence staining of OXT receptor in AtT20 and GH3 cells. (A, B) Immunohistochemical staining shows that normal mouse pituitary gland was stained positively for OXT receptor (n=2, ×40 and ×200, respectively). (C) It indicates positive control for OXT receptor staining in uterine endometrial tissue (n=3, ×200). (D) It indicates immunofluorescence co-staining of OXT receptor (red color) and corticotropin-releasing hormone receptor (green color) in AtT20 cells (magnification, ×630). (E, F) These panels show the staining for OXT receptor (green color) in AtT20 and GH3 cells (×400), respectively. AL, anterior lobe.
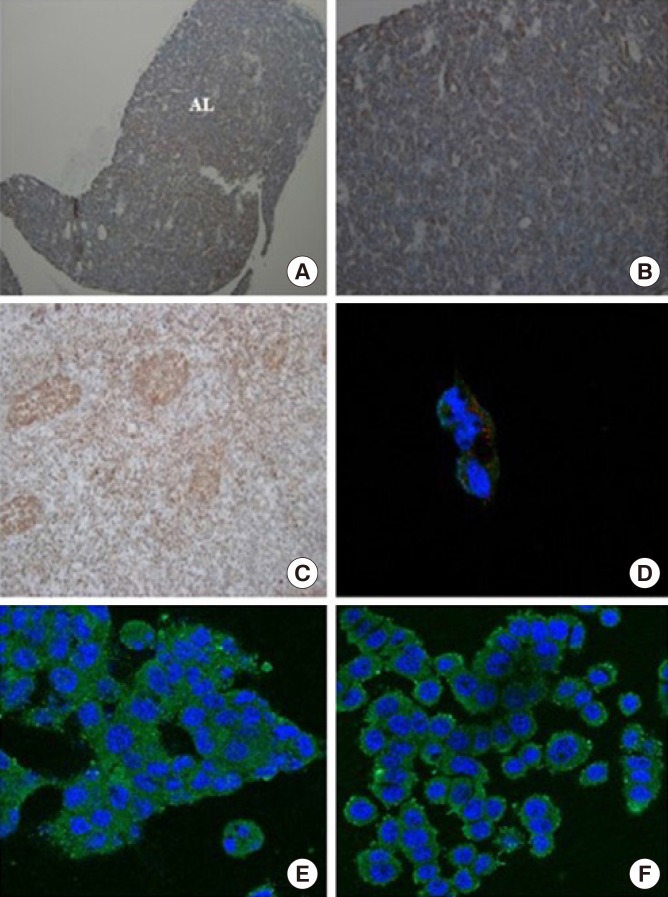
Cell cycle analysis in AtT20 cells. AtT20 cells were treated with oxytocin (OXT) and/or OXT receptor antagonist L-368,899 for 6 or 24 hours, and cells were stained with propidium iodide. DNA contents were analyzed by flow cytometer to assess cell cycle phases (n=3). (A) Flow cytometry of AtT20 cells treated with OXT and/or OXT receptor antagonist for 6 or 24 hours. (B, C) Representative histogram data of the cell cycle analysis of AtT20 cells treated with OXT and/or OXT receptor antagonist for 6 or 24 hours. PI-A, Propidium iodide-Area. aP<0.05 vs. control group; bP<0.05 vs. L-368,899 treatment group.
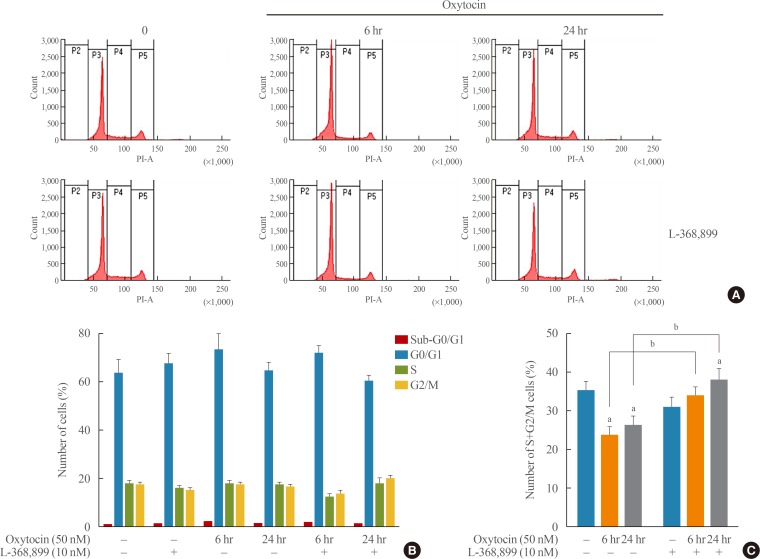
Effects of oxytocin (OXT) on gene expression of (A) OXT receptors and (B) pro-opiomelanocortin (POMC) in AtT20 cells. AtT20 cells were exposed to OXT (50 nM) for 30 minutes, 1, 3, 6, 12, and 24 hours. mRNA levels of POMC and OXT receptor genes were estimated at each time point using quantitative real-time polymerase chain reaction. Data are presented as mean±standard deviation (n=4 to 6). aP<0.05 vs. control group.
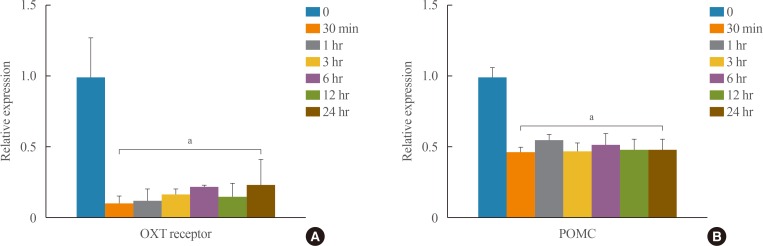
Effects of oxytocin (OXT) treatment on adrenocorticotropic hormone (ACTH) secretion in AtT20 cells. To determine ACTH level, conditioned medium was harvested and analyzed by enzyme-linked immunosorbent assay. X-axis indicates control and OXT treatment groups according to time point. Y-axis indicates ACTH level per 105 cells. Data are presented as mean±standard error of the mean (n=3). aP<0.05 vs. control group.
Effects of oxytocin (OXT) on proliferating cell nuclear antigen (PCNA) and extracellular-signal-regulated kinase 1/2 (ERK1/2) in AtT20 cells. AtT20 cells were incubated with (A) 50 nM OXT and/or (B) 10 nM OXT receptor antagonist L-368,899 for 24 hours, and protein levels of PCNA and ERK1/2 in cells were examined by Western blot analysis. Data are presented as mean±standard error of the mean (n=3). P-ERK, phosphorylated extracellular-signal-regulated kinase; GAPDH, glyceraldehyde 3-phosphate dehydrogenase. aP<0.05 vs. control group.
Effects of oxytocin (OXT) on proliferating cell nuclear antigen (PCNA) and extracellular-signal-regulated kinase 1/2 (ERK1/2) in GH3 cells. GH3 cells were incubated with (A) 50 nM OXT and/or (B) 10 nM OXT receptor antagonist L-368,899 for 24 hours, and protein levels of PCNA and ERK1/2 in cells were examined by Western blot analysis. Data are presented as mean±standard error of the mean (n=3). P-ERK, phosphorylated extracellular-signal-regulated kinase; GAPDH, glyceraldehyde 3-phosphate dehydrogenase. aP<0.05 vs. control group.
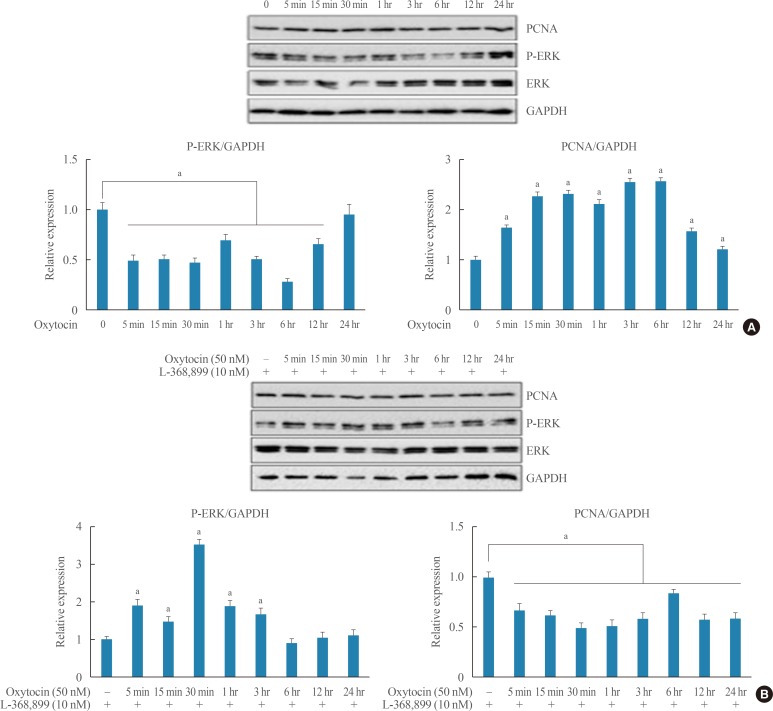
Figure & Data
References
Citations
- Increased proliferation and neuronal fate in prairie vole brain progenitor cells cultured in vitro: effects by social exposure and sexual dimorphism
Daniela Ávila-González, Italo Romero-Morales, Lizette Caro, Alejandro Martínez-Juárez, Larry J. Young, Francisco Camacho-Barrios, Omar Martínez-Alarcón, Analía E. Castro, Raúl G. Paredes, Néstor F. Díaz, Wendy Portillo
Biology of Sex Differences.2023;[Epub] CrossRef - Anterior pituitary gland synthesises dopamine from l‐3,4‐dihydroxyphenylalanine (l‐dopa)
Santiago Jordi Orrillo, Nataly de Dios, Antonela Sofía Asad, Fernanda De Fino, Mercedes Imsen, Ana Clara Romero, Sandra Zárate, Jimena Ferraris, Daniel Pisera
Journal of Neuroendocrinology.2020;[Epub] CrossRef
 PubReader
 ePub Link
 Cite
Cite