Articles
- Page Path
- HOME > Endocrinol Metab > Volume 29(3); 2014 > Article
-
Original ArticleEndocrine Research Ghrelin Inhibits Oligodendrocyte Cell Death by Attenuating Microglial Activation
- Jee Youn Lee1, Tae Young Yune1,2
-
Endocrinology and Metabolism 2014;29(3):371-378.
DOI: https://doi.org/10.3803/EnM.2014.29.3.371
Published online: September 25, 2014
1Age-Related and Brain Diseases Research Center, Kyung Hee University School of Medicine, Seoul, Korea.
2Department of Biochemistry and Molecular Biology, Kyung Hee University School of Medicine, Seoul, Korea.
- Corresponding author: Tae Young Yune. Department of Biochemistry and Molecular Biology, Kyung Hee University School of Medicine, 26 Kyungheedae-ro, Dongdaemun-gu, Seoul 130-701, Korea. Tel: +82-2-961-0968, Fax: +82-2-969-6343, tyune@khu.ac.kr
• Received: December 5, 2013 • Revised: January 16, 2014 • Accepted: February 3, 2014
Copyright © 2014 Korean Endocrine Society
This is an Open Access article distributed under the terms of the Creative Commons Attribution Non-Commercial License (http://creativecommons.org/licenses/by-nc/3.0/) which permits unrestricted non-commercial use, distribution, and reproduction in any medium, provided the original work is properly cited.
ABSTRACT
-
Background
- Recently, we reported the antiapoptotic effect of ghrelin in spinal cord injury-induced apoptotic cell death of oligodendrocytes. However, how ghrelin inhibits oligodendrocytes apoptosis, is still unknown. Therefore, in the present study, we examined whether ghrelin inhibits microglia activation and thereby inhibits oligodendrocyte apoptosis.
-
Methods
- Using total cell extracts prepared from BV-2 cells activated by lipopolysaccharide (LPS) with or without ghrelin, the levels of p-p38 phosphor-p38 mitogen-activated protein kinase (p-p38MAPK), phospho-c-Jun N-terminal kinase (pJNK), p-c-Jun, and pro-nerve growth factor (proNGF) were examined by Western blot analysis. Reactive oxygen species (ROS) production was investigated by using dichlorodihydrofluorescein diacetate. To examine the effect of ghrelin on oligodendrocyte cell death, oligodendrocytes were cocultured in transwell chambers of 24-well plates with LPS-stimulated BV-2 cells. After 48 hours incubation, 3-(4,5-dimethylthiazol-2-yl)-2,5-diphenyltetrazolium bromide assay and terminal deoxynucleotidyl transferase 2'-deoxyuridine, 5'-triphosphate nick end labeling staining were assessed.
-
Results
- Ghrelin treatment significantly decreased levels of p-p38MAPK, p-JNK, p-c-Jun, and proNGF in LPS-stimulated BV-2 cells. ROS production increased in LPS-stimulated BV-2 cells was also significantly inhibited by ghrelin treatment. In addition, ghrelin significantly inhibited oligodendrocyte cell death when cocultured with LPS-stimulated BV-2 cells.
-
Conclusion
- Ghrelin inhibits oligodendrocyte cell death by decreasing proNGF and ROS production as well as p38MAPK and JNK activation in activated microglia as an anti-inflammatory hormone.
- After traumatic spinal cord injury (SCI), apoptotic cell death of oligodendrocytes occurs in the white matter along fiber tracts undergoing Wallerian degeneration [1]. The apoptosis of oligodendrocytes ultimately contributes to chronic demyelination and spinal cord dysfunction [2,3,4].
- As a 28 amino-acid gastric hormone, ghrelin has multifunctional roles in appetite, adiposity, energy balance, gastric motility, and acid secretion [5,6,7,8,9]. The neuroprotective effect of ghrelin has also been shown in several animal models of neuronal injury such as ischemia, Parkinson disease and Alzheimer disease [10,11,12,13]. In particular, we reported that SCI-induced apoptotic cell death of oligodendrocytes is inhibited by ghrelin treatment [14]. Oligodendrocytes are very sensitive to oxidative stress, apparently due to a low capacity for antioxidant defense and intrinsic risk factors such as high iron content [15]. In addition, our previous report showed that pro-nerve growth factor (proNGF) production after SCI via activation of p38 mitogen activated protein kinase (p38MAPK) in microglia is involved in oligodendrocyte cell death [16]. Furthermore, the anti-inflammatory effect of ghrelin was shown in several animal models such as arthritis, sepsis, endotoxemia, and multiple sclerosis [17,18,19,20].
- Here, we examined the effect of ghrelin as an anti-inflammatory hormone on p38MAPK and c-Jun N-terminal kinase (JNK) activation as well as proNGF and reactive oxygen species (ROS) production in BV-2 microglia cells activated by lipopolysaccharides (LPSs). We also examined the effect of ghrelin on cell death of oligodendrocytes cocultured with LPS-stimulated BV-2 cells.
INTRODUCTION
- BV-2 microglial cell culture
- The BV-2 murine microglial cell line [21] was cultured in Dulbecco's Modified Eagle's Medium supplemented with 5% fetal bovine serum and 100 units/mL penicillin and 100 µg/mL streptomycin at 37℃ in a humidified incubator under 5% CO2. Prior to each experiment, cells were plated onto 6-well (5×10⁵ cells/well) or 24-well (1×10⁵ cells/well) plates. The next day, cells were treated with LPS (100 ng/mL; Escherichia coli 0111:B4, Sigma, St. Louis, MO, USA) in the presence or absence of ghrelin (1, 10, 100, or 1,000 nM). Acylated ghrelin (Peptides International, Louisville, KT, USA) was dissolved in PBS and treated for 30 minutes before LPS treatment.
- Oligodendrocyte culture
- Primary oligodendrocyte cultures were prepared from rat pup (postnatal day 1) brains according to the previously reported method [22]. Isolated oligodendrocytes (6×10⁴ cells/well; purity, >95%) were grown on 24-well culture plates or glass coverslips coated with poly-D-lysine (10 µg/mL, Millipore, Billerica, MA, USA) with oligodendrocyte differentiation medium containing Basal Medium Eagle/F12 (1:1), transferrin (100 µg/mL), putrescine (20 µg/mL), progesterone (12.8 ng/mL), selenium (10.4 ng/mL), insulin (25 µg/mL), thyroxine (0.8 µg/mL), glucose (6 mg/mL), and glutamine (6.6 mM). Half of media was changed every 2 days until cells were differentiated into mature oligodendrocytes (myelin basic protein, MBP-positive) for 4 to 5 days. For oligodendrocyte/microglia cocultures, microglia (1×10⁵ cells per well) were grown on porous upper inserts of transwell chambers (3 µm diameter pores, BD Biosciences, San Jose, CA, USA) in 24-well plates. After treatment with LPS (100 ng/mL, Millipore) for 30 minutes, with or without ghrelin (1,000 nM), the inserts were washed and placed above oligodendrocytes (6 days in culture) growing on a coverslip in the bottom well of the transwell chambers, allowing diffusion of soluble molecules. Under this culture condition, oligodendrocytes were never exposed to LPS and ghrelin. Oligodendrocyte culture was then processed for terminal deoxynucleotidyl transferase-mediated deoxyuridine triphosphate-biotin nick end labeling (TUNEL) and for MTT assay.
- Measurement of ROS
- The production of ROS was measured fluorometrically using ROS-specific fluorescence dye, dichlorodihydrofluorescein diacetate (DCF-DA, Molecular Probes, Eugene, OR, USA), as described previously [23]. After LPS treatment, DCF-DA (10 µM, final concentration) were added to cells and cellular fluorescence (at 1 hour after treatment) was imaged using an Olympus fluorescence microscope with Metamorph software (Rhoper Scientific, Tucson, AZ, USA).
- Assessment of cytotoxicity
- To assess cell cytotoxicity, the tetrazolium (MTT) assay was carried out as previously described [24]. In brief, MTT solution (100 µL/well; 5 mg/mL in PBS) was added to the oligodendrocytes culture plate, and incubated for 4 hours. After removing the media, dimethyl sulfoxide was added and incubated for 30 minutes at 37℃ to dissolve the formazan salt. Quantification was then carried out with a microplate reader (Molecular Devices, Sunnyvale, CA, USA) at 595 nM. Oligodendrocyte survival was expressed as a percentage relative to that in the vehicle-treated control (100%).Values are expressed as mean±SD of three independent experiments.
- Immunocytochemistry and TUNEL
- Cells were seeded on poly-D-lysine-coated glass cover slips (1×10⁵ cells in 24-well plates) and treated as described above. Cells were fixed with 4% paraformaldehyde for 10 minutes and washed three times with PBS. The fixed oligodendrocytes were processed for immunocytochemistry with MBP antibody (1:1,000, Millipore) as previously described [24]. TUNEL staining was performed according to the protocol for cell culture using the apoptosis detection kit (Millipore). TUNEL- and MBP-positive cells were visualized with a microscope at 200× magnification and analyzed by counting the number of MBP/TUNEL positive cells per field of each coverslip. Five fields of each coverslip were counted and averaged. Cell images were captured with an Olympus microscope with Metamorph software.
- Western blot analysis
- Cells were homogenized in a lysis buffer containing 1% nonidet P-40, 20 mM Tris, pH 8.0, 137 mM NaCl, 0.5 mM ethylenediaminetetraacetic, 10% glycerol, 10 mM Na2P2O7, 10 mM NaF, 1 µg/mL aprotinin, 10 µg/mL leupeptin, 1 mM vanadate, and 1 mM phenylmethylsulfonyl fluoride. Cell homogenates were incubated for 20 minutes at 4℃, and centrifuged at 25,000 ×g for 30 minutes at 4℃. The protein level of the supernatant was determined using the BCA assay (Pierce, Rockford, IL, USA). Protein sample (50 µg) was separated by sodium dodecyl sulphate-polyacrylamide gel electrophoresis and transferred to nitrocellulose membranes (Millipore) by electrophoresis. The membranes were blocked with 5% nonfat skim milk in Tris-buffered saline containing 0.1% tween 20 for 1 hour at room temperature and then incubated with polyclonal antibodies against p38MAPK (1:1,000; Cell Signaling Technology, Danvers, MA, USA), phosphor-p38MAPK (p-p38MAPK; 1:1,000, Cell Signaling Technology), phospho-JNK (p-JNK; 1:1,000, Cell Signaling Technology), JNK (1:1,000, Cell Signaling Technology), p-c-Jun (1:1,000, Cell Signaling Technology), c-Jun (1:500, Santa Cruz Biotechnology, Santa Cruz, CA, USA), and proNGF (1:1,000, Alomone Labs, Jerusalem, Israel). The primary antibodies were detected with a horseradish peroxidase-conjugated goat antirabbit secondary antibody (Jackson ImmunoResearch Inc., West Grove, PA, USA). Immunoreactive bands were visualized by chemiluminescence using Thermo Scientifi SuperSigna West Pico Chemiluminescent Substrate (Pierce). β-Tubulin (1:10,000, Sigma) was used as an internal control. Experiments were repeated three times and the values obtained for the relative intensity were subjected to statistical analysis. The gels shown in figures are representative of results from three separate experiments.
- Statistical analysis
- Values are expressed as mean±SD. Multiple comparisons between groups were performed with one-way analysis of variances. Tukey's multiple comparison was used as a post hoc analysis. Statistical significance was accepted with P<0.05. Statistical analyses were performed using SPSS version 15.0 (SPSS Inc., Chicago, IL, USA).
METHODS
- Ghrelin inhibits p38MAPK and JNK activation in BV-2 cells stimulated by LPS
- Both p38MAPK and JNK activation are known to mediate inflammatory responses in microglia. LPS is also known to promote the activation of BV-2 cells that exhibit phenotypic and functional properties of activated microglial cells in vivo. Thus, we examined the effect of ghrelin on microglia activation in BV-2 cell stimulated with LPS (100 ng/mL) in the presence and absence of ghrelin (1, 10, 100, and 1,000 nM). Western blot and quantitative analyses show that levels of p-p38MAPK, p-JNK, and p-c-Jun, which were increased by LPS treatment, were significantly decreased by ghrelin in a dosage-dependent manner (Fig. 1). These results suggest that ghrelin inhibits microglia activation by LPS.
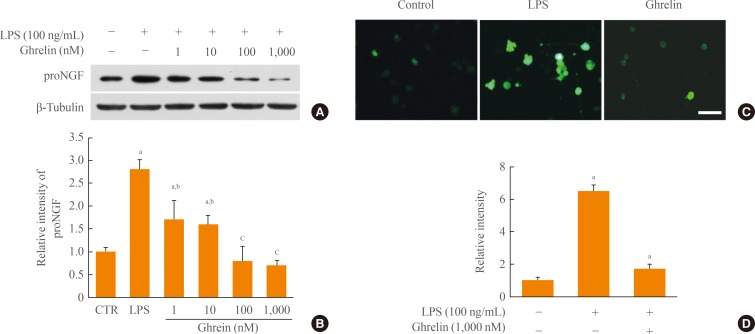
- Ghrelin inhibits proNGF and ROS production in LPS-induced BV-2 cells
- ProNGF is induced and plays the role of a death ligand in apoptosis of oligodendrocytes after SCI. In addition, we reported that proNGF production is dependent on p38MAPK activation in microglia. Thus, we examined the effect of ghrelin on proNGF production in LPS-induced BV-2 cells. As shown in Fig. 2A, B, proNGF production was increased by LPS, although an endogenous level of proNGF was produced in BV-2 control cells not treated with LPS. However, ghrelin treatment significantly inhibited proNGF production dose-dependently in LPS-stimulated BV-2 cells. It is also showed that JNK activation in microglia induces ROS production, leading to oxidative stress in BV-2 cells treated with fluoride. Thus, we examined whether ghrelin inhibits ROS production in LPS-activated BV-2 cells using the ROS-specific fluorescent dye, DCF-DA. Data show that the level of ROS was increased at 12 hours after LPS treatment, whereas ghrelin treatment (1,000 nM) significantly decreased ROS level induced by LPS (Fig. 2C, D).
- Ghrelin inhibits cell death of oligodendrocytes cocultured with LPS-stimulated BV-2 cells
- Since our data show that ghrelin inhibited the production of proNGF and ROS, which are known to lead to cell death of oligodendrocytes in experimental autoimmune encephalomyelitis and in SCI animal model, we next examined whether ghrelin protects cell death of oligodendrocytes cocultured with LPS-stimulated BV-2 cells by inhibiting proNGF and ROS production. After BV-2 cells were stimulated by LPS (100 ng/mL) with or without ghrelin (1,000 nM), primary oligodendrocytes were cocultured with BV-2 cells in transwell chambers (24-well plates). After 48 hours incubation, MTT assay and TUNEL staining were performed. When MTT assay was expressed as an oligodendrocyte cell survival (%), data show that LPS treatment significantly reduced cell survival of oligodendrocytes as compared with control cells not treated with LPS (Fig. 3A). However, ghrelin treatment significantly increased cell survival of oligodendrocytes when compared with LPS-treated control cellsI (LPS, 56%±3.4%; LPS+ghrelin, 79%±5.0%; P<0.05). In addition, quantitative analysis of TUNEL-positive cells also show that ghrelin treatment significantly reduced oligodendrocyte cell death induced by LPS treatment (LPS, 33±4.5 cells; LPS+ghrelin, 12.5±3.3 cells; P<0.05) (Fig. 3B).
RESULTS
- In this study, we demonstrated that ghrelin as an anti-inflammatory hormone inhibits microglia activation, thereby attenuating oligodendrocyte cell death. Ghrelin treatment significantly inhibited LPS-induced p38MAPK and JNK activation in BV-2 cells. LPS-induced proNGF and ROS production in BV-2 cells was also significantly attenuated by ghrelin treatment, thereby reducing oligodendrocyte cell death in coculture with LPS-stimulated BV-2 cells.
- Microglia are the resident macrophages in the central nervous system and play an important role in immune responses in the central nervous system. Previously we reported that minocycline treatment alleviated apoptosis of oligodendrocytes at least in part by inhibiting proNGF production in activated microglia after SCI [16]. In addition, we demonstrated that proNGF production was inhibited by treatment with SB203580, an inhibitor of p38MAPK, suggesting that production of proNGF is mediated via p38MAPK activation in microglia [16]. In this study, proNGF production in BV-2 cells activated by LPS was inhibited by ghrelin (Fig. 2A, B) and thereby oligodendrocyte cell death was significantly attenuated by ghrelin in coculture with LPS-stimulated BV-2 cells (Fig. 3). Ghrelin also inhibited p38MAPK activation in LPS-stimulated BV-2 cells (Fig. 1). Our data are in agreement with previous reports showing that proNGF induces cell death of oligodendrocytes after SCI [16,25,26]. Furthermore, these results suggest that ghrelin inhibited oligodendrocyte cell death by alleviating microglia activation in in vitro and can explain in part the underlying neuroprotective mechanism by ghrelin after SCI previously reported by our group [14]. Recently, the inhibitory effects of ghrelin on microglial activation in several animal models have been reported. For example, ghrelin inhibits neuronal apoptosis by inhibiting microglial activation in 1-methyl-4-phenyl-1,2,3,6-tetrahydropyridine-induced Parkinson's disease animal model [11]. In addition, ghrelin significantly reduces the level of proinflammatory cytokines such as tumor necrosis factor-α, interleukin (IL)-1β, and IL-6 in spinal cord microglia in experimental autoimmune encephalomyelitis, a representative animal model of multiple sclerosis [20]. Furthermore, our preliminary results show that ghrelin treatment significantly decreased the number of activated microglia after SCI (data not shown).
- The endocrine activity of ghrelin is known to be mediated by growth hormone secretagogue receptor1a (GHS-R1a), a G protein-coupled receptor [27,28]. However, it has been reported that microglia do not express GHS-R1a in brain, spinal cord, and primary microglia cultures [11,14]. In addition, GHS-R1a was not expressed in BV-2 cells when we determined the expression of GHS-R1a by RT-PCR and Western blot analysis (data not shown). Thus, at least in BV-2 cells, ghrelin may inhibit microglia activation via a ghrelin receptor-independent pathway in this study. The underlying mechanism how ghrelin inhibits microglia activation should be further studied.
- Several studies have shown that LPS induces ROS production, including nitric oxide, via a mechanism mediated by the JNK pathway in BV-2 microglia cells [29,30]. Our data show that LPS induces JNK activation and ROS production in BV-2 cells as in previous reports (Figs. 1, 2B). In addition, ghrelin treatment significantly inhibited LPS-induced JNK activation and ROS production in BV-2 cells. It is also known that MAPK families, including JNK responsive to stress stimuli, are involved in the production of ROS [31]. Furthermore, it has been reported that nicotinamide adenine dinucleotide phosphate (NADPH) oxidase is involved in fluoride-induced oxidative stress in BV-2 cells [32]. Thus our data suggest that ghrelin may inhibit ROS production by attenuating JNK activation in LPS-stimulated BV-2 cells, although a direct linkage between JNK and ROS by using a JNK inhibitor was not determined in this study. In addition, whether NADPH oxidase, as a source of ROS, is involved in the inhibition of LPS-induced ROS production by ghrelin should be studied.
- Oligodendrocyte cell death contributes to demyelination, resulting in abnormal conductance of action potential in various pathological conditions such as a multiple sclerosis and SCI. In addition, microglia activation followed by inflammation and production of proNGF and ROS can contribute to oligodendrocyte cell death [16,33,34,35]. Taken together, ghrelin inhibited microglia activation, and the associated attenuation of ROS and proNGF production in this study, suggests the possibility of ghrelin as an anti-inflammatory therapeutic hormone for various pathological diseases accompanying oligodendrocyte cell death and microglia activation followed by inflammation.
DISCUSSION
-
Acknowledgements
- This research was supported by a grant of the Korea Health Technology R&D Project through the Korea Health Industry Development Institute (KHIDI), funded by the Ministry of Health and Welfare, Republic of Korea (grant number: HI13 C14600000).
ACKNOWLEDGMENTS
- 1. Shuman SL, Bresnahan JC, Beattie MS. Apoptosis of microglia and oligodendrocytes after spinal cord contusion in rats. J Neurosci Res 1997;50:798–808. ArticlePubMed
- 2. Li YQ, Jay V, Wong CS. Oligodendrocytes in the adult rat spinal cord undergo radiation-induced apoptosis. Cancer Res 1996;56:5417–5422. PubMed
- 3. Beattie MS, Farooqui AA, Bresnahan JC. Review of current evidence for apoptosis after spinal cord injury. J Neurotrauma 2000;17:915–925. ArticlePubMed
- 4. Warden P, Bamber NI, Li H, Esposito A, Ahmad KA, Hsu CY, Xu XM. Delayed glial cell death following wallerian degeneration in white matter tracts after spinal cord dorsal column cordotomy in adult rats. Exp Neurol 2001;168:213–224. ArticlePubMed
- 5. Kojima M, Hosoda H, Date Y, Nakazato M, Matsuo H, Kangawa K. Ghrelin is a growth-hormone-releasing acylated peptide from stomach. Nature 1999;402:656–660. ArticlePubMedPDF
- 6. Date Y, Kojima M, Hosoda H, Sawaguchi A, Mondal MS, Suganuma T, Matsukura S, Kangawa K, Nakazato M. Ghrelin, a novel growth hormone-releasing acylated peptide, is synthesized in a distinct endocrine cell type in the gastrointestinal tracts of rats and humans. Endocrinology 2000;141:4255–4261. ArticlePubMedPDF
- 7. Tschop M, Smiley DL, Heiman ML. Ghrelin induces adiposity in rodents. Nature 2000;407:908–913. ArticlePubMedPDF
- 8. Inui A. Ghrelin: an orexigenic and somatotrophic signal from the stomach. Nat Rev Neurosci 2001;2:551–560. ArticlePubMedPDF
- 9. Nakazato M, Murakami N, Date Y, Kojima M, Matsuo H, Kangawa K, Matsukura S. A role for ghrelin in the central regulation of feeding. Nature 2001;409:194–198. ArticlePubMedPDF
- 10. Miao Y, Xia Q, Hou Z, Zheng Y, Pan H, Zhu S. Ghrelin protects cortical neuron against focal ischemia/reperfusion in rats. Biochem Biophys Res Commun 2007;359:795–800. ArticlePubMed
- 11. Moon M, Kim HG, Hwang L, Seo JH, Kim S, Hwang S, Kim S, Lee D, Chung H, Oh MS, Lee KT, Park S. Neuroprotective effect of ghrelin in the 1-methyl-4-phenyl-1, 2,3,6-tetrahydropyridine mouse model of Parkinson's disease by blocking microglial activation. Neurotox Res 2009;15:332–347. ArticlePubMedPDF
- 12. Jiang H, Li LJ, Wang J, Xie JX. Ghrelin antagonizes MPTP-induced neurotoxicity to the dopaminergic neurons in mouse substantia nigra. Exp Neurol 2008;212:532–537. ArticlePubMed
- 13. Moon M, Choi JG, Nam DW, Hong HS, Choi YJ, Oh MS, Mook-Jung I. Ghrelin ameliorates cognitive dysfunction and neurodegeneration in intrahippocampal amyloid-beta1-42 oligomer-injected mice. J Alzheimers Dis 2011;23:147–159. ArticlePubMed
- 14. Lee JY, Chung H, Yoo YS, Oh YJ, Oh TH, Park S, Yune TY. Inhibition of apoptotic cell death by ghrelin improves functional recovery after spinal cord injury. Endocrinology 2010;151:3815–3826. ArticlePubMedPDF
- 15. Juurlink BH, Paterson PG. Review of oxidative stress in brain and spinal cord injury: suggestions for pharmacological and nutritional management strategies. J Spinal Cord Med 1998;21:309–334. ArticlePubMed
- 16. Yune TY, Lee JY, Jung GY, Kim SJ, Jiang MH, Kim YC, Oh YJ, Markelonis GJ, Oh TH. Minocycline alleviates death of oligodendrocytes by inhibiting pro-nerve growth factor production in microglia after spinal cord injury. J Neurosci 2007;27:7751–7761. ArticlePubMedPMC
- 17. Chorny A, Anderson P, Gonzalez-Rey E, Delgado M. Ghrelin protects against experimental sepsis by inhibiting high-mobility group box 1 release and by killing bacteria. J Immunol 2008;180:8369–8377. ArticlePubMed
- 18. Li WG, Gavrila D, Liu X, Wang L, Gunnlaugsson S, Stoll LL, McCormick ML, Sigmund CD, Tang C, Weintraub NL. Ghrelin inhibits proinflammatory responses and nuclear factor-kappaB activation in human endothelial cells. Circulation 2004;109:2221–2226. ArticlePubMed
- 19. Wu R, Dong W, Cui X, Zhou M, Simms HH, Ravikumar TS, Wang P. Ghrelin down-regulates proinflammatory cytokines in sepsis through activation of the vagus nerve. Ann Surg 2007;245:480–486. ArticlePubMedPMC
- 20. Theil MM, Miyake S, Mizuno M, Tomi C, Croxford JL, Hosoda H, Theil J, von Horsten S, Yokote H, Chiba A, Lin Y, Oki S, Akamizu T, Kangawa K, Yamamura T. Suppression of experimental autoimmune encephalomyelitis by ghrelin. J Immunol 2009;183:2859–2866. ArticlePubMed
- 21. Blasi E, Barluzzi R, Bocchini V, Mazzolla R, Bistoni F. Immortalization of murine microglial cells by a v-raf/v-myc carrying retrovirus. J Neuroimmunol 1990;27:229–237. ArticlePubMed
- 22. Li QM, Tep C, Yune TY, Zhou XZ, Uchida T, Lu KP, Yoon SO. Opposite regulation of oligodendrocyte apoptosis by JNK3 and Pin1 after spinal cord injury. J Neurosci 2007;27:8395–8404. ArticlePubMedPMC
- 23. Kim SJ, Yune TY, Han CT, Kim YC, Oh YJ, Markelonis GJ, Oh TH. Mitochondrial isocitrate dehydrogenase protects human neuroblastoma SH-SY5Y cells against oxidative stress. J Neurosci Res 2007;85:139–152. ArticlePubMed
- 24. Lee JY, Oh TH, Yune TY. Ghrelin inhibits hydrogen peroxide-induced apoptotic cell death of oligodendrocytes via ERK and p38MAPK signaling. Endocrinology 2011;152:2377–2386. ArticlePubMedPDF
- 25. Beattie MS, Harrington AW, Lee R, Kim JY, Boyce SL, Longo FM, Bresnahan JC, Hempstead BL, Yoon SO. ProNGF induces p75-mediated death of oligodendrocytes following spinal cord injury. Neuron 2002;36:375–386. ArticlePubMedPMC
- 26. Stirling DP, Khodarahmi K, Liu J, McPhail LT, McBride CB, Steeves JD, Ramer MS, Tetzlaff W. Minocycline treatment reduces delayed oligodendrocyte death, attenuates axonal dieback, and improves functional outcome after spinal cord injury. J Neurosci 2004;24:2182–2190. ArticlePubMedPMC
- 27. Howard AD, Feighner SD, Cully DF, Arena JP, Liberator PA, Rosenblum CI, Hamelin M, Hreniuk DL, Palyha OC, Anderson J, Paress PS, Diaz C, Chou M, Liu KK, McKee KK, Pong SS, Chaung LY, Elbrecht A, Dashkevicz M, Heavens R, Rigby M, Sirinathsinghji DJ, Dean DC, Melillo DG, Patchett AA, Nargund R, Griffin PR, DeMartino JA, Gupta SK, Schaeffer JM, Smith RG, Van der Ploeg LH. A receptor in pituitary and hypothalamus that functions in growth hormone release. Science 1996;273:974–977. ArticlePubMed
- 28. Guan XM, Yu H, Palyha OC, McKee KK, Feighner SD, Sirinathsinghji DJ, Smith RG, Van der Ploeg LH, Howard AD. Distribution of mRNA encoding the growth hormone secretagogue receptor in brain and peripheral tissues. Brain Res Mol Brain Res 1997;48:23–29. ArticlePubMed
- 29. Pocivavsek A, Rebeck GW. Inhibition of c-Jun N-terminal kinase increases apoE expression in vitro and in vivo. Biochem Biophys Res Commun 2009;387:516–520. ArticlePubMedPMC
- 30. Svensson C, Fernaeus SZ, Part K, Reis K, Land T. LPS-induced iNOS expression in Bv-2 cells is suppressed by an oxidative mechanism acting on the JNK pathway: a potential role for neuroprotection. Brain Res 2010;1322:1–7. ArticlePubMed
- 31. Emre Y, Hurtaud C, Nubel T, Criscuolo F, Ricquier D, Cassard-Doulcier AM. Mitochondria contribute to LPS-induced MAPK activation via uncoupling protein UCP2 in macrophages. Biochem J 2007;402:271–278. ArticlePubMedPMCPDF
- 32. Yan L, Liu S, Wang C, Wang F, Song Y, Yan N, Xi S, Liu Z, Sun G. JNK and NADPH oxidase involved in fluoride-induced oxidative stress in BV-2 microglia cells. Mediators Inflamm 2013;2013:895975ArticlePubMedPMCPDF
- 33. Ghafourifar P, Parihar MS, Nazarewicz R, Zenebe WJ, Parihar A. Detection assays for determination of mitochondrial nitric oxide synthase activity; advantages and limitations. Methods Enzymol 2008;440:317–334. ArticlePubMed
- 34. Schmitz T, Endesfelder S, Chew LJ, Zaak I, Buhrer C. Minocycline protects oligodendroglial precursor cells against injury caused by oxygen-glucose deprivation. J Neurosci Res 2012;90:933–944. ArticlePubMed
- 35. di Penta A, Moreno B, Reix S, Fernandez-Diez B, Villanueva M, Errea O, Escala N, Vandenbroeck K, Comella JX, Villoslada P. Oxidative stress and proinflammatory cytokines contribute to demyelination and axonal damage in a cerebellar culture model of neuroinflammation. PLoS One 2013;8:e54722ArticlePubMedPMC
References
Fig. 1Ghrelin inhibits p38 mitogen-activated protein kinase (p38MAPK) and c-Jun N-terminal kinase (JNK) activation in BV-2 microglia after lipopolysaccharide (LPS) stimulation. BV-2 cells were seeded in 6-well plates (5×10⁵ cells/well) and treated with ghrelin (1, 10, 100, and 1,000 nM) for 30 minutes prior to LPS (100 ng/mL) treatment. (A) Western blots of phosphor-p38MAPK (p-p38MAPK), p-JNK, and p-c-Jun at 30 minutes after LPS treatment. (B-D) Quantitative analysis of Western blots shows that ghrelin significantly inhibited the level of p-p38MAPK, p-JNK, and p-c-Jun as compared with LPS-treated cells. Values are expressed as mean±SD of three separate experiments. aP<0.05 vs. control; bP<0.05 vs. LPS-treated control; cP<0.01 vs. LPS-treated control.
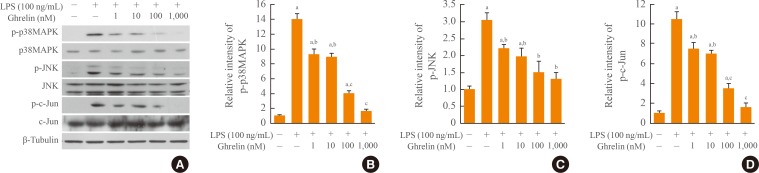
Fig. 2Ghrelin inhibits pro-nerve growth factor (proNGF) and reactive oxygen species (ROS) production in BV-2 microglia after lipopolysaccharide (LPS) stimulation. BV-2 cells were seeded in 6-well or 24-well plates and treated with ghrelin (1, 10, 100, and 1,000 nM) 30 minutes before LPS (100 ng/mL) treatment. (A) Western blot of proNGF at 4 hours after LPS treatment. (B) Quantitative analysis of Western blots shows that ghrelin treatment significantly inhibited the expression of proNGF in a dose dependent manner. (C) Dichlorodihydrofluorescein (DCF) fluorescence in BV-2 at 12 hours was increased by LPS and decreased by ghrelin (1,000 nM). Scale bar, 10 µm. (D) Quantitative analysis of DCF fluorescence shows that ghrelin significantly decreased ROS production when compared to the LPS-treated control (CTR). Values are expressed as mean±SD of three separate experiments. aP<0.05 vs. control; bP<0.05 vs. LPS-treated control; cP<0.01 vs. LPS-treated control.

Fig. 3Ghrelin inhibits cell death of oligodendrocytes cocultured with BV-2 cells activated by lipopolysaccharide (LPS). For oligodendrocyte/microglia cocultures, BV-2 cells were grown on porous upper inserts of transwell chambers in 24-well plates. After treatment with LPS (100 ng/mL) for 30 minutes, the inserts containing BV-2 were placed above mature oligodendrocyte culture in 24-well plates, allowing diffusion of soluble molecules. Treatment with ghrelin occured 30 minutes before LPS treatment. (A) Cell viability measured by MTT reduction assay at 48 hours. (B) Quantitative analysis of transferase-mediated deoxyuridine triphosphate-biotin nick end labeling: terminal deoxynucleotidyl transferase-mediated deoxyuridine triphosphate-biotin nick end labeling/myelin basic protein (TUNEL)/MBP-positive oligodendrocytes at 48 hours. Values are expressed as mean±SD of three separate experiments. OL, oligodendrocytes. aP<0.05 vs. control; bP<0.05 vs. LPS-treated control.

Figure & Data
References
Citations
Citations to this article as recorded by 
- Ghrelin Represses Thymic Stromal Lymphopoietin Gene Expression through Activation of Glucocorticoid Receptor and Protein Kinase C Delta in Inflamed Skin Keratinocytes
Hayan Jeong, Hyo-Jin Chong, Jangho So, Yejin Jo, Tae-Young Yune, Bong-Gun Ju
International Journal of Molecular Sciences.2022; 23(7): 3977. CrossRef - Inflammation: A Target for Treatment in Spinal Cord Injury
Ximena Freyermuth-Trujillo, Julia J. Segura-Uribe, Hermelinda Salgado-Ceballos, Carlos E. Orozco-Barrios, Angélica Coyoy-Salgado
Cells.2022; 11(17): 2692. CrossRef - The Interplay between Ghrelin and Microglia in Neuroinflammation: Implications for Obesity and Neurodegenerative Diseases
Cristina Russo, Maria Stella Valle, Antonella Russo, Lucia Malaguarnera
International Journal of Molecular Sciences.2022; 23(21): 13432. CrossRef - Early low-dose ghrelin intervention via miniosmotic pumps could protect against the progressive dopaminergic neuron loss in Parkinson's disease mice
Lingling Jiao, Xixun Du, Fengju Jia, Yong Li, Dexiao Zhu, Tinging Tang, Qian Jiao, Hong Jiang
Neurobiology of Aging.2021; 101: 70. CrossRef - Ghrelin-Mediated Regeneration and Plasticity After Nervous System Injury
Irina Stoyanova, David Lutz
Frontiers in Cell and Developmental Biology.2021;[Epub] CrossRef - Microglial Lipid Biology in the Hypothalamic Regulation of Metabolic Homeostasis
Andrew Folick, Suneil K. Koliwad, Martin Valdearcos
Frontiers in Endocrinology.2021;[Epub] CrossRef - Acylated Ghrelin as a Multi-Targeted Therapy for Alzheimer's and Parkinson's Disease
Niklas Reich, Christian Hölscher
Frontiers in Neuroscience.2020;[Epub] CrossRef - Effects of Ghrelin on the Apoptosis of Rheumatoid Arthritis Fibroblast-Like Synoviocyte MH7A Cells
Junxian Ma, Xinbo Wang, Tingting Lv, Jie Liu, Ying Ren, Jinshan Zhang, Yan Zhang
Biological and Pharmaceutical Bulletin.2019; 42(2): 158. CrossRef - Direct and indirect effects of lipids on microglia function
Q. Leyrolle, S. Layé, A. Nadjar
Neuroscience Letters.2019; 708: 134348. CrossRef - Dopamine neuronal protection in the mouse Substantia nigra by GHSR is independent of electric activity
Bernardo Stutz, Carole Nasrallah, Mariana Nigro, Daniel Curry, Zhong-Wu Liu, Xiao-Bing Gao, John D. Elsworth, Liat Mintz, Tamas L. Horvath
Molecular Metabolism.2019; 24: 120. CrossRef - MK-0677, a Ghrelin Agonist, Alleviates Amyloid Beta-Related Pathology in 5XFAD Mice, an Animal Model of Alzheimer’s Disease
Yu-on Jeong, Soo Shin, Jun Park, Bo Ku, Ji Song, Jwa-Jin Kim, Seong Jeon, Sang Lee, Minho Moon
International Journal of Molecular Sciences.2018; 19(6): 1800. CrossRef - Involvement of Astrocytes in Mediating the Central Effects of Ghrelin
Laura Frago, Julie Chowen
International Journal of Molecular Sciences.2017; 18(3): 536. CrossRef - The neurological effects of ghrelin in brain diseases: Beyond metabolic functions
Qian Jiao, Xixun Du, Yong Li, Bing Gong, Limin Shi, Tingting Tang, Hong Jiang
Neuroscience & Biobehavioral Reviews.2017; 73: 98. CrossRef - Neuropeptides and Microglial Activation in Inflammation, Pain, and Neurodegenerative Diseases
Lila Carniglia, Delia Ramírez, Daniela Durand, Julieta Saba, Juan Turati, Carla Caruso, Teresa N. Scimonelli, Mercedes Lasaga
Mediators of Inflammation.2017; 2017: 1. CrossRef - Non-Neuronal Cells in the Hypothalamic Adaptation to Metabolic Signals
Alejandra Freire-Regatillo, Pilar Argente-Arizón, Jesús Argente, Luis Miguel García-Segura, Julie A. Chowen
Frontiers in Endocrinology.2017;[Epub] CrossRef - The Ghrelin/GOAT System Regulates Obesity-Induced Inflammation in Male Mice
Rebecca E. Harvey, Victor G. Howard, Moyra B. Lemus, Tara Jois, Zane B. Andrews, Mark W. Sleeman
Endocrinology.2017; 158(7): 2179. CrossRef - Central Modulation of Neuroinflammation by Neuropeptides and Energy-Sensing Hormones during Obesity
Roger Maldonado-Ruiz, Lizeth Fuentes-Mera, Alberto Camacho
BioMed Research International.2017; 2017: 1. CrossRef - Lifestyle Shapes the Dialogue between Environment, Microglia, and Adult Neurogenesis
Jorge Valero, Iñaki Paris, Amanda Sierra
ACS Chemical Neuroscience.2016; 7(4): 442. CrossRef - Signaling of ghrelin and its functional receptor, the growth hormone secretagogue receptor, promote tumor growth in glioblastomas
Yousuke Okada, Yasuo Sugita, Koichi Ohshima, Motohiro Morioka, Satoru Komaki, Junko Miyoshi, Hideyuki Abe
Neuropathology.2016; 36(6): 535. CrossRef - Ghrelin-AMPK Signaling Mediates the Neuroprotective Effects of Calorie Restriction in Parkinson's Disease
Jacqueline A. Bayliss, Moyra B. Lemus, Romana Stark, Vanessa V. Santos, Aiysha Thompson, Daniel J. Rees, Sandra Galic, John D. Elsworth, Bruce E. Kemp, Jeffrey S. Davies, Zane B. Andrews
The Journal of Neuroscience.2016; 36(10): 3049. CrossRef - MMP-3 secreted from endothelial cells of blood vessels after spinal cord injury activates microglia, leading to oligodendrocyte cell death
Jee Y. Lee, Hae Y. Choi, Tae Y. Yune
Neurobiology of Disease.2015; 82: 141. CrossRef - Role of Non-Neuronal Cells in Body Weight and Appetite Control
Pilar Argente-Arizón, Alejandra Freire-Regatillo, Jesús Argente, Julie A. Chowen
Frontiers in Endocrinology.2015;[Epub] CrossRef - Articles in 'Endocrinology and Metabolism' in 2014
Won-Young Lee
Endocrinology and Metabolism.2015; 30(1): 47. CrossRef
 PubReader
 Cite
Cite