Articles
- Page Path
- HOME > Endocrinol Metab > Volume 37(3); 2022 > Article
-
Original ArticleDiabetes, Obesity and Metabolism The Impact of Insulin Resistance on Hepatic Fibrosis among United States Adults with Non-Alcoholic Fatty Liver Disease: NHANES 2017 to 2018
 Keypoint
The authors aimed to investigate the association of hepatic steatosis and insulin resistance with liver fibrosis in a nationally representative sample of United States adults. A positive association was found between the degree of hepatic steatosis and odds of fibrosis. The odds of significant liver fibrosis increased only in the presence of insulin resistance with an increasing degree of hepatic steatosis. These findings emphasize the importance of the metabolic aspects of the disease for fibrosis risk and suggest a need for better ways to identify patients with metabolism-associated fatty liver disease. -
Ji Cheol Bae1
 , Lauren A. Beste2, Kristina M. Utzschneider3,4
 -
Endocrinology and Metabolism 2022;37(3):455-465.
DOI: https://doi.org/10.3803/EnM.2022.1434
Published online: June 21, 2022
1Division of Endocrinology and Metabolism, Department of Medicine, Samsung Changwon Hospital, Sungkyunkwan University School of Medicine, Changwon, Korea
2General Medicine Service, Veterans Affairs Puget Sound Health Care System, University of Washington, Seattle, WA, USA
3Division of Endocrinology, Veterans Affairs Puget Sound Health Care System, Seattle, WA, USA
4Division of Metabolism, Endocrinology and Nutrition, Department of Medicine, University of Washington, Seattle, WA, USA
- Corresponding author: Kristina M. Utzschneider. Division of Endocrinology, Veterans Affairs Puget Sound Health Care System, 1660 South Columbian Way, Seattle, WA 98108, USA Tel: +1-206-277-3568, Fax: +1-206-764-2689, E-mail: kutzschn@uw.edu
Copyright © 2022 Korean Endocrine Society
This is an Open Access article distributed under the terms of the Creative Commons Attribution Non-Commercial License (http://creativecommons.org/licenses/by-nc/4.0/) which permits unrestricted non-commercial use, distribution, and reproduction in any medium, provided the original work is properly cited.
ABSTRACT
-
Background
- We aimed to investigate the association of hepatic steatosis with liver fibrosis and to assess the interactive effects of hepatic steatosis and insulin resistance on liver fibrosis in a nationally representative sample of United States adults.
-
Methods
- We conducted a cross-sectional analysis using data from National Health and Nutrition Examination Survey 2017 to 2018, which for the first time included transient elastography to assess liver stiffness and hepatic steatosis. We evaluated the association between hepatic steatosis (using controlled attenuation parameter [CAP]) and clinically significant liver fibrosis (defined as liver stiffness ≥7.5 kPa) using logistic regression with an interaction term for hepatic steatosis and insulin resistance (defined as homeostatic model assessment of insulin resistance ≥3.0).
-
Results
- Among adults undergoing transient elastography (n=2,023), 45.9% had moderate or greater hepatic steatosis and 11.3% had clinically significant liver fibrosis. After adjustment for demographic and metabolic factors, the odds of significant liver fibrosis increased as CAP score rose (odds ratio, 1.35 per standard deviation increment; 95% confidence interval, 1.11 to 1.64). We detected a significant interaction effect between CAP score and insulin resistance on the probability of significant liver fibrosis (P=0.016 for interaction). The probability of significant liver fibrosis increased in the presence of insulin resistance with increasing CAP score, while those without insulin resistance had low probability of significant liver fibrosis, even with high CAP scores.
-
Conclusion
- Individuals with hepatic steatosis had higher odds of fibrosis when insulin resistance was present. Our findings emphasize the importance of the metabolic aspects of the disease on fibrosis risk and suggest a need to better identify patients with metabolic associated fatty liver disease.
- The prevalence of non-alcoholic fatty liver disease (NAFLD) is increasing worldwide [1] and affects about 20% to 35% of the United States population as of 2009 to 2014 [2,3]. Fatty liver is strongly linked with obesity and is considered the hepatic manifestation of the metabolic syndrome [4]. NAFLD encompasses a spectrum of severity ranging from simple steatosis, nonalcoholic steatohepatitis (NASH), advanced hepatic fibrosis, and hepatocellular carcinoma [5]. Fatty liver disease progression from NAFLD to NASH involves complex genetic, environmental, and metabolic factors [6,7]. Insulin resistance is strongly associated with NAFLD [8,9], but there is lack of large-scale studies that focus on its effects on hepatic fibrosis.
- The National Health and Nutrition Examination Survey (NHANES) is a continuous, cross-sectional survey designed to assess the health and nutritional status of a representative sample of United States residents. Transient elastography was used for the first time in the 2017 to 2018 NHANES to assess hepatic fat composition and fibrosis in a subset of participants, along with metabolic parameters. While liver biopsy is considered the gold standard for diagnosing steatohepatitis and evaluating the degree of hepatic steatosis, it is invasive, expensive, and infeasible for population-based studies [10]. Some non-invasive modalities such as magnetic resonance imaging (MRI)-estimated proton density fat fraction (PDFF) and magnetic resonance elastography (MRE) are costly, time-consuming, and limited by technical feasibility [11]. Although not as sensitive or specific as liver biopsy, MRI-PDFF or MRE, transient elastography correlates well with those measures by biopsy [12,13] and is less expensive and easier to implement [11,14].
- In this analysis of transient elastography results in a nationally representative United States sample, we aimed to (1) investigate the association of hepatic steatosis with liver stiffness and clinically significant fibrosis, and (2) assess the interaction effects of hepatic steatosis and insulin resistance on liver stiffness and clinically significant fibrosis. We hypothesized that the degree of hepatic steatosis is associated with liver fibrosis and that this association would be affected by insulin resistance.
INTRODUCTION
- Subjects
- We conducted a cross-sectional analysis using data from NHANES conducted between 2017 and 2018 (n=9,254). The NHANES survey is directed by the National Center for Health Statistics (NCHS) and includes a representative sample of the United States population of all ages. Details of the study design and methods are provided elsewhere [15] and summarized below. The NHANES protocol (Protocols #2011-17 and #2018-01) was approved by NCHS Research Ethics Review Board and written informed consent was obtained from all participants.
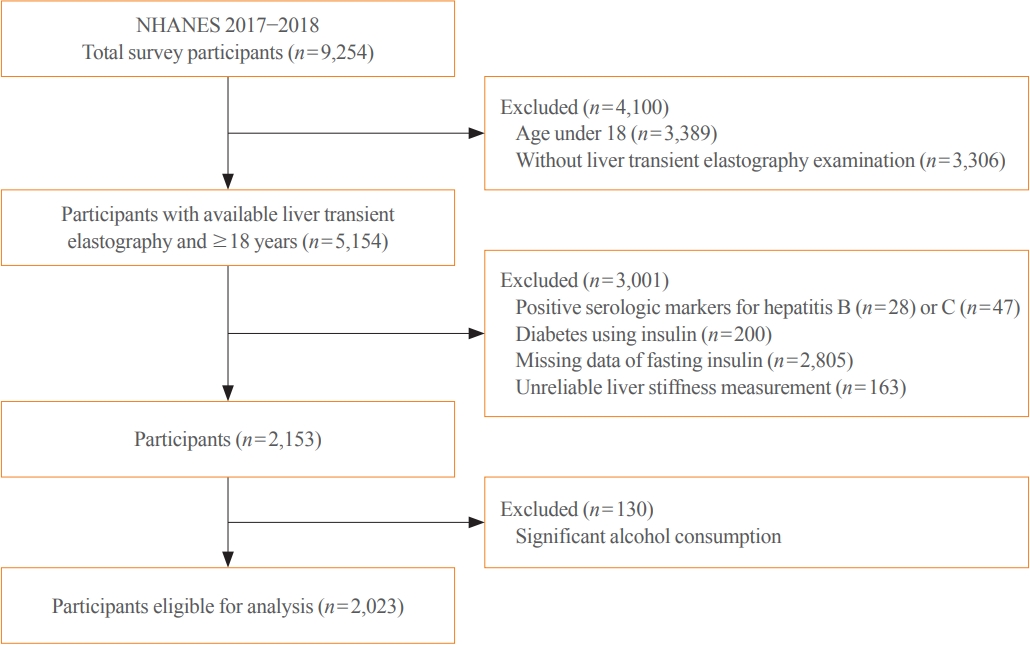
- Participants underwent a structured interview and standardized health examination that included medical and physiological measurements, self-reported alcohol intake and fasting laboratory tests. Liver transient elastography was first added to the NHANES 2017 to 2018 and all participants aged 12 years and over were eligible. A total of 5,154 subjects 18 years and older underwent liver transient elastography. Among these subjects, 3,001 were excluded based on the following criteria: (1) positive serologic markers for hepatitis B (n=28) or C (n=47) virus; (2) patients with diabetes currently using insulin (n=200); (3) missing data of fasting insulin (n=2,805); or (4) unreliable liver stiffness measurement (LSM; n=163). Of the 2,153 remaining subjects, 130 were additionally excluded based on self-report of significant alcohol consumption (Fig. 1). Liver stiffness evaluation was considered unreliable if at least 10 valid measurements were not obtained or the ratio of the interquartile range (IQR) of LSM to the median (IQR/M) was >0.30 in patients with LSM >7.1 kPa [16]. After applying the above exclusion criteria, the total number of subjects eligible for analysis was 2,023.
- Measurements
- Information on demographic characteristics and health-related history was obtained in household interviews by trained interviewers using a computer-assisted personal interview system. The body measures data were collected by trained health technicians. Body mass index (BMI) was calculated as weight in kilograms divided by height in meters squared, and then rounded to one decimal place. Participants were asked to fast for 9 hours before the blood sample was collected. Plasma fasting glucose concentration was determined using a hexokinase method. A 2-site immunoenzymometric assay was used to measure serum fasting insulin concentration. As a marker of insulin resistance, the homeostatic model assessment of insulin resistance (HOMA-IR) was calculated using the following formula: HOMA-IR= [fasting insulin (μIU/mL)×fasting glycemia (mmol/L)]/22.5 [17]. In addition, concentrations of glycated hemoglobin (HbA1c), low-density lipoprotein cholesterol (LDL-C), triglyceride (TG), high-density lipoprotein cholesterol (HDL-C), alanine aminotransferase, and aspartate aminotransferase were measured. Details of measurements are available at http://www.cdc.gov/nchs/nhanes/index.htm.
- Liver ultrasound transient elastography
- The liver ultrasound transient elastography was conducted with FibroScan 502 Touch (Echosens, Paris, France) using a medium (M) or extra-large (XL) probe. An XL probe (26% of participants) was used when the skin–liver capsule distance was ≥25 mm. Liver stiffness is calculated by measuring the velocity of a 50-Hz shear wave as it passes through the liver. The shear wave velocity can then be converted into liver stiffness, which is expressed in kilopascals (kPa), with higher kPa denoting greater stiffness. Controlled attenuation parameter (CAP) score and LSM by FibroScan (Echosens) are reliable biomarkers to noninvasively assess liver steatosis and fibrosis. Hepatic steatosis was measured using the CAP in dB/m. Participants were instructed to fast for at least 3 hours prior to testing. Multiple CAP and LSM were obtained from the right lobe of the liver through the intercostal space located at the intersection of the mid-axillary line and a transverse line at the level of the xiphoid process with participants lying in the supine position. The median values of completed measures were recorded as the representative CAP and LSM values. NHANES health technicians, all of whom were trained by an expert technician and certified by NHANES staff, performed the elastography exam according to the manufacturer guidelines. The inter-rater reliability of measurements (n=32) between health technicians and reference examiners was 0.86 for stiffness and 0.94 for CAP-steatosis with mean differences±standard deviation (SD) of 0.44±1.3 kPa and 4.5±19.8 dB/m, respectively [15].
- Definitions
- The presence of insulin resistance was defined as HOMA-IR ≥ 3.0, which was chosen by referring to the value used in a previous study [17]. We used a LSM cut-off value of 7.5 kPa for clinically significant liver fibrosis (corresponding to histological METAVIR fibrosis score ≥F2) [18]. Significant alcohol consumption was defined as >21 standard drinks per week in men and >14 standard drinks per week in women. A standard alcoholic drink was any drink that contains 14 g of pure alcohol [19]. Diabetes was diagnosed in participants who had fasting plasma glucose ≥126 mg/dL or HbA1c ≥6.5% [20]. Also, participants who currently reported taking glucose-lowering medications were defined as having diabetes.
- Study design and statistical analysis
- Pearson correlation coefficient was used to evaluate the association of CAP score and HOMA-IR with LSM. We also fitted multivariate linear regression models to examine these associations, in which the LSM variable was log-transformed (Log) to satisfy the normality assumption for statistical analyses and to linearize relationships. Spline regression analyses evaluated the association of CAP scores and HOMA-IR with the odds ratio (OR) for having significant liver fibrosis (LSM ≥7.5 kPa). The shapes of these associations were modeled by restricted cubic splines without covariates adjustment, with three knots set at the 10th, 50th, and 90th percentiles. Knots were equivalent to a CAP score of 186, 262, and 347 dB/m, respectively. The reference value was set as a CAP score of 220 dB/m and HOMA-IR of 0.83. We considered the values associated with the lowest risk as the reference values. All 2,023 participants were categorized into quartiles based on the CAP score and the HOMA-IR. We examined the ORs for having significant liver fibrosis (LSM ≥7.5 kPa) according to CAP and HOMA-IR quartiles using a logistic regression model. The interaction effects of CAP score and insulin resistance on LSM and probability of significant liver fibrosis were analyzed in multivariate linear regression and logistic regression models, respectively, by adding CAP-insulin resistance interaction term. The adjusted value of Log-LSM and probability of fibrosis was estimated using the margins command in Stata software. A P<0.05 was considered statistically significant. All analyses were performed using the Stata program version 15.1 (Stata Corp., College Station, TX, USA).
METHODS
- Cohort characteristics
- Overall, participants had a mean BMI of 29.4±7.3 kg/m2, and 18.8% had diabetes. The mean age was 49.0±18.3 years and 47.9% of the study sample were men. Of the participants, 45.7% had a CAP score ≥268 dB/m, consistent with ≥S2 grade steatosis (steatosis >33%) [12], and 11.3% had LSM ≥7.5 kPa, consistent with clinically significant liver fibrosis (≥F2) (Table 1).
- Cohort characteristics by hepatic steatosis
- The characteristics of study participants by CAP quartiles are presented in Table 1 and reported glucose and lipid lowering medications in Supplemental Table S1. The values of metabolic parameters including BMI, LDL-C, TG, fasting glucose, HOMA-IR, and the percentage with diabetes increased across the CAP quartiles, while HDL decreased. As CAP quartiles increased, the proportion of subjects with significant liver fibrosis and insulin resistance (HOMA-IR ≥3.0) also increased. Those who identified as Hispanic ethnicity were more likely to be in the highest quartile (141 out of 491, 28.7%), while African Americans (84 out of 446, 18.8%) were less likely. A sex difference was also noted with more men affected by hepatic steatosis than women.
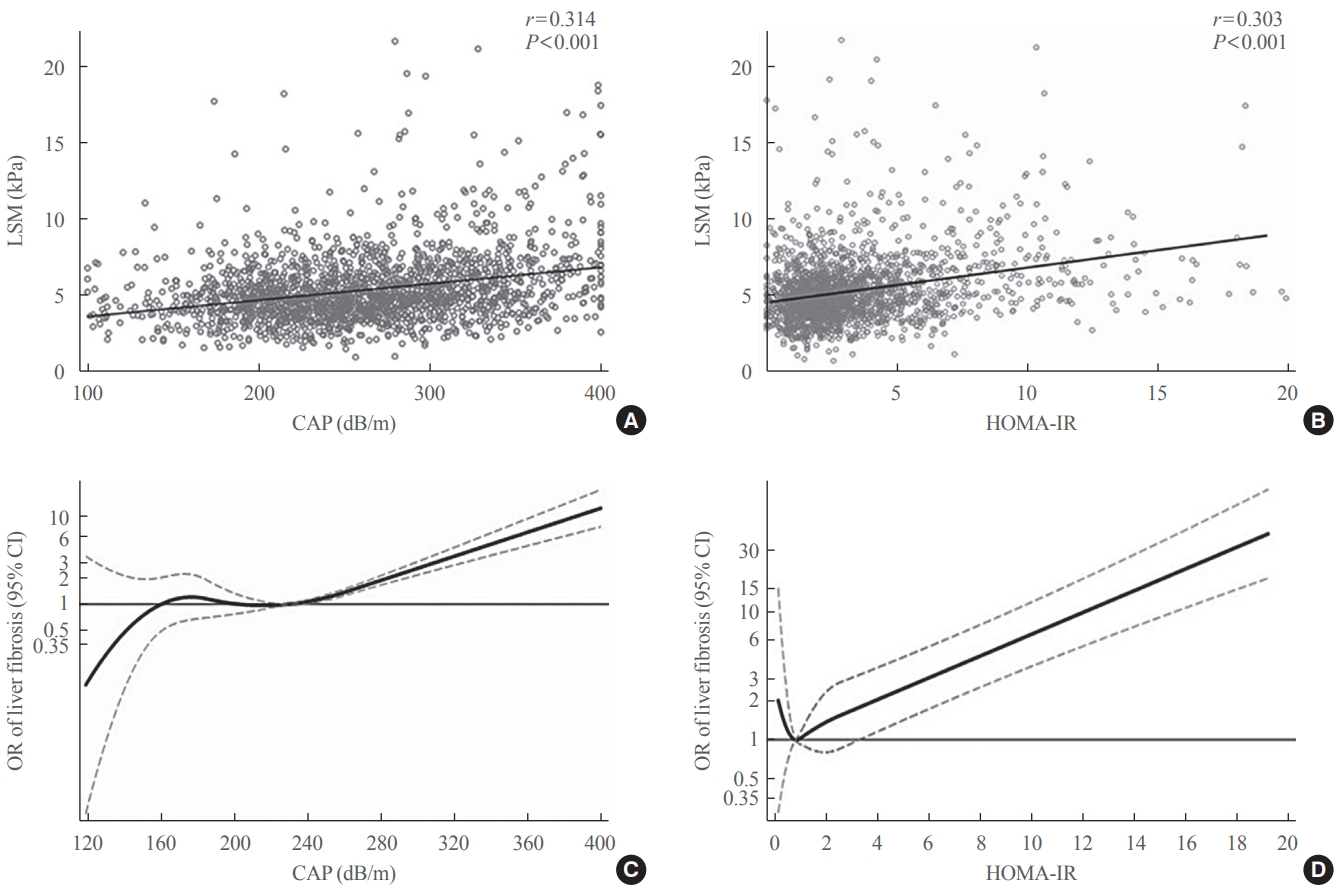
- Relationship between steatosis and liver stiffness
- The CAP score was positively associated with LSM (r=0.314 and P<0.001) (Fig. 2A). The restricted cubic spline model demonstrated gradually increasing ORs for having significant liver fibrosis with increasing CAP scores starting at approximately 260 dB/m (Fig. 2C). In a linear regression models adjusted for age, sex, BMI, presence of diabetes, TG, HDL-C, race and lipid-lowering medication use, higher CAP score was significantly associated with higher values of log LSM (β coefficient, 0.0007; 95% confidence interval [CI], 0.0004 to 0.0011; P<0.001). The risk of having significant liver fibrosis (LSM ≥7.5 kPa) increased across the CAP score, with age and sex adjusted ORs per SD increment of 2.18 (95% CI, 1.86 to 2.54). Additional adjustment for BMI, HOMA-IR, and diabetes status attenuated the ORs to 1.35 (95% CI, 1.12 to 1.62) (Table 2).
- Relationship between HOMA-IR and liver stiffness
- HOMA-IR was positively associated with LSM (r=0.303 and P<0.001) (Fig. 2B). In the restricted cubic spline regression model, HOMA-IR had a J-shaped association with the odds for liver fibrosis. Overall, the shapes of the association between HOMA-IR and ORs of having LSM ≥7.5 kPa demonstrated an increased risk of having significant liver fibrosis at a HOMA-IR higher than 3.8 (Fig. 2D). In linear regression models adjusted for age, sex, BMI, presence of diabetes, TG, HDL-C, race and lipid-lowering medication use, higher HOMA-IR was significantly associated with higher values of log LSM (β coefficient, 0.006; 95% CI, 0.002 to 0.009; P=0.002). As HOMA-IR increased, the risk of having significant liver fibrosis (LSM ≥7.5 kPa) increased, with age and sex adjusted ORs per SD increment of 1.53 (95% CI, 1.33 to 1.76). However, this association lost its statistical significance after adjustment for BMI (Table 2).
- Interaction effects of steatosis and insulin resistance on liver stiffness
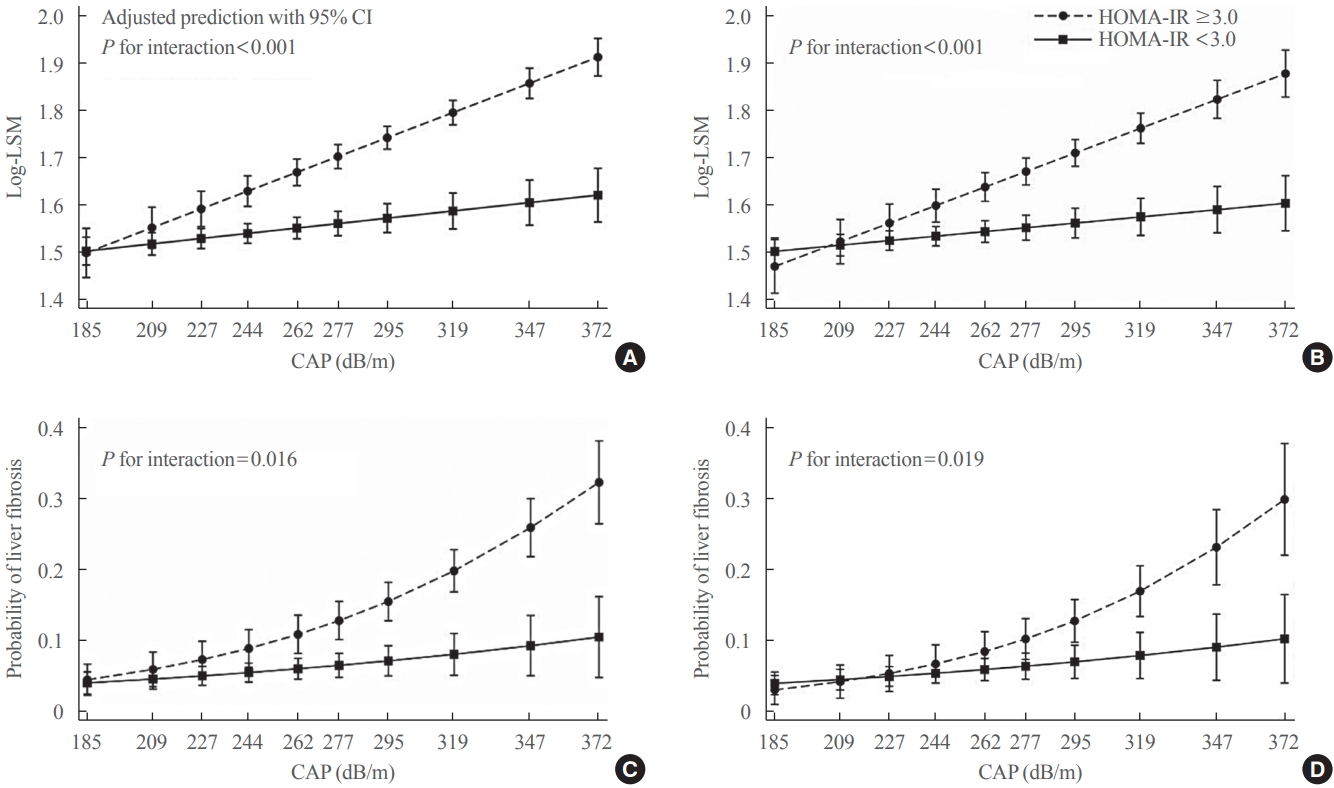
- The association of CAP score with LSM levels was significantly different according to the presence or absence of insulin resistance (P<0.001 for interaction), with LSM increasing as the CAP score increased in participants with insulin resistance while the relationship was close to flat in those without insulin resistance (Fig. 3A). Similarly, the CAP score interacted with insulin resistance, thereby affecting the probability of having clinically significant liver fibrosis (P=0.016 for interaction) (Fig. 3C). The probability of having significant liver fibrosis increased in the presence of insulin resistance with increasing CAP score. However, in those without insulin resistance, even if the CAP score was very high, there was a low probability of having clinically significant liver fibrosis (Fig. 3C). Results were similar in analyses excluding patients with diabetes (Fig. 3B, D). All associations were independent of age, sex, race/ethnicity, and lipid-lowering medication. Interaction effects were significant even after additional adjustment for BMI (Supplemental Fig. S1).
RESULTS
- Results from the 2017 to 2018 NHANES survey demonstrate that 45.7% of a nationally representative sample of United States adults had moderate or greater hepatic steatosis, and 11.5% had clinically significant liver fibrosis. This exceeds the previously reported 20% to 35% population prevalence of NAFLD based on ultrasound and could reflect an overall increase in prevalence over time [3], although direct comparison is difficult given the poor sensitivity of liver ultrasound in detecting mild steatosis [21]. Greater severity of steatosis was associated with a higher odds of significant liver fibrosis. Most importantly, insulin resistance and hepatic steatosis had an interactive effect on the odds of fibrosis that was greater than the effect of either risk factor independently, suggesting that insulin resistance might be a key driver of fibrosis in patients with hepatic steatosis. Based on a 74.1% prevalence of insulin resistance among those in the highest quartiles of steatosis (representing 18.7% of the entire study population), future sequelae from NAFLD could be even greater than current estimates project [1].
- Our results indicate that the risk of significant liver fibrosis increased in the presence of insulin resistance with increasing degree of hepatic steatosis. These results imply that those without insulin resistance are less likely to have severe liver disease even in the setting of severe steatosis. Our findings support several studies showing that lean NAFLD patients, who were more insulin sensitive, generally had less severe liver disease compared to obese patients [1,22-25]. The relationship of obesity with insulin resistance is a long-recognized phenomenon [26]. Additionally, convincing evidence suggests that the coexistence of metabolic dysfunction further increases the risk of liver disease progression, as well as extra-hepatic clinical outcomes [1,27-30].
- A new nomenclature of metabolic associated fatty liver disease (MAFLD) has recently been proposed to replace the term NAFLD because it more closely reflects current knowledge of fatty liver disease associated with metabolic dysfunction [7,21]. The newly proposed diagnosis of MAFLD is based on the presence of metabolic dysfunction (overweight/obesity, type 2 diabetes, or evidence of metabolic dysregulation) in addition to hepatic steatosis, regardless of daily alcohol consumption and other concomitant liver diseases [21]. In our study, coexistence of insulin resistance with more severe steatosis was associated with the highest odds of liver fibrosis. Individuals with low degrees of hepatic steatosis were less likely to have significant fibrosis, even if they were insulin resistant, and conversely, those with high quantity of steatosis but without insulin resistance were also at lower odds of fibrosis. Our results support the purpose of the recently proposed change in the nomenclature and definition for fatty liver disease.
- Cross-sectional results do not establish a causal relationship. However, accumulating evidence allows us to interpret our observational findings. Insulin resistance plays an important role in lipolysis in adipose tissue, causing excessive free fatty acids in the hepatocyte and promoting the development of lipotoxicity [5,31]. Lipotoxicity impairs insulin signaling, induces oxidative damage, and promotes inflammation and fibrosis, which are thought to be associated with the disease progression to steatohepatitis and liver fibrosis in patients with fatty liver disease [9,31]. On the other hand, treatments that specifically improve insulin sensitivity lead to improvement in NAFLD. Pioglitazone, a glucose lowering agent that improves insulin sensitivity by acting as an agonist for the peroxisome proliferator-activated receptor γ (PPARγ) receptor [9], has been shown to improve steatohepatitis and fibrosis [32,33]. Saroglitazar, a PPARα/γ dual agonist that has insulin-sensitizing and lipid-lowering effects [5], also has recently been shown to lower hepatic fat content and liver stiffness in patients with NAFLD [34,35].
- The presence of advanced liver disease also could contribute to insulin resistance. Liver cirrhosis impairs insulin sensitivity and glucose metabolism [36-38]. Reduced glucose disposal in patients with liver cirrhosis is thought to be caused by defective glucose storage in both hepatic tissue and skeletal muscle [36,37]. However, we do not believe that this explains our findings. The NHANES is a population-based survey targeting the United States noninstitutionalized general population, rather than one enriched with adults with known liver disease, with only a small number of individuals having LSM values >15 kPa (F4) suggesting liver cirrhosis [18]. While certain etiologies of chronic liver disease, such as chronic hepatitis C [39] or alcohol use pathways [40], may contribute to insulin resistance [38], subjects with significant alcohol consumption and positive serologic markers for hepatitis B or C were excluded from this analysis. Therefore, it is more likely that our results reflect a role for insulin resistance in the pathophysiology leading to fibrosis in NAFLD rather than as a consequence of it.
- Hepatic stellate cells (HSCs) play a key role in the fibrosis process. In a chronically injured liver, quiescent HSCs transdifferentiate into activated phenotype responsible for most the collagen deposition in liver tissue [41]. In an insulin-resistant state such as obesity, reactive oxygen species production is increased, in part, through the loss of the repressive effect of insulin on CYP2E1, which promotes HSCs activation and fibrosis progression [42]. Increased expression of leptin, tumor necrosis factor α, interleukin 6, and monocyte chemoattractant protein 1 are integral mediators of HSCs activation, and increased levels of these cytokines are all associated with the insulin resistance and obesity [41]. In vitro, insulin itself has been shown to stimulate HSCs and increase expression of connective tissue growth factor, suggesting that hyperinsulinemia is also a key factor in the progression of fibrosis in patients with NAFLD [43].
- Our study is subjects to several strengths and limitations. Unlike previous studies that showed an association between insulin resistance and liver fibrosis in patients with NAFLD [44,45], our study has shown a difference in the relationship between insulin resistance and hepatic fibrosis according to the degree of hepatic steatosis. Additionally, while previous studies have included patients in liver clinics [44,45], this study used nationally representative data from NHANES that allows generalization to the population within the United States. The use of transient elastography enabled simultaneous evaluation of both fibrosis and steatosis. However, due to the nature of a population-based study, liver biopsies were impractical and histology is lacking to confirm the diagnosis of fatty liver disease. Although a significant body of literature supports the accuracy of transient elastography and CAP for staging liver fibrosis and steatosis, there is still no universal consensus regarding LSM and CAP score cutoffs for significant fibrosis and steatosis [18]. Also, transient elastography may be less reliable and overestimate stiffness or steatosis in obese people [13]. In order to minimize the number of unreliable results due to obesity, an XL probe was used when the skin–liver capsule distance is ≥25 mm [15] and subjects with unreliable LSM (IQR/M >30% and LS measure median >7.1 kPa) [16] were excluded. HOMA-IR of ≥3.0 was a value that defined insulin resistance among people without diabetes [17]. However, we do not believe this biased the results as we found similar results of an interaction between insulin resistance, CAP and LSM after excluding those with diabetes. Lastly, we did not consider dietary and physical activity data in our analysis, which might affect the results.
- In conclusion, we found positive association between degree of hepatic steatosis and odds of fibrosis. The odds of significant liver fibrosis increased in the presence of insulin resistance with increasing degree of hepatic steatosis, indicating that insulin resistance might be a key driver of fibrosis in people with hepatic steatosis. Our findings highlight the complex metabolic nature of NAFLD and suggest a need to better identify individuals with hepatic steatosis accompanied by metabolic dysregulation and utilize therapies aimed at improving insulin sensitivity.
DISCUSSION
Supplementary Information
Supplemental Fig. S1.
-
CONFLICTS OF INTEREST
No potential conflict of interest relevant to this article was reported.
-
AUTHOR CONTRIBUTIONS
Conception or design: J.C.B. Acquisition, analysis, or interpretation of data: J.C.B., K.M.U. Drafting the work or revising: J.C.B., L.A.B., K.M.U. Final approval of the manuscript: L. A.B., K.M.U.
Article information
-
Acknowledgements
- This work was supported by the Diabetes Research Center P30 DK017047 and Kristina M. Utzschneider and Lauren A. Beste are supported by the United States Veterans Affairs Administration.
- We thank the staff of the National Center for Health Statistics/ Centers for Disease Control and Prevention and study participants who have contributed to the National Health and Nutrition Examination Survey data. We also thank Yun Soo Hong, Departments of Epidemiology and Medicine, Johns Hopkins University Bloomberg School of Public Health, and Mi Hyeon Jin, Department of Research Support, Samsung Changwon Hospital, South Korea, for providing advice regarding statistical methodology.

| Characteristic |
CAP, dB/m |
||||||
|---|---|---|---|---|---|---|---|
| All (n=2,023) | <218 (n=517) | 218–262 (n=508) | 263–306 (n=496) | ≥307 (n=502) | P value | ||
| Age, yr | 49.0±18.3 | 42.7±19.2 | 48.7±18.3 | 51.6±17.3 | 53.1±16.5 | <0.001a | |
| Male sex, % | 968 (47.9) | 219 (42.4) | 236 (46.5) | 236 (47.6) | 277 (55.2) | 0.001c | |
| BMI, kg/m2 | 29.4±7.3 | 24.9±5.4 | 27.6±5.7 | 30.8±6.6 | 34.6±7.5 | <0.001a | |
| FPG, mg/dL | 103 (96–114) | 97 (93–104) | 101 (95–108) | 106 (99–117) | 112 (103–132) | <0.001b | |
| Insulin, μIU/mL | 9.8 (6.3–15.7) | 6.4 (4.3–9.4) | 8.3 (5.7–2.5) | 11.3 (7.6–16.5) | 16.5 (10.8–23.5) | <0.001b | |
| HbA1c, % | 5.6 (5.3–5.9) | 5.4 (5.1–5.6) | 5.5 (5.2–5.8) | 5.6 (5.3–6.0) | 5.9 (5.5–6.6) | <0.001b | |
| Triglyceride, mg/dL | 90 (60–134) | 65 (47–92) | 78 (56–117) | 99 (70–143) | 124 (92–175) | <0.001b | |
| LDL-C, mg/dL | 111.3±35.3 | 105.6±33.9 | 113.2±34.7 | 112.8±35.5 | 113.9±36.7 | <0.001a | |
| HDL-C, mg/dL | 53.2±14.7 | 59.0±14.8 | 54.8±14.2 | 51.7±15.0 | 47.1±11.8 | <0.001a | |
| AST, IU/L | 19 (16–23) | 18 (15–21) | 18 (15–22) | 19 (16–23) | 20 (16–27) | <0.001b | |
| ALT, IU/L | 17 (13–25) | 14 (11–20) | 16 (12–23) | 19 (14–26) | 23 (16–34) | <0.001b | |
| LSM, kPa | 4.9 (4.0–6.1) | 4.5 (3.7–5.5) | 4.6 (3.9–5.6) | 4.9 (4.1–6.0) | 5.8 (4.6–7.3) | <0.001b | |
| LSM ≥7.5 kPa | 229 (11.3) | 26 (5.0) | 34 (6.7) | 47 (9.5) | 122 (24.3) | <0.001c | |
| Diabetes | 381 (18.8) | 31 (6.0) | 57 (11.2) | 98 (19.8) | 195 (38.8) | <0.001c | |
| Medication | |||||||
| Diabetes | 251 (12.4) | 17 (3.3) | 39 (7.7) | 67 (13.5) | 128 (25.5) | <0.001c | |
| Dyslipidemia | 385 (19.0) | 50 (9.7) | 81 (15.9) | 123 (24.8) | 131 (26.1) | <0.001c | |
| HOMA-IR | 2.6 (1.6–4.5) | 1.6 (1.0–2.4) | 2.1 (1.4–3.4) | 3.0 (2.0–4.8) | 4.9 (3.0–8.0) | <0.001b | |
| HOMA-IR >3.0 | 860 (42.5) | 77 (14.9) | 148 (29.1) | 255 (51.4) | 380 (75.7) | <0.001c | |
| Race | |||||||
| Hispanic | 491 (24.3) | 97 (18.8) | 113 (22.2) | 140 (28.2) | 141 (28.1) | <0.001c | |
| White | 680 (33.6) | 173 (33.5) | 159 (31.3) | 165 (33.3) | 183 (36.5) | 0.381c | |
| Black | 446 (22.1) | 145 (28.1) | 120 (23.6) | 97 (19.6) | 84 (16.7) | <0.001c | |
| Asian | 294 (14.5) | 72 (13.9) | 80 (15.8) | 72 (14.5) | 70 (13.9) | 0.824c | |
Values are expressed as mean±standard deviation, number (%), or median (interquartile range).
CAP, controlled attenuation parameter; BMI, body mass index; FPG, fasting plasma glucose; HbA1c, glycated hemoglobin; LDL-C, low-density lipoprotein cholesterol; HDL-C, high-density lipoprotein cholesterol; AST, aspartate aminotransferase; ALT, alanine aminotransferase; LSM, liver stiffness measurement; HOMA-IR, homeostasis model assessment of insulin resistance.
a By one way analysis of variance;
b By Kruskal-Wallis test;
c By Pearson’s chi-squared test.
| Variable | LSM ≥7.5 kPa |
Adjusted OR (95% CI)a |
||||
|---|---|---|---|---|---|---|
| Age, sex | Age, sex, BMI | Age, sex, BMI, DM, HOMA-IR | Age, sex, BMI, DM, HOMA-IR, TG, HDL-C, race, medicationb | |||
| CAP quartiles, dB/m | ||||||
| <218 (n=517) | 26 (5.0) | 1 | 1 | 1 | 1 | |
| 218–262 (n=508) | 34 (6.7) | 1.26 (0.74–2.14) | 0.90 (0.53–1.53) | 0.87 (0.51–1.47) | 0.83 (0.47–1.43) | |
| 263–306 (n=496) | 47 (9.5) | 1.78 (1.08–2.94) | 0.93 (0.54–1.59) | 0.91 (0.53–1.58) | 0.92 (0.53–1.59) | |
| ≥307 (n=502) | 122 (24.3) | 5.31 (3.38–8.33) | 1.81 (1.09–2.99) | 1.62 (0.96–2.71) | 1.58 (0.92–2.70) | |
| Continuous CAP (per SD increase) | 2.18 (1.86–2.54) | 1.42 (1.19–1.69) | 1.35 (1.12–1.62) | 1.35 (1.11–1.64) | ||
| HOMA-IR quartiles | ||||||
| <1.58 (n=506) | 28 (5.5) | 1 | 1 | 1 | 1 | |
| 1.58–2.56 (n=506) | 33 (6.5) | 1.16 (0.69–1.96) | 0.77 (0.45–1.31) | 0.74 (0.43–1.28) | 0.74 (0.43–1.27) | |
| 2.57–4.45 (n=506) | 51 (10.1) | 1.81 (1.12–2.93) | 0.78 (0.46–1.31) | 0.74 (0.43–1.25) | 0.71 (0.41–1.21) | |
| ≥4.46 (n=505) | 117 (23.2) | 4.97 (3.21–7.68) | 1.50 (0.91–2.47) | 1.26 (0.75–2.12) | 1.26 (0.73–2.18) | |
| Continuous HOMA-IR (per SD increase) | 1.53 (1.33–1.76) | 1.09 (0.96–1.23) | 1.03 (0.92–1.16) | 1.03 (0.91–1.16) | ||
Values are expressed as number (%).
CAP, controlled attenuation parameter; HOMA-IR, homeostatic model assessment of insulin resistance; LSM, liver stiffness measurement; OR, odds ratio; CI, confidence interval; BMI, body mass index; DM, diabetes mellitus; TG, triglyceride; HDL-C, high density lipoprotein-cholesterol; SD, standard deviation.
a Estimated by binary logistic regression analysis;
b Lipid-lowering medication.
- 1. Younossi ZM. Non-alcoholic fatty liver disease: a global public health perspective. J Hepatol 2019;70:531–44.ArticlePubMed
- 2. Younossi Z, Anstee QM, Marietti M, Hardy T, Henry L, Eslam M, et al. Global burden of NAFLD and NASH: trends, predictions, risk factors and prevention. Nat Rev Gastroenterol Hepatol 2018;15:11–20.ArticlePubMedPDF
- 3. Younossi ZM, Koenig AB, Abdelatif D, Fazel Y, Henry L, Wymer M. Global epidemiology of nonalcoholic fatty liver disease: meta-analytic assessment of prevalence, incidence, and outcomes. Hepatology 2016;64:73–84.ArticlePubMed
- 4. Rhee EJ. Nonalcoholic fatty liver disease and diabetes: an epidemiological perspective. Endocrinol Metab (Seoul) 2019;34:226–33.ArticlePubMedPMCPDF
- 5. Finck BN. Targeting metabolism, insulin resistance, and diabetes to treat nonalcoholic steatohepatitis. Diabetes 2018;67:2485–93.ArticlePubMedPMCPDF
- 6. Roehlen N, Crouchet E, Baumert TF. Liver fibrosis: mechanistic concepts and therapeutic perspectives. Cells 2020;9:875.ArticlePubMedPMC
- 7. Eslam M, Sanyal AJ, George J; International Consensus Panel. MAFLD: a consensus-driven proposed nomenclature for metabolic associated fatty liver disease. Gastroenterology 2020;158:1999–2014.ArticlePubMed
- 8. Bae JC, Cho YK, Lee WY, Seo HI, Rhee EJ, Park SE, et al. Impact of nonalcoholic fatty liver disease on insulin resistance in relation to HbA1c levels in nondiabetic subjects. Am J Gastroenterol 2010;105:2389–95.ArticlePubMedPDF
- 9. Khan RS, Bril F, Cusi K, Newsome PN. Modulation of insulin resistance in nonalcoholic fatty liver disease. Hepatology 2019;70:711–24.ArticlePubMedPDF
- 10. Spengler EK, Loomba R. Recommendations for diagnosis, referral for liver biopsy, and treatment of nonalcoholic fatty liver disease and nonalcoholic steatohepatitis. Mayo Clin Proc 2015;90:1233–46.ArticlePubMedPMC
- 11. Dulai PS, Sirlin CB, Loomba R. MRI and MRE for non-invasive quantitative assessment of hepatic steatosis and fibrosis in NAFLD and NASH: clinical trials to clinical practice. J Hepatol 2016;65:1006–16.ArticlePubMedPMC
- 12. Karlas T, Petroff D, Sasso M, Fan JG, Mi YQ, de Ledinghen V, et al. Individual patient data meta-analysis of controlled attenuation parameter (CAP) technology for assessing steatosis. J Hepatol 2017;66:1022–30.ArticlePubMed
- 13. European Association for Study of Liver; Asociacion Latinoamericana para el Estudio del Higado. EASL-ALEH Clinical Practice Guidelines: non-invasive tests for evaluation of liver disease severity and prognosis. J Hepatol 2015;63:237–64.ArticlePubMed
- 14. Lee DH. Noninvasive evaluation of nonalcoholic fatty liver disease. Endocrinol Metab (Seoul) 2020;35:243–59.ArticlePubMedPMCPDF
- 15. Centers for Disease Control and Prevention, National Center for Health Statistics. National Health and Nutrition Examination Survey [Internet]. Atlanta: CDC; 2022 [cited 2022 May 18]. Available from: https://www.cdc.gov/nchs/nhanes/index.htm.
- 16. Boursier J, Zarski JP, de Ledinghen V, Rousselet MC, Sturm N, Lebail B, et al. Determination of reliability criteria for liver stiffness evaluation by transient elastography. Hepatology 2013;57:1182–91.ArticlePubMedPDF
- 17. Inzucchi SE, Viscoli CM, Young LH, Furie KL, Gorman M, Lovejoy AM, et al. Pioglitazone prevents diabetes in patients with insulin resistance and cerebrovascular disease. Diabetes Care 2016;39:1684–92.ArticlePubMedPMCPDF
- 18. Bonder A, Afdhal N. Utilization of FibroScan in clinical practice. Curr Gastroenterol Rep 2014;16:372.ArticlePubMedPDF
- 19. Chalasani N, Younossi Z, Lavine JE, Charlton M, Cusi K, Rinella M, et al. The diagnosis and management of nonalcoholic fatty liver disease: practice guidance from the American Association for the Study of Liver Diseases. Hepatology 2018;67:328–57.ArticlePubMedPDF
- 20. American Diabetes Association. 2. Classification and diagnosis of diabetes: standards of medical care in diabetes-2021. Diabetes Care 2021;44(Suppl 1):S15–33.
- 21. Eslam M, Newsome PN, Sarin SK, Anstee QM, Targher G, Romero-Gomez M, et al. A new definition for metabolic dysfunction-associated fatty liver disease: an international expert consensus statement. J Hepatol 2020;73:202–9.ArticlePubMed
- 22. Weinberg EM, Trinh HN, Firpi RJ, Bhamidimarri KR, Klein S, Durlam J, et al. Lean Americans with nonalcoholic fatty liver disease have lower rates of cirrhosis and comorbid diseases. Clin Gastroenterol Hepatol 2021;19:996–1008.ArticlePubMed
- 23. Leung JC, Loong TC, Wei JL, Wong GL, Chan AW, Choi PC, et al. Histological severity and clinical outcomes of nonalcoholic fatty liver disease in nonobese patients. Hepatology 2017;65:54–64.ArticlePubMedPDF
- 24. Wei JL, Leung JC, Loong TC, Wong GL, Yeung DK, Chan RS, et al. Prevalence and severity of nonalcoholic fatty liver disease in non-obese patients: a population study using proton-magnetic resonance spectroscopy. Am J Gastroenterol 2015;110:1306–14.ArticlePubMedPDF
- 25. Fracanzani AL, Petta S, Lombardi R, Pisano G, Russello M, Consonni D, et al. Liver and cardiovascular damage in patients with lean nonalcoholic fatty liver disease, and association with visceral obesity. Clin Gastroenterol Hepatol 2017;15:1604–11.ArticlePubMed
- 26. Kahn BB, Flier JS. Obesity and insulin resistance. J Clin Invest 2000;106:473–81.ArticlePubMedPMC
- 27. Marchesini G, Bugianesi E, Forlani G, Cerrelli F, Lenzi M, Manini R, et al. Nonalcoholic fatty liver, steatohepatitis, and the metabolic syndrome. Hepatology 2003;37:917–23.ArticlePubMed
- 28. Tada T, Toyoda H, Sone Y, Yasuda S, Miyake N, Kumada T, et al. Type 2 diabetes mellitus: a risk factor for progression of liver fibrosis in middle-aged patients with non-alcoholic fatty liver disease. J Gastroenterol Hepatol 2019;34:2011–8.ArticlePubMedPDF
- 29. Bjorkstrom K, Franzen S, Eliasson B, Miftaraj M, Gudbjornsdottir S, Trolle-Lagerros Y, et al. Risk factors for severe liver disease in patients with type 2 diabetes. Clin Gastroenterol Hepatol 2019;17:2769–75.ArticlePubMed
- 30. Kim Y, Chang Y, Cho YK, Ahn J, Shin H, Ryu S. Obesity and weight gain are associated with progression of fibrosis in patients with nonalcoholic fatty liver disease. Clin Gastroenterol Hepatol 2019;17:543–50.ArticlePubMed
- 31. Chen Z, Yu R, Xiong Y, Du F, Zhu S. A vicious circle between insulin resistance and inflammation in nonalcoholic fatty liver disease. Lipids Health Dis 2017;16:203.ArticlePubMedPMCPDF
- 32. Boettcher E, Csako G, Pucino F, Wesley R, Loomba R. Meta-analysis: pioglitazone improves liver histology and fibrosis in patients with non-alcoholic steatohepatitis. Aliment Pharmacol Ther 2012;35:66–75.ArticlePubMedPMC
- 33. Cusi K, Orsak B, Bril F, Lomonaco R, Hecht J, Ortiz-Lopez C, et al. Long-term pioglitazone treatment for patients with nonalcoholic steatohepatitis and prediabetes or type 2 diabetes mellitus: a randomized trial. Ann Intern Med 2016;165:305–15.ArticlePubMed
- 34. Gawrieh S, Noureddin M, Loo N, Mohseni R, Awasty V, Cusi K, et al. Saroglitazar, a PPAR-α/γ agonist, for treatment of NAFLD: a randomized controlled double-blind phase 2 trial. Hepatology 2021;74:1809–24.ArticlePubMedPDF
- 35. Goyal O, Nohria S, Goyal P, Kaur J, Sharma S, Sood A, et al. Saroglitazar in patients with non-alcoholic fatty liver disease and diabetic dyslipidemia: a prospective, observational, real world study. Sci Rep 2020;10:21117.ArticlePubMedPMCPDF
- 36. Muller MJ, Willmann O, Rieger A, Fenk A, Selberg O, Lautz HU, et al. Mechanism of insulin resistance associated with liver cirrhosis. Gastroenterology 1992;102:2033–41.ArticlePubMed
- 37. Imano E, Kanda T, Nakatani Y, Motomura M, Arai K, Matsuhisa M, et al. Impaired splanchnic and peripheral glucose uptake in liver cirrhosis. J Hepatol 1999;31:469–73.ArticlePubMed
- 38. Chung W, Promrat K, Wands J. Clinical implications, diagnosis, and management of diabetes in patients with chronic liver diseases. World J Hepatol 2020;12:533–57.ArticlePubMedPMC
- 39. Parvaiz F, Manzoor S, Tariq H, Javed F, Fatima K, Qadri I. Hepatitis C virus infection: molecular pathways to insulin resistance. Virol J 2011;8:474.ArticlePubMedPMCPDF
- 40. Chen YM, Zhao JF, Liu YL, Chen J, Jiang RL. Chronic ethanol treatment of human hepatocytes inhibits the activation of the insulin signaling pathway by increasing cytosolic free calcium levels. Int J Mol Med 2015;36:739–46.ArticlePubMed
- 41. Chiang DJ, Pritchard MT, Nagy LE. Obesity, diabetes mellitus, and liver fibrosis. Am J Physiol Gastrointest Liver Physiol 2011;300:G697–702.ArticlePubMedPMC
- 42. Malaguarnera M, Di Rosa M, Nicoletti F, Malaguarnera L. Molecular mechanisms involved in NAFLD progression. J Mol Med (Berl) 2009;87:679–95.ArticlePubMedPDF
- 43. Paradis V, Perlemuter G, Bonvoust F, Dargere D, Parfait B, Vidaud M, et al. High glucose and hyperinsulinemia stimulate connective tissue growth factor expression: a potential mechanism involved in progression to fibrosis in nonalcoholic steatohepatitis. Hepatology 2001;34(4 Pt 1):738–44.ArticlePubMed
- 44. Fujii H, Imajo K, Yoneda M, Nakahara T, Hyogo H, Takahashi H, et al. HOMA-IR: an independent predictor of advanced liver fibrosis in nondiabetic non-alcoholic fatty liver disease. J Gastroenterol Hepatol 2019;34:1390–5.ArticlePubMedPDF
- 45. Aller R, Siguenza R, Pina M, Laserna C, Antolin B, Burgueno B, et al. Insulin resistance is related with liver fibrosis in type 2 diabetic patients with non-alcoholic fatty liver disease proven biopsy and Mediterranean diet pattern as a protective factor. Endocrine 2020;68:557–63.ArticlePubMedPDF
References
Figure & Data
References
Citations
- Association of insulin resistance indicators with hepatic steatosis and fibrosis in patients with metabolic syndrome
Tzu-chia Kuo, Yang-bor Lu, Chieh-lun Yang, Bin Wang, Lin-xin Chen, Ching-ping Su
BMC Gastroenterology.2024;[Epub] CrossRef - No More NAFLD: The Term Is Now MASLD
Ji Cheol Bae
Endocrinology and Metabolism.2024; 39(1): 92. CrossRef - Insulin Resistance/Sensitivity Measures as Screening Indicators of Metabolic-Associated Fatty Liver Disease and Liver Fibrosis
Mohammad E. Khamseh, Mojtaba Malek, Soodeh Jahangiri, Sohrab Nobarani, Azita Hekmatdoost, Marieh Salavatizadeh, Samira Soltanieh, Haleh Chehrehgosha, Hoda Taheri, Zeinab Montazeri, Fereshteh Attaran, Faramarz Ismail-Beigi, Fariba Alaei-Shahmiri
Digestive Diseases and Sciences.2024;[Epub] CrossRef - The association of Neuromedin U levels and non-alcoholic fatty liver disease: A comparative analysis
Murat Keskin, Sercan Avul, Aylin Beyaz, Nizameddin Koca
Heliyon.2024; 10(5): e27291. CrossRef - Oral Insulin Alleviates Liver Fibrosis and Reduces Liver Steatosis in Patients With Metabolic Dysfunction-associated Steatohepatitis and Type 2 Diabetes: Results of Phase II Randomized, Placebo-controlled Feasibility Clinical Trial
Yuval Ishay, Joel Neutel, Yotam Kolben, Ram Gelman, Orly Sneh Arbib, Oliver Lopez, Helena Katchman, Rizwana Mohseni, Miriam Kidron, Yaron Ilan
Gastro Hep Advances.2024; 3(3): 417. CrossRef - Comparative and Predictive Significance of Serum Leptin Levels in Non-alcoholic Fatty Liver Disease
Mehwish Qamar, Abeer Fatima, Ambreen Tauseef, Muhammad I Yousufzai, Ibrahim Liaqat, Qanbar Naqvi
Cureus.2024;[Epub] CrossRef - Greater Severity of Steatosis Is Associated with a Higher Risk of Incident Diabetes: A Retrospective Longitudinal Study
Ji Min Han, Jung Hwan Cho, Hye In Kim, Sunghwan Suh, Yu-Ji Lee, Jung Won Lee, Kwang Min Kim, Ji Cheol Bae
Endocrinology and Metabolism.2023; 38(4): 418. CrossRef - Hepatic T-cell senescence and exhaustion are implicated in the progression of fatty liver disease in patients with type 2 diabetes and mouse model with nonalcoholic steatohepatitis
Byeong Chang Sim, Yea Eun Kang, Sun Kyoung You, Seong Eun Lee, Ha Thi Nga, Ho Yeop Lee, Thi Linh Nguyen, Ji Sun Moon, Jingwen Tian, Hyo Ju Jang, Jeong Eun Lee, Hyon-Seung Yi
Cell Death & Disease.2023;[Epub] CrossRef - Familial clustering of nonalcoholic fatty liver disease in first‐degree relatives of adults with lean nonalcoholic fatty liver disease
Sorachat Niltwat, Chanin Limwongse, Natthinee Charatcharoenwitthaya, Duangkamon Bunditvorapoom, Wimolrak Bandidniyamanon, Phunchai Charatcharoenwitthaya
Liver International.2023; 43(12): 2713. CrossRef - Metabolic Score for Insulin Resistance Is Inversely Related to Incident Advanced Liver Fibrosis in Patients with Non-Alcoholic Fatty Liver Disease
Jun-Hyuk Lee, Yu-Jin Kwon, Kyongmin Park, Hye Sun Lee, Hoon-Ki Park, Jee Hye Han, Sang Bong Ahn
Nutrients.2022; 14(15): 3039. CrossRef - DPP-4 Inhibitor in Type 2 Diabetes Mellitus Patient with Non-Alcoholic Fatty Liver Disease: Achieving Two Goals at Once?
Ji Cheol Bae
Endocrinology and Metabolism.2022; 37(6): 858. CrossRef
 PubReader
 ePub Link
 Cite
Cite