
Articles
- Page Path
- HOME > Endocrinol Metab > Volume 35(2); 2020 > Article
-
Original ArticleRelationships between Thigh and Waist Circumference, Hemoglobin Glycation Index, and Carotid Plaque in Patients with Type 2 Diabetes
-
Myung Ki Yoon1
 , Jun Goo Kang2, Seong Jin Lee2, Sung-Hee Ihm2, Kap Bum Huh3†, Chul Sik Kim4
 -
Endocrinology and Metabolism 2020;35(2):319-328.
DOI: https://doi.org/10.3803/EnM.2020.35.2.319
Published online: June 30, 2020
1Hallym University College of Medicine, Chuncheon, Korea
2Division of Endocrinology and Metabolism, Department of Internal Medicine, Hallym University College of Medicine, Chuncheon, Korea
3Huh’s Diabetes Center and the 21st Century Diabetes and Vascular Research Institute, Seoul, Korea
4Department of Endocrinology, Yongin Severance Hospital, Yonsei University College of Medicine, Yongin, Korea
- Corresponding author: Chul Sik Kim. Department of Endocrinology, Yongin Severance Hospital, Yonsei University College of Medicine, 363 Dongbaekjukjeon-daero, Giheung-gu, Yongin 16995, Korea, Tel: +82-31-5189-8751, Fax: +82-31-5189-8567, E-mail: ironeat@yuhs.ac
- † Kap Bum Huh deceased on January 23, 2020
Copyright © 2020 Korean Endocrine Society
This is an Open Access article distributed under the terms of the Creative Commons Attribution Non-Commercial License (https://creativecommons.org/licenses/by-nc/4.0/) which permits unrestricted non-commercial use, distribution, and reproduction in any medium, provided the original work is properly cited.
ABSTRACT
-
Background
- This study investigated the relationships of thigh and waist circumference with the hemoglobin glycation index (HGI) and carotid atherosclerosis in patients with type 2 diabetes.
-
Methods
- This observational study included 3,075 Korean patients with type 2 diabetes, in whom anthropometric measurements and carotid ultrasonography were conducted. HGI was defined as the measured hemoglobin A1c (HbA1c) level minus the predicted HbA1c level, which was calculated using the linear relationship between HbA1c and fasting plasma glucose levels. Carotid atherosclerosis was defined as a clearly isolated focal plaque or focal wall thickening >50% of the surrounding intima-media thickness.
-
Results
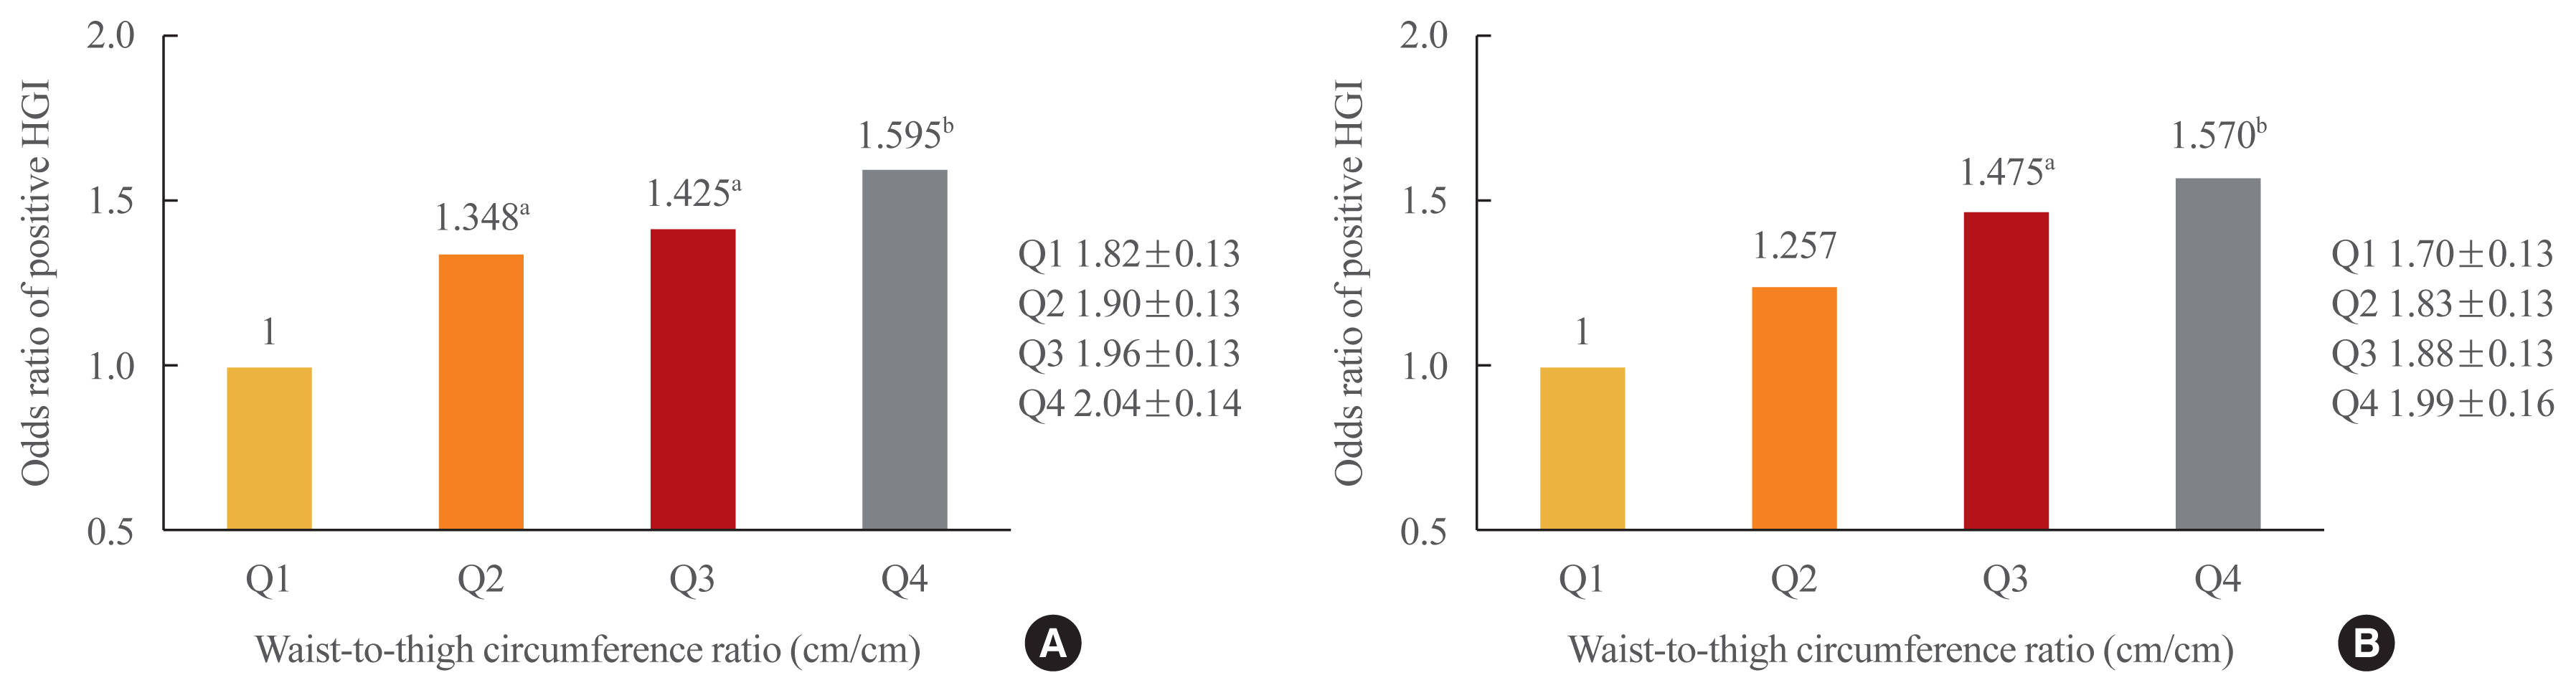
- The frequency of a positive HGI decreased with increasing thigh circumference in men and increased with increasing waist circumference in women after adjusting for potential confounding variables. Thigh and waist circumference had a combined augmentative effect on the likelihood of positive HGI, which was dramatically higher in patients in higher waist-to-thigh ratio quartiles (adjusted odds ratios for the highest compared to the lowest quartile: 1.595 in men and 1.570 in women). Additionally, the larger the thigh circumference, the lower the risk of carotid atherosclerosis, although in women, this relationship lacked significance after adjustment for potential confounders.
-
Conclusion
- HGI was associated with thigh circumference in men and waist circumference in women. In addition, the combination of low thigh circumference and high waist circumference was strongly associated with a higher HGI in Korean patients with type 2 diabetes. In particular, thigh circumference was associated with carotid atherosclerosis in men. However, further longitudinal studies are warranted.
- According to data published by the Korean Diabetes Association in 2018, one in seven (14.4%) Koreans over 30 years old had diabetes in 2016 [1]. Diabetes is a chronic disease that leads to retinopathy, nephropathy, cardiovascular disease, stroke, and other serious complications. High blood glucose levels are the main factor in the development of these complications and are also associated with increased mortality [2,3].
- Glycemic variability is the physiological consequence of both carbohydrate intake and the circadian rhythms of hormones involved in the regulation of glucose metabolism [4]. Glycemic variability is known to be high in people with diabetes, especially in those with low body mass index (BMI) values [5].
- To prevent diabetic complications, it is crucial to maintain proper blood glucose levels. To accomplish this goal, hemoglobin A1c (HbA1c), fasting plasma glucose, and postprandial blood glucose levels should be maintained within target ranges [6].
- Recently, the clinical significance of glucose variability has been highlighted in the context of the three aforementioned indicators [7]. Even among patients with similar HbA1c levels, fluctuations of blood glucose during the day can vary [8]. Similarly to fasting glucose, postprandial glucose, and HbA1c levels, diurnal variation in blood glucose levels is associated with the incidence of complications, with a large magnitude of variation associated with increased risk [9]. Therefore, it is important to reduce the diurnal variation of glucose in patients with diabetes [10,11].
- Blood glucose can be measured using a continuous glucose monitoring system (CGMS) to evaluate diurnal glucose variability [12]. However, this system is not yet widely applied in clinical settings because the equipment is expensive and uncomfortable to wear [13]. Furthermore, the values measured by CGMS and its target range have yet to be standardized, limiting the usage of CGMS [6].
- The hemoglobin glycation index (HGI) is another indicator that can be easily used in clinical settings to assess fluctuations in blood glucose. As an indicator of blood glucose metabolism relevant to diabetic complications, the HGI reflects diurnal variation in glucose levels [14]. A previous study reported that a high HGI was associated with an increased risk of cardiovascular complications such as coronary artery disease, stroke, and peripheral arterial disease in patients with pre-diabetes or diabetes [15]. The HGI has also been reported to be associated with an increased risk of coronary artery calcification in patients without diabetes, irrespective of HbA1c levels [16].
- Thigh and waist circumference are physical measurements that are strongly associated with diabetes risk. As thigh circumference increases, the risk of diabetes is reduced [17], and as it decreases, the risk of diabetes increases [18]. Thigh circumference is also known to be independently associated with insulin resistance in patients with type 2 diabetes [19].
- In contrast, increased waist circumference is associated with an increased risk of diabetes [17]. This relationship exists because waist circumference is an indicator of central obesity [20], which is strongly correlated with insulin resistance [21,22].
- Although thigh and waist circumference are associated with the incidence of diabetes, and the HGI is known to be a major factor in the prediction of diabetic complications, little is known about the relationships of thigh and waist circumference with the HGI. The main purpose of this study was to investigate this relationship. Furthermore, we sought to understand the relationship between thigh circumference and the presence of carotid artery plaque, which is a cardiovascular complication of diabetes.
INTRODUCTION
- Subjects
- This cross-sectional survey study included 3,075 patients with diabetes (male, 1,569; female, 1,506) who were admitted to Huh’s Diabetes Center in Seoul between September 2002 and October 2016. The subjects of this study were patients with type 2 diabetes who underwent carotid ultrasonography. To exclude the possibility of type 1 diabetes, we included only patients over 30 years old with negative anti-glutamic acid decarboxylase antibody tests and with C-peptide levels higher than 0.6 ng/mL. Furthermore, we included only patients for whom all variables required for the analysis had been evaluated. The study protocol was approved by the Institutional Review Board/Ethics Committee (IBR No.: 2019-I077) of Hallym University Sacred Heart Hospital. Informed written consent was obtained from all participants.
- Measurements
- All anthropometric values were measured with patients barefoot and wearing only light clothes [23]. BMI (kg/m2) was calculated using measured height and weight. Using a tape measure, waist circumference was measured after exhalation at the level midway between the lowest rib margin and the iliac crest. Thigh circumference was measured directly below the gluteal fold at the left leg, and calf circumference was measured at the thickest part of the calf.
- At their first visit, all patients underwent measurements of systolic blood pressure, diastolic blood pressure, and levels of fasting blood glucose (FPG), HbA1c, C-peptide, blood insulin, total cholesterol, low-density lipoprotein cholesterol, high-density lipoprotein cholesterol, and triglycerides. We evaluated the extent of insulin resistance and β-cell dysfunction using homeostatic model assessment for insulin resistance (HOMA-IR) and β-cell dysfunction (HOMA-B) calculated from fasting glucose and insulin levels using the formulas HOMA-IR=[glucose (mg/dL)×insulin (μU/mL)]/405 and HOMA-B=[20×insulin (μU/mL)]/[glucose (mg/dL)/18–3.5].
- Participants’ age, sex, hypertension status, duration of diabetes, lifestyle factors (drinking, smoking, and exercise status), and medication usage (hypoglycemic agents, antihypertensive agents, or statins) were examined using questionnaires. Carotid ultrasonography was conducted with a 10-MHz high-resolution carotid ultrasound device with a linear probe (LOGIQ 7, GE Healthcare, Milwaukee, WI, USA). The carotid arteries on both sides were observed, and a carotid plaque was defined as a distinctly hyperechoic lesion or a localized protrusion of the vessel wall with a thickness exceeding the intima-media thickness of the adjacent portion of the vessel wall by >50% [24].
- Calculation of the HGI
- The HGI can be expressed as the difference between the measured HbA1c and the predicted HbA1c [25]. To calculate the predicted HbA1c, a formula described in a previous study (predicted HbA1c=0.030×FPG+2.978) was used [15]. The greater the HGI, the greater the difference between the predicted HbA1c and the measured HbA1c. When the HGI value was zero or greater, we defined it as a positive HGI.
- Statistical analyses
- All continuous variables were expressed as mean±standard deviation, and nominal variables were expressed as percentages. First, subjects were grouped by sex. Then, each group was classified into four quartiles (Q1 through Q4) by both thigh circumference and waist circumference. To minimize the effect of measurement errors, each group was partitioned at appropriate intervals. For each group, the odds ratios (ORs) for a positive HGI and the existence of carotid plaque were computed via logistic regression. The group with the smallest measurement values (Q1) was used as a reference for both comparisons. We constructed four models in total: one unadjusted model and three adjusted multiple logistic regression models. Each adjusted model had different adjustment schemes. The first model was adjusted for age and duration of diabetes, while the second was additionally adjusted for BMI. In addition to age, diabetes duration, and BMI, the third model was adjusted for systolic blood pressure, exercise status, smoking status, use of hypoglycemic agents (insulin, sulfonylureas, biguanides, alpha-glucosidase inhibitors, glitazones, dipeptidyl peptidase-4 inhibitors, or sodium-glucose cotransporter 2 inhibitors), high-density lipoprotein cholesterol level, low-density lipoprotein cholesterol level, triglyceride level, and statin usage. The ORs of each model were expressed as values with 95% confidence intervals. All statistical analyses were performed using R software version 3.5.1 (R Foundation for Statistical Computing, Vienna, Austria). P values <0.05 were considered to indicate statistical significance.
METHODS
- Baseline characteristics
- The baseline characteristics of the participants are described in Table 1. The average age of the entire study sample was 58.6 years for men and 60.7 years for women, while the average duration of diabetes was 8.3 years for men and 8.5 years for women. The overall average circumferences of the thigh and waist were 44.5 cm (men, 45.2; women, 43.8) and 84.1 cm (men, 87.1; women, 81.0), respectively. Table 2 shows the baseline clinical characteristics of male and female patients classified by thigh circumference.
- Characteristics of participants according to thigh circumference
- In men, in addition to BMI and waist circumference, insulin resistance, insulin secretion ability (as shown by C-peptide levels and HOMA-B) [26], and triglyceride levels increased as thigh circumference increased. A similar trend was evident in women (Table 2).
- Relative risk of a positive HGI according to thigh and waist circumference
- After adjustment, we observed that the larger the thigh circumference, the smaller the risk of a positive HGI in men. In contrast, no difference in blood glucose variability was observed according to thigh circumference in women (Table 3). In men, no difference in the HGI according to waist circumference was observed. However, in women, the larger the waist circumference, the higher the chance of a positive HGI even after adjustment (Table 4).
- We additionally divided patients into four groups by their waist-to-thigh circumference ratio to determine whether a relationship existed between HGI and the combination of thigh and waist circumference. After adjustment for potential confounding variables, the risk of a positive HGI was found to be higher when waist circumference was larger and thigh circumference was smaller (Fig. 1).
- The risk of carotid plaque according to thigh circumference and waist circumference
- In men, it was found that the larger the thigh circumference, the lower the risk of carotid plaque after adjustment for potential confounding variables. In women, a similar tendency was observed before adjustment, but no statistically significant relationship was seen after adjustment (Table 5). In men, no difference in the presence of carotid plaque according to waist circumference was observed. In women, the presence of carotid plaque was higher in the thickest waist group compared to the reference group, but there is no statistical significance after adjustment (Table 6).
RESULTS
- The clinical significance of blood glucose variability in the development of diabetic complications has been recognized. Many parameters have been introduced to represent blood glucose variability, such as the mean amplitude of glycemic excursions [27], M-value [22], lability index [28], composite hypoglycemic score [28], average daily risk range [29], and others. In our study, we used the HGI as an indicator of blood variability that can be easily used in clinical settings. The HGI has also been reported to be associated with diabetic complications [14].
- The results of this study showed that men with type 2 diabetes were significantly less likely to exhibit a positive HGI as their thigh circumference increased. In contrast, no relationship was found between the risk of a positive HGI and thigh circumference in women. As many muscles in our body are located in the thigh region, this result suggests that muscle mass impacts the HGI more strongly in men than in women.
- In contrast, in women, the larger the waist circumference, the greater the risk of a positive HGI (a tendency not shown in men). In contrast to the aforementioned results based on thigh circumference, this indicates that the amount of fat has a greater effect on the HGI in women than in men.
- As the waist-to-thigh circumference ratio increased, the likelihood of a positive HGI also increased in both men and women. This indicates that both muscle mass and fat mass contribute to the presence of a positive HGI.
- We observed clear correlations between thigh and waist circumference and the HGI in both men and women; however, in men, thigh circumference had a stronger correlation with the HGI than waist circumference, while the opposite was true in women. In other words, in the development of HGI in men, muscle appears to be more important than fat, while in women, fat appears to play a greater role than muscle. This may be because men have more muscle mass and less fat than women. To reduce the risk of complications caused by a high HGI, it is important to emphasize the importance of a high thigh circumference in men and a low waist circumference in women.
- In men, the smaller the thigh circumference, the higher the likelihood of carotid plaque. This tendency was not seen in women, which may be because men have a higher risk of arteriosclerosis than women.
- In this study, the risk of a positive HGI increased as thigh circumference decreased in men and as waist circumference increased in women. In addition, the larger the thigh circumference, the lower the risk of carotid plaque in men.
- In terms of identifying risk factors for diabetes, cross-sectional studies such as the present study cannot determine the causal nature of relationships, as the temporality of relationships is difficult to establish [30]. Therefore, a prospective study is required for the accurate evaluation of thigh and waist circumference and blood glucose variability. In addition, it is necessary to investigate the most suitable cut-off values of thigh circumference, waist circumference, and waist-to-thigh circumference ratio for the purposes of predicting the HGI and reducing complications.
- The study examined only the relationship between thigh circumference and the presence of carotid plaque. However, if further studies identify additional relationships between physical measurements and complications, indicators that can be more easily applied in clinical settings (e.g., BMI) may be discovered. As a final limitation, the subjects of this study were limited to patients at a single medical center in Seoul, so the results are unlikely to apply to all type 2 diabetes patients.
- Nevertheless, many risk factors are combined in chronic diseases such as diabetes, and as they have an unclear pathogenesis [30], more studies should be conducted to examine various factors in a similar fashion to this study. The present study is also meaningful because the primary indicators (namely thigh circumference and waist circumference) are familiar to patients and can be easily measured in clinical practice.
DISCUSSION
-
Acknowledgements
- This paper is dedicated to the memory of our wonderful colleague and eternal master, devoting his life to studying diabetes, Professor Kap Bum Huh, who passed away in January 23, 2020.
-
AUTHOR CONTRIBUTIONS
Conception or design: M.K.Y., C.S.K. Acquisition, analysis, or interpretation of data: M.K.Y., J.G.K., S.J.L., S.H.I., K.B.H., C.S.K. Drafting the work or revising: M.K.Y., C.S.K. Final approval of the manuscript: C.S.K.
-
CONFLICTS OF INTEREST
No potential conflict of interest relevant to this article was reported.
Article information
Values are expressed as mean±standard deviation.
DM, diabetes mellitus; SBP, systolic blood pressure; DPP4, dipeptidyl peptidase 4; SGLT2, sodium-glucose cotransporter 2; BMI, body mass index; HbA1c, hemoglobin A1c; HDL-C, high-density lipoprotein cholesterol; LDL-C, low-density lipoprotein cholesterol; HOMA-IR, homeostatic model assessment for insulin resistance; HOMA-B, homeostatic model assessment of β-cell function.
Values are expressed as range or mean±standard deviation.
Q, quartile; DM, diabetes mellitus; DPP4, dipeptidyl peptidase 4; SGLT2, sodium-glucose cotransporter 2; BMI, body mass index; HbA1c, hemoglobin A1c; HDL-C, high-density lipoprotein cholesterol; LDL-C, low-density lipoprotein cholesterol; HOMA-IR, homeostatic model assessment for insulin resistance; HOMA-B, homeostatic model assessment of β-cell function.
| Variable | Q1 | Q2 | Q3 | Q4 |
|---|---|---|---|---|
| Men | ||||
| Number of subjects | 147 | 709 | 545 | 168 |
| Positive HGI | ||||
| Unadjusted OR | 1.000 | 0.825 (0.577–1.177) | 0.903 (0.626–1.300) | 0.711 (0.455–1.108) |
| Adjusted OR (95% CI)a | 1.000 | 0.751 (0.522–1.078) | 0.747 (0.509–1.092) | 0.523 (0.324–0.841)e |
| Adjusted OR (95% CI)b | 1.000 | 0.641 (0.437–0.937)d | 0.548 (0.350–0.855)e | 0.329 (0.182–0.591)f |
| Adjusted OR (95% CI)c | 1.000 | 0.670 (0.452–0.989)d | 0.569 (0.360–0.896)d | 0.349 (0.190–0.637)f |
|
|
||||
| Women | ||||
| Number of subjects | 154 | 571 | 568 | 213 |
| Positive HGI | ||||
| Unadjusted OR | 1.000 | 1.039 (0.722–1.489) | 0.979 (0.680–1.402) | 0.991 (0.650–1.508) |
| Adjusted OR (95% CI)a | 1.000 | 1.060 (0.736–1.521) | 1.036 (0.716–1.493) | 1.083 (0.703–1.666) |
| Adjusted OR (95% CI)b | 1.000 | 0.970 (0.666–1.407) | 0.860 (0.569–1.295) | 0.797 (0.470–1.348) |
| Adjusted OR (95% CI)c | 1.000 | 0.954 (0.650–1.394) | 0.866 (0.569–1.311) | 0.826 (0.482–1.410) |
HGI, hemoglobin glycation index; Q, quartile (Q1 was the lowest quartile); OR, odds ratio; CI, confidence interval.
a Adjusted for age and duration;
b As in a, and additionally adjusted for body mass index;
c As in b, and additionally adjusted for systolic blood pressure, exercise status, smoking status, hypoglycemic agent usage (insulin, sulfonylurea, biguanide, alpha-glucosidase inhibitor, glitazone, dipeptidyl peptidase-4 inhibitor, or sodium-glucose transport protein-2 inhibitor), high-density lipoprotein cholesterol, low-density lipoprotein cholesterol, triglycerides, and statin usage;
d P<0.05 vs. Q1;
e P<0.01 vs. Q1;
F P<0.001 vs. Q1.
| Variable | Q1 | Q2 | Q3 | Q4 |
|---|---|---|---|---|
| Men, HGI range | 68–81 | 82–86 | 87–91 | 92–107 |
| Number of subjects | 343 | 414 | 389 | 423 |
| Positive HGI | ||||
| Unadjusted OR | 1.000 | 0.974 (0.731–1.297) | 1.256 (0.939–1.681) | 1.163 (0.875–1.548) |
| Adjusted OR (95% CI)a | 1.000 | 0.968 (0.726–1.290) | 1.246 (0.931–1.668) | 1.141 (0.856–1.520) |
| Adjusted OR (95% CI)b | 1.000 | 1.014 (0.740–1.390) | 1.349 (0.936–1.945) | 1.296 (0.823–2.044) |
| Adjusted OR (95% CI)c | 1.000 | 0.966 (0.697–1.338) | 1.264 (0.865–1.849) | 1.203 (0.749–1.935) |
|
|
||||
| Women, HGI range | 60–75 | 76–80 | 81–85 | 86–103 |
| Number | 361 | 382 | 338 | 425 |
| Positive HGI | ||||
| Unadjusted OR | 1.000 | 1.133 (0.848–1.513) | 1.277 (0.947–1.725) | 1.547 (1.163–2.062)e |
| Adjusted OR (95% CI)a | 1.000 | 1.113 (0.832–1.488) | 1.248 (0.923–1.687) | 1.503 (1.127–2.006)e |
| Adjusted OR (95% CI)b | 1.000 | 1.162 (0.852–1.585) | 1.345 (0.943–1.921) | 1.709 (1.108–2.642)d |
| Adjusted OR (95% CI)c | 1.000 | 1.117 (0.811–1.539) | 1.313 (0.908–1.901) | 1.669 (1.062–2.630)d |
HGI, hemoglobin glycation index; Q, quartile (Q1 was the lowest quartile); OR, odds ratio; CI, confidence interval.
a Adjusted for age and duration;
b As in a, and additionally adjusted for BMI;
c As in b, and additionally adjusted for systolic blood pressure, exercise status, smoking status, hypoglycemic agent usage (insulin, sulfonylurea, biguanide, alpha-glucosidase inhibitor, glitazone, dipeptidyl peptidase-4 inhibitor, or sodium-glucose transport protein-2 inhibitor), high-density lipoprotein cholesterol, low-density lipoprotein cholesterol, triglycerides, and statin usage;
d P<0.05 vs. Q1;
e P<0.01 vs. Q1.
| Variable | Q1 | Q2 | Q3 | Q4 |
|---|---|---|---|---|
| Men | ||||
| Number of subjects | 147 | 710 | 547 | 171 |
| Plaque (+) | ||||
| Unadjusted OR | 1.000 | 0.664 (0.441–0.983)d | 0.460 (0.303–0.685)f | 0.215 (0.131–0.345)f |
| Adjusted OR (95% CI)a | 1.000 | 0.916 (0.593–1.394) | 0.899 (0.574–1.389) | 0.634 (0.370–1.076) |
| Adjusted OR (95% CI)b | 1.000 | 0.708 (0.448–1.103) | 0.548 (0.325–0.911)d | 0.304 (0.156–0.586)f |
| Adjusted OR (95% CI)c | 1.000 | 0.755 (0.473–1.190) | 0.587 (0.345–0.988)d | 0.352 (0.178–0.689)e |
|
|
||||
| Women | ||||
| Number of subjects | 154 | 572 | 569 | 217 |
| Plaque (+) | ||||
| Unadjusted OR | 1.000 | 0.801 (0.550–1.156) | 0.631 (0.434–0.910)d | 0.478 (0.311–0.730)f |
| Adjusted OR (95% CI)a | 1.000 | 0.884 (0.596–1.301) | 0.860 (0.579–1.269) | 0.767 (0.485–1.207) |
| Adjusted OR (95% CI)b | 1.000 | 0.818 (0.546–1.218) | 0.730 (0.469–1.129) | 0.587 (0.335–1.021) |
| Adjusted OR (95% CI)c | 1.000 | 0.734 (0.483–1.106) | 0.714 (0.454–1.114) | 0.590 (0.332–1.041) |
Q, quartile (Q1 was the lowest quartile); OR, odds ratio; CI, confidence interval.
a Adjusted for age and duration;
b As in a, and additionally adjusted for body mass index;
c As in b, and additionally adjusted for systolic blood pressure, exercise status, smoking status, hypoglycemic agent usage (insulin, sulfonylurea, biguanide, alpha-glucosidase inhibitor, glitazone, dipeptidyl peptidase-4 inhibitor, or sodium-glucose transport protein-2 inhibitor), high-density lipoprotein cholesterol, low-density lipoprotein cholesterol, triglycerides, and statin usage;
d P<0.05 vs. Q1;
e P<0.01 vs. Q1;
F P<0.001 vs. Q1.
| Variable | Q1 | Q2 | Q3 | Q4 |
|---|---|---|---|---|
| Men | ||||
| Number of subjects | 343 | 414 | 389 | 423 |
| Plaque (+) | ||||
| Unadjusted OR | 1.000 | 0.950 (0.709–1.273) | 0.949 (0.705–1.276) | 1.067 (0.796–1.429) |
| Adjusted OR (95% CI)a | 1.000 | 0.981 (0.715–1.345) | 0.998 (0.725–1.373) | 1.207 (0.878–1.658) |
| Adjusted OR (95% CI)b | 1.000 | 0.877 (0.618–1.243) | 0.826 (0.55–1.239) | 0.894 (0.538–1.485) |
| Adjusted OR (95% CI)c | 1.000 | 0.824 (0.572–1.185) | 0.734 (0.479–1.122) | 0.831 (0.487–1.415) |
|
|
||||
| Women | ||||
| Number of subjects | 361 | 382 | 338 | 425 |
| Plaque (+) | ||||
| Unadjusted OR | 1.000 | 1.321 (0.989–1.765) | 1.234 (0.916–1.663) | 1.459 (1.1–1.938)e |
| Adjusted OR (95% CI)a | 1.000 | 1.185 (0.874–1.607) | 1.055 (0.77–1.444) | 1.217 (0.903–1.64) |
| Adjusted OR (95% CI)b | 1.000 | 1.209 (0.873–1.673) | 1.091 (0.752–1.582) | 1.290 (0.821–2.027) |
| Adjusted OR (95% CI)c | 1.000 | 1.047 (0.745–1.469) | 0.939 (0.635–1.387) | 1.039 (0.645–1.675) |
Q, quartile (Q1 was the lowest quartile); OR, odds ratio; CI, confidence interval.
a Adjusted for age and duration;
b As in a, and additionally adjusted for body mass index;
c As in b, and additionally adjusted for systolic blood pressure, exercise status, smoking status, hypoglycemic agent usage (insulin, sulfonylurea, biguanide, alpha-glucosidase inhibitor, glitazone, dipeptidyl peptidase-4 inhibitor, or sodium-glucose transport protein-2 inhibitor), high-density lipoprotein cholesterol, low-density lipoprotein cholesterol, triglycerides, and statin usage;
d P<0.05 vs. Q1;
e P<0.01 vs. Q1;
F P<0.001 vs. Q1.
- 1. Korean Diabetes Association. Diabetes fact sheet in Korea 2018; Seoul: KDA; 2018.
- 2. Skyler JS. Diabetic complications. The importance of glucose control. Endocrinol Metab Clin North Am 1996;25:243–54.ArticlePubMed
- 3. Stratton IM, Adler AI, Neil HA, Matthews DR, Manley SE, Cull CA, et al. Association of glycaemia with macrovascular and microvascular complications of type 2 diabetes (UKPDS 35): prospective observational study. BMJ 2000;321:405–12.ArticlePubMedPMC
- 4. Frontoni S, Di Bartolo P, Avogaro A, Bosi E, Paolisso G, Ceriello A. Glucose variability: an emerging target for the treatment of diabetes mellitus. Diabetes Res Clin Pract 2013;102:86–95.ArticlePubMed
- 5. Wang J, Yan R, Wen J, Kong X, Li H, Zhou P, et al. Association of lower body mass index with increased glycemic variability in patients with newly diagnosed type 2 diabetes: a cross-sectional study in China. Oncotarget 2017;8:73133–43.ArticlePubMedPMC
- 6. Rhee EJ. The effects of postprandial hyperglycemia on glucose control. J Korean Diabetes 2012;13:23–26.Article
- 7. Monnier L, Colette C. Glycemic variability: should we and can we prevent it? Diabetes Care 2008;31(Suppl 2):S150–4.ArticlePubMed
- 8. Zaccardi F, Pitocco D, Ghirlanda G. Glycemic risk factors of diabetic vascular complications: the role of glycemic variability. Diabetes Metab Res Rev 2009;25:199–207.ArticlePubMed
- 9. Hirsch IB. Glycemic variability and diabetes complications: does it matter? of course it does! Diabetes Care 2015;38:1610–4.ArticlePubMed
- 10. Monnier L, Colette C, Owens DR. Integrating glycaemic variability in the glycaemic disorders of type 2 diabetes: a move towards a unified glucose tetrad concept. Diabetes Metab Res Rev 2009;25:393–402.ArticlePubMed
- 11. Hirsch IB. Intensifying insulin therapy in patients with type 2 diabetes mellitus. Am J Med 2005;118:Suppl 5A. 21S–6S.Article
- 12. Bode BW. Clinical utility of the continuous glucose monitoring system. Diabetes Technol Ther 2000;2(Suppl 1):S35–41.ArticlePubMed
- 13. Petrie JR, Peters AL, Bergenstal RM, Holl RW, Fleming GA, Heinemann L. Improving the clinical value and utility of CGM systems: issues and recommendations. a joint statement of the European Association for the Study of Diabetes and the American Diabetes Association Diabetes Technology Working Group. Diabetes Care 2017;40:1614–21.ArticlePubMed
- 14. Soros AA, Chalew SA, McCarter RJ, Shepard R, Hempe JM. Hemoglobin glycation index: a robust measure of hemoglobin A1c bias in pediatric type 1 diabetes patients. Pediatr Diabetes 2010;11:455–61.ArticlePubMed
- 15. Ahn CH, Min SH, Lee DH, Oh TJ, Kim KM, Moon JH, et al. Hemoglobin glycation index is associated with cardiovascular diseases in people with impaired glucose metabolism. J Clin Endocrinol Metab 2017;102:2905–13.ArticlePubMedPMCPDF
- 16. Rhee EJ, Cho JH, Kwon H, Park SE, Park CY, Oh KW, et al. Association between coronary artery calcification and the hemoglobin glycation index: the Kangbuk Samsung Health study. J Clin Endocrinol Metab 2017;102:4634–41.ArticlePubMedPDF
- 17. Snijder MB, Dekker JM, Visser M, Bouter LM, Stehouwer CD, Kostense PJ, et al. Associations of hip and thigh circumferences independent of waist circumference with the incidence of type 2 diabetes: the Hoorn Study. Am J Clin Nutr 2003;77:1192–7.ArticlePubMedPDF
- 18. Jung KJ, Kimm H, Yun JE, Jee SH. Thigh circumference and diabetes: obesity as a potential effect modifier. J Epidemiol 2013;23:329–36.ArticlePubMedPMC
- 19. Park JS, Cho MH, Ahn CW, Kim KR, Huh KB. The association of insulin resistance and carotid atherosclerosis with thigh and calf circumference in patients with type 2 diabetes. Cardiovasc Diabetol 2012;11:62.ArticlePubMedPMC
- 20. Klein S, Allison DB, Heymsfield SB, Kelley DE, Leibel RL, Nonas C, et al. Waist circumference and cardiometabolic risk: a consensus statement from Shaping America’s Health. Association for Weight Management and Obesity Prevention; NAASO, The Obesity Society; the American Society for Nutrition; and the American Diabetes Association. Am J Clin Nutr 2007;85:1197–202.ArticlePubMedPDF
- 21. Hayashi T, Boyko EJ, McNeely MJ, Leonetti DL, Kahn SE, Fujimoto WY. Visceral adiposity, not abdominal subcutaneous fat area, is associated with an increase in future insulin resistance in Japanese Americans. Diabetes 2008;57:1269–75.ArticlePubMed
- 22. Miller MR, Pereira RI, Langefeld CD, Lorenzo C, Rotter JI, Chen YD, et al. Levels of free fatty acids (FFA) are associated with insulin resistance but do not explain the relationship between adiposity and insulin resistance in Hispanic Americans: the IRAS Family Study. J Clin Endocrinol Metab 2012;97:3285–91.ArticlePubMedPMCPDF
- 23. Padaki S, Vijayakrishna K, Dambal A, Ankad R, Manjula R, Surekharani C, et al. Anthropometry and physical fitness in individuals with family history of type-2 diabetes mellitus: a comparative study. Indian J Endocrinol Metab 2011;15:327–30.ArticlePubMedPMC
- 24. Casadei A, Floreani M, Catalini R, Serra C, Assanti AP, Conci P. Sonographic characteristics of carotid artery plaques: implications for follow-up planning? J Ultrasound 2012;15:151–7.ArticlePubMedPMC
- 25. Hempe JM, Liu S, Myers L, McCarter RJ, Buse JB, Fonseca V. The hemoglobin glycation index identifies subpopulations with harms or benefits from intensive treatment in the ACCORD trial. Diabetes Care 2015;38:1067–74.ArticlePubMedPMC
- 26. Belfiore F, Bergman RN, Molinatti GM. Current topics in diabetes research; Basel: Karger Publishers; 1993. Chapter, Measurement of insulin resistance and beta-cell function: the HOMA and CIGMA approach. p. 66–75.
- 27. Service FJ, Molnar GD, Rosevear JW, Ackerman E, Gatewood LC, Taylor WF. Mean amplitude of glycemic excursions, a measure of diabetic instability. Diabetes 1970;19:644–55.ArticlePubMed
- 28. Ryan EA, Shandro T, Green K, Paty BW, Senior PA, Bigam D, et al. Assessment of the severity of hypoglycemia and glycemic lability in type 1 diabetic subjects undergoing islet transplantation. Diabetes 2004;53:955–62.ArticlePubMed
- 29. Park SA, Ko SH, Lee SH, Cho JH, Moon SD, Jang SA, et al. Average daily risk range-index of glycemic variability-related factor in type 2 diabetic inpatients. Korean Diabetes J 2009;33:31–9.Article
- 30. Park K. Park’s textbook of preventive and social medicine; 23rd ed. Jabalpur: Bhanot Publishers; 2015.
References
Figure & Data
References
Citations
- Association between hemoglobin glycation index and subclinical myocardial injury in the general population free from cardiovascular disease
Zhenwei Wang, Yihai Liu, Jing Xie, Nai-Feng Liu
Nutrition, Metabolism and Cardiovascular Diseases.2022; 32(2): 469. CrossRef - Association of Hemoglobin Glycation Index With Contrast-Induced Acute Kidney Injury in Patients Undergoing Coronary Angiography: A Retrospective Study
Zhezhe Chen, Duanbin Li, Maoning Lin, Hangpan Jiang, Tian Xu, Yu Shan, Guosheng Fu, Min Wang, Wenbin Zhang
Frontiers in Physiology.2022;[Epub] CrossRef - Associations of continuous glucose monitoring-assessed glucose variability with intima-media thickness and ultrasonic tissue characteristics of the carotid arteries: a cross-sectional analysis in patients with type 2 diabetes
Naohiro Taya, Naoto Katakami, Tomoya Mita, Yosuke Okada, Satomi Wakasugi, Hidenori Yoshii, Toshihiko Shiraiwa, Akihito Otsuka, Yutaka Umayahara, Kayoko Ryomoto, Masahiro Hatazaki, Tetsuyuki Yasuda, Tsunehiko Yamamoto, Masahiko Gosho, Iichiro Shimomura, Hi
Cardiovascular Diabetology.2021;[Epub] CrossRef
 PubReader
 ePub Link
 Cite
Cite

