
Articles
- Page Path
- HOME > Endocrinol Metab > Volume 30(3); 2015 > Article
-
Original ArticleClinical Study Weight Changes in Patients with Differentiated Thyroid Carcinoma during Postoperative Long-Term Follow-up under Thyroid Stimulating Hormone Suppression
- Seo Young Sohn1, Ji Young Joung2, Yoon Young Cho2, Sun Mi Park2, Sang Man Jin2, Jae Hoon Chung2, Sun Wook Kim2
-
Endocrinology and Metabolism 2015;30(3):343-351.
DOI: https://doi.org/10.3803/EnM.2015.30.3.343
Published online: August 4, 2015
1Center for Thyroid Cancer, National Cancer Center, Goyang, Korea.
2Thyroid Center, Division of Endocrinology and Metabolism, Department of Medicine, Samsung Medical Center, Sungkyunkwan University School of Medicine, Seoul, Korea.
- Corresponding author: Sun Wook Kim. Division of Endocrinology and Metabolism, Department of Medicine, Samsung Medical Center, Sungkyunkwan University School of Medicine, 81 Irwon-ro, Gangnam-gu, Seoul 06351, Korea. Tel: +82-10-9933-1653, Fax: +82-2-6918-4653, swkimmd@skku.edu
Copyright © 2015 Korean Endocrine Society
This is an Open Access article distributed under the terms of the Creative Commons Attribution Non-Commercial License (http://creativecommons.org/licenses/by-nc/3.0/) which permits unrestricted non-commercial use, distribution, and reproduction in any medium, provided the original work is properly cited.
ABSTRACT
-
Background
- There are limited data about whether patients who receive initial treatment for differentiated thyroid cancer (DTC) gain or lose weight during long-term follow-up under thyroid stimulating hormone (TSH) suppression. This study was aimed to evaluate whether DTC patients under TSH suppression experience long-term weight gain after initial treatment. We also examined the impact of the radioactive iodine ablation therapy (RAIT) preparation method on changes of weight, comparing thyroid hormone withdrawal (THW) and recombinant human TSH (rhTSH).
-
Methods
- We retrospectively reviewed 700 DTC patients who underwent a total thyroidectomy followed by either RAIT and levothyroxine (T4) replacement or T4 replacement alone. The control group included 350 age-matched patients with benign thyroid nodules followed during same period. Anthropometric data were measured at baseline, 1 to 2 years, and 3 to 4 years after thyroidectomy. Comparisons were made between weight and body mass index (BMI) at baseline and follow-up.
-
Results
- Significant gains in weight and BMI were observed 3 to 4 years after initial treatment for female DTC but not in male patients. These gains among female DTC patients were also significant compared to age-matched control. Women in the THW group gained a significant amount of weight and BMI compared to baseline, while there was no increase in weight or BMI in the rhTSH group. There were no changes in weight and BMI in men according to RAIT preparation methods.
-
Conclusion
- Female DTC patients showed significant gains in weight and BMI during long-term follow-up after initial treatment. These changes were seen only in patients who underwent THW for RAIT.
- Patients who undergo thyroidectomy are frequently concerned about weight gain after initial treatment. Many studies have shown that weight gain is common during treatment of hyperthyroidism. When a thyroidectomy or radioactive iodine ablation was performed for treatment of hyperthyroidism [12345], patients with hyperthyroidism experienced a 4 to 10 kg increase in body weight after 2 years of treatment in spite of normal serum thyroid stimulating hormone (TSH) [12345]. This suggests that iatrogenic hypothyroidism during treatment is associated with weight gain.
- There are few data about weight changes in thyroid cancer patients undergoing thyroidectomy and the results are controversial [6]. Weinreb et al. [6] compared weight change in a total of 102 patients with thyroid cancer and euthyroid patients with benign thyroid nodular disease. There was no difference in weight change between the two groups at a median of 5.9 years of follow-up [6]. In contrast, Polotsky et al. [7] recently showed that there was a significant weight gain of approximately 3 kg in thyroid cancer patients for 3 to 5 years after thyroidectomy, which was greater than age matched population controls, despite ongoing TSH suppression by levothyroxine for the treatment of thyroid cancer. Similarly, Jonklaas and Nsouli-Maktabi [8] reported thyroid cancer patients with iatrogenic hyperthyroidism gained an average of 1.2 kg for 1 year after thyroidectomy.
- This study investigated whether differentiated thyroid cancer (DTC) patients under TSH suppression (iatrogenic hyperthyroidism) gained a significant amount of weight after initial treatment compared to the age-matched control. This study also evaluated whether the method of preparation for radioactive iodine ablation therapy (RAIT) influences long-term weight change during follow-up of patients with DTC.
INTRODUCTION
- Subjects
- A retrospective analysis was performed on 700 patients with DTC and 350 patients with benign thyroid nodules. Medical records were used to obtain information about age, gender, height, body mass index (BMI), TSH, and triiodothyronine (T3) at baseline, at 1- to 2-year follow-up, and at 3- to 4-year follow-up.
- DTC patients who met both of the following criteria were included in the study: (1) the patient had undergone a total thyroidectomy at Samsung Medical Center between January 2008 and December 2008, and (2) the patient was taking a suppressive dose of levothyroxine (<0.4 mU/L) for TSH suppression. The average dose of levothyroxine was 1.48±1.45 µg/kg body weight. In the study group, 87% had received radioiodine either for remnant ablation or treatment. Patients were prepared for radioiodine administration with either conventional thyroid hormone withdrawal (THW) or TSH stimulation with recombinant human TSH (rhTSH; Thyrogen, Genzyme Corp., Cambridge, MA, USA).
- The control group included 350 euthyroid patients with benign thyroid nodules, age-matched to the study subjects. No one in the control group was diagnosed with thyroid cancer during follow-up. Subjects were excluded from the control group if they had pre-existing thyroid disease, used thyroid hormone, had been diagnosed with a malignancy other than thyroid cancer, were taking medications which could affect weight, or were pregnant during follow-up.
- Study protocol
- Weight was measured at an outpatient clinic, at baseline before surgery and 1 to 2 years and 3 to 4 years after surgery. In the control group, baseline weight was measured at an outpatient clinic during the first visit and subsequently 1 to 2 years and 3 to 4 years after the baseline measurement. Weight was measured with patients wearing indoor clothes without shoes. Height was measured once at baseline and was used in the calculation of BMI during follow-up. BMI was calculated as weight in kilograms divided by height in meters squared (kg/m2). Baseline weight and BMI were compared with data obtained at the 1- to 2-year and 3- to 4-year outpatient clinic visits. Changes in weight and BMI according to RAIT preparation methods (THW or rhTSH) in patients with DTC were also analyzed during follow-up. Finally, patients were divided into three groups according to the degree of weight gain (no weight gain, weight gain <5% of their baseline weight, weight gain ≥5% of their baseline weight) and variables affecting weight gain were calculated. TSH and T3 levels were recorded at baseline, as well as at 1- to 2-year and 3- to 4-year follow-up in patients with DTC. TSH levels were measured using a commercial immunoradiometric assay kit (Beckman coulter, Marseille, France). The intra-assay coefficients of variation for quality control specimens were 3.0%, 2.5%, 3.2%, and 3.7% in mean TSH concentration 2.02, 5.83, 10, and 42 mU/L and interassay coefficients of variation were 8.6%, 5.7%, and 2.8% in mean TSH concentration 3.1, 9.7, and 39.6 mU/L. T3 levels were also measured using commercialized radioimmunoassay kits. The intra-assay coefficients of variation were 5.36%, 6.27%, and 3.78% in mean T3 concentration 1.8, 2.17, and 2.54 nmol/L and interassay coefficients of variation were 7.66%, 5.27%, and 4.48% in mean T3 concentration 1.95, 2.76, and 6.87 nmol/L. The reference ranges of TSH and T3 were 0.40 to 4.20 mU/L and 1.1 to 2.9 nmol/L, as recommended by the kit provider.
- Statistical analysis
- A paired t test or Wilcoxon signed rank test was used for comparing changes at baseline, as well as 1 to 2 years and 3 to 4 years post-thyroidectomy. The Mann-Whitney test or Student t test was used to compare median and mean between the group with thyroid cancer and the control group. A one-way analysis of variance (ANOVA) with Tukey post hoc test or Mantel-Haenszel chi-square test was used for comparisons between the three groups of patients categorized according to weight gain. Correlations between weight gain and variables such as age at surgery, TSH levels, and T3 levels were analyzed using Spearman correlation test. A one-way ANOVA with Tukey post hoc test was used to compare weight change between different age groups in female thyroid cancer patients (<40 years [n=69], 41 to 45 years [n=63], 46 to 50 years [n=51], 51 to 55 years [n=75], and >55 years [n=95]). All statistical analyses were performed using PASW 17.0 software, version 9.1.3 (SPSS Inc., Chicago, IL, USA). P values less than 0.05 were considered significant.
METHODS
- Patient characteristics
- This study included 700 patients with DTC (the study subjects) and 350 euthyroid patients with benign thyroid nodule (the control group) (Table 1). All thyroid cancer patients in this study underwent a total thyroidectomy and were diagnosed with papillary thyroid carcinomas. Among the 700 DTC patients, 506 received radioiodine remnant ablation with THW, 104 underwent radioiodine remnant ablation with rhTSH and 90 patients did not receive radioiodine after surgery.
- Changes in weight and BMI after total thyroidectomy in patients with differentiated thyroid cancer
- Thyroid cancer patients experienced significant weight gain after total thyroidectomy, with an increase from 61.3±10.1 kg at baseline to 61.8±10.2 kg at 3- to 4-year follow-up (P<0.01). BMI increased from 24.1 to 24.2 over 3 to 4 years (P<0.01). When weight gain was analyzed by gender, a significant increase in weight and BMI was observed at 1- to 2-year follow-up in both male and female thyroid cancer patients. However, this increase was not observed in male subjects at 3- to 4-year follow-up.
- The median suppressed TSH levels of DTC patients at 1 to 2 years and 3 to 4 years were 0.03 and 0.07 mU/L, respectively. The median T3 levels at 1 to 2 years and 3 to 4 years were 1.69 and 1.47 nmol/L, respectively (Table 2).
- Comparison of weight and BMI changes between patients with differentiated thyroid cancer and control group
- The mean age of thyroid cancer patients was 52.0±9.4 years in males and 49.7±10.4 years in females. There were no differences in variables at baseline between patients with DTC and the control group, with the exception of BMI. In female patients with DTC, BMI was slightly higher than in the control (23.8 kg/m2 vs. 23.1 kg/m2, P<0.01) (Table 1).
- Weight and BMI changes were compared between thyroid cancer patients and the control. There were significant differences in weight gain between DTC patients and the control group. In DTC patients, mean weight and BMI increased 0.5 kg and 0.2 kg/m2, respectively, after 3 to 4 years. There was no increase in weight or BMI in the control group after 3 to 4 years of follow-up. When further analyzed by gender, the increases in weight and BMI were observed in female subjects only. Weight and BMI appeared to increase at a faster rate in male DTC patients but this was not statistically significant (Table 3).
- Changes in body weight and BMI according to preparation method for RAIT (endogenous vs. rhTSH)
- Weight and BMI changes were compared according to methods of TSH stimulation in DTC patients. Endogenous stimulation by THW was associated with significant weight gain and increase of BMI while there was no increase in weight and BMI in the rhTSH stimulation group. This phenomenon was statistically significant for female subjects only, at both the 1- to 2-year and 3- to 4-year follow-up (Table 4).
- Variables associated with weight gain in thyroid cancer patients
- DTC patients were divided into three groups according to the degree of weight gain (group A=no weight gain; group B=mild, weight gain <5% from baseline; group C=significant, weight gain ≥5% from baseline) and variables that may have affected weight were analyzed. Age at surgery and level of TSH suppression were significantly different between the three groups. Members of group C were significantly younger, and both men and women in this group gained a significant amount of weight. TSH levels significantly affected weight in female subjects even though these TSH levels were still within the suppressed range. T3 levels did not vary according to degree of weight gain (Table 5).
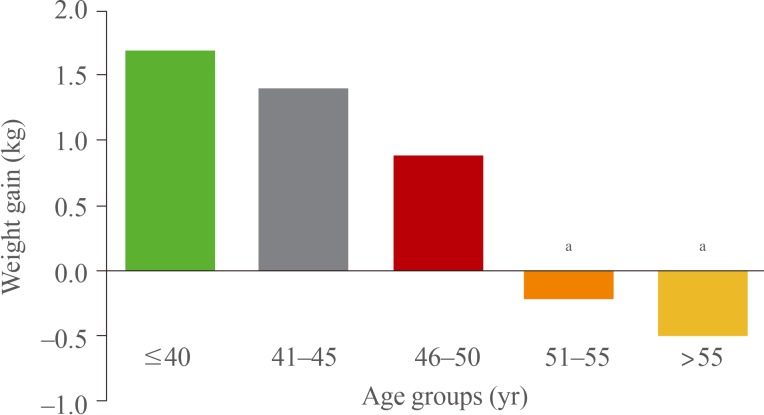
- Because age at surgery significantly affected weight gain, the female DTC patients were grouped according to age (≤40 years [n=69], 41 to 45 years [n=63], 46 to 50 years [n=51], 51 to 55 years [n=75], and ≥56 years [n=95]) at surgery and weight gain was compared at 3- to 4-year follow-up between age groups. Weight gain was greater in younger age group (Fig. 1). In the correlation analysis, there was a significant association between age at surgery and weight gain (r=-0.25, P<0.01). The younger the age at surgery, the greater the weight gain. In addition, TSH levels and weight gain were significantly correlated (r=0.14, P<0.01).
RESULTS
- This study showed that patients with DTC experienced significant weight gain compared to their baseline weight after a total thyroidectomy with ongoing TSH suppression. Male and female thyroid cancer patients gained 0.6 and 0.5 kg respectively, 3 to 4 years after total thyroidectomy. Female thyroid cancer patients still experienced significant weight gain when compared to the control group. Notably, there was significant weight gain in thyroid cancer patients with THW before RAIT, whereas there was no weight change in the rhTSH group. Age and TSH levels were associated with weight change in thyroid cancer patients after long-term follow-up.
- Although DTC patients in this study experienced statistically significant weight gain after thyroidectomy, the degree of weight gain was relatively modest. Excessive weight gain frequently develops after surgical treatment of hyperthyroidism [123] and several studies suggest postsurgical hypothyroidism due to inadequate hormone replacement may cause this weight gain [13]. However, most thyroid cancer patients receive a suppressive dose of levothyroxine after undergoing a thyroidectomy and subsequent iatrogenic hyperthyroidism. This suggests that their weight gain was mitigated by lower TSH levels, which has been supported by several studies [78]. According to Jonklaas and Nsouli-Maktabi [8], 120 DTC patients with iatrogenic hyperthyroidism gained 1.2 kg 1 year after thyroidectomy, whereas patients with benign thyroid disease who achieved euthyroidism on levothyroxine 1 year following total thyroidectomy gained 3.1 kg and patients with preexisting hypothyroidism gained 2.2 kg during 1 year. In addition, serum TSH levels are positively associated with weight gain over time [91011]. In this study, despite suppressed TSH levels 3 to 4 years after thyroidectomy, there was a significant correlation between TSH levels and weight gain. Therefore, slight elevation of serum TSH levels within the suppressed range might be also associated with weight gain. Several studies suggested that the association between TSH and body weight is regulated by circulating leptin [1213]. Leptin, secreted by adipocytes, plays a role in central regulation of thyroid function by stimulating TRH, ultimately increasing TSH release [14].
- This study also analyzed how the RAIT preparation method affected weight and BMI, and found that THW was associated with weight gain after total thyroidectomy. There was no change in weight or BMI in the rhTSH group, although relatively small number of patients who received rhTSH before RAIT were included Recently, Polotsky et al. [7] reviewed changes in body weight over 5 years among 153 DTC patients treated with TSH suppression and grouped according to method of RAIT preparation. Weight gain was more significant in patients prepared for RAIT with THW than with rhTSH; these results are similar to the present study. In the study by Polotsky et al. [7], the THW group gained an average of 0.64 kg per year, compared with 0.34 kg per year in the rhTSH group. One previous study found that body fat content significantly increased and basal energy expenditure decreased in patients experiencing short term hypothyroidism associated with THW, but there was no significant change in body composition or energy expenditure in 41 thyroidectomized patients after 12 weeks of thyroxine (T4) replacement [15]. However, further research is needed, as severe hypothyroidism by THW could influence long-term weight regulation, and profound short-term hypothyroidism might have a long-term effect on weight change.
- With regard to levothyroxine replacement alone after thyroidectomy, one might assume that weight gain is the result of relative T3 deficiency and that physiological euthyroidism was not achievable with levothyroxine alone. However, data from the present study showed that 3 to 4 years after surgery, DTC patients had a median T3 level of 1.47 nmol/L using levothyroxine replacement alone and that T3 levels were not different between groups according to degree of weight gain. Jonklaas et al. [16] also reported that normal T3 levels were achieved with levothyroxine alone in patients who underwent near total or total thyroidectomy with normal or suppressed TSH levels. However, T3 deficiency could be present at the tissue level in cases of levothyroxine monotherapy [17]. A recent study reported that free T3 levels were lower in levothyroxine-treated thyroidectomized patients compared to matched euthyroid controls, suggesting that physiological treatments in addition to levothyroxine monotherapy may be required in some cases [18].
- Remarkably, in contrast to previous study, younger age was associated with weight gain in the THW female group. Some studies have suggested that perimenopausal women are at risk for weight gain and increased BMI [1920]. One recent study showed that the greatest weight gain in the thyroidectomized patients was observed in menopausal women compared to premenopausal women or men [8]. The mean age of menopause in Korean women is 50±3 years [21], indicating that menopausal status was not associated with weight gain after thyroidectomy, in the present study. Several previous studies have investigated the metabolic effects caused by transient severe hypothyroidism due to THW in patents with DTC [222324]. THW resulted in increased total cholesterol, low density lipoprotein cholesterol and triglyceride levels [222324]. Acute thyroid hormone deficiency following THW also caused systolic dysfunction of left ventricle and elevated muscle enzyme [22]. However, they have focused on the acute changes of lipid metabolism or peripheral tissue functions following THW in DTC patients, long-term metabolic effect of THW was not clarified. Therefore, we could postulate there might be metabolic alterations such as lipid profile or peripheral tissue function which predisposes younger female THW group to weight gain. Further prospective studies are needed about long term metabolic effect of THW and these are reversible with ongoing T4 suppression.
- This study has some limitations. First, the retrospective analysis of the data did not include lifestyle or weight loss efforts, which is similar to previous retrospective studies. However, the present study did include a relatively large number of female thyroid cancer patients (n=580) compared to previous studies, and so these results can likely be applied to the general female thyroid cancer population. Second, the number of male patients and subjects who received rhTSH before RAIT was relatively small, which may have affected the statistical findings. Therefore further studies with large number of patients are required to clarify the effect of gender difference or RAIT preparation methods on weight change. Third, we did not analyze free T4 or total T4 levels which might affect weight change of patients with DTC. However, previous studies have indicated that moderate increase of TSH is usually not associated with changes in free and total T4 in obesity and free T4 levels are comparable in normal weight and obese humans [252627]. Fourth, measurement error between different observers collecting anthropometric data could not be excluded. However, according to Arterburn et al. [28], body weight measures obtained during routine clinical care can be used without statistical correction. Another study also found that there was close agreement between weights obtained by research and clinical measures [29].
- In summary, DTC patients with levothyroxine replacement after thyroidectomy experienced weight gain compared with their baseline weight, although their weight gain might be mitigated by low TSH levels. THW might affect long-term weight change and younger females seem to be prone to weight gain after thyroidectomy. Physicians should be aware of the risk of weight gain in thyroid cancer patients, especially younger females who undergo THW in preparation for RAIT. Further studies are needed to explain the mechanism of weight gain after thyroidectomy despite ongoing TSH suppression.
DISCUSSION
-
Acknowledgements
- This study was supported by research fund of Thyroid Division of Korean Endocrine Society.
ACKNOWLEDGMNTS
-
CONFLICTS OF INTEREST: No potential conflict of interest relevant to this article was reported.
Article information
- 1. Tigas S, Idiculla J, Beckett G, Toft A. Is excessive weight gain after ablative treatment of hyperthyroidism due to inadequate thyroid hormone therapy? Thyroid 2000;10:1107–1111. ArticlePubMed
- 2. Dale J, Daykin J, Holder R, Sheppard MC, Franklyn JA. Weight gain following treatment of hyperthyroidism. Clin Endocrinol (Oxf) 2001;55:233–239. ArticlePubMed
- 3. Brunova J, Bruna J, Joubert G, Koning M. Weight gain in patients after therapy for hyperthyroidism. S Afr Med J 2003;93:529–531. PubMed
- 4. de la Rosa RE, Hennessey JV, Tucci JR. A longitudinal study of changes in body mass index and total body composition after radioiodine treatment for thyrotoxicosis. Thyroid 1997;7:401–405. ArticlePubMed
- 5. Hoogwerf BJ, Nuttall FQ. Long-term weight regulation in treated hyperthyroid and hypothyroid subjects. Am J Med 1984;76:963–970. ArticlePubMed
- 6. Weinreb JT, Yang Y, Braunstein GD. Do patients gain weight after thyroidectomy for thyroid cancer? Thyroid 2011;21:1339–1342. ArticlePubMed
- 7. Polotsky HN, Brokhin M, Omry G, Polotsky AJ, Tuttle RM. Iatrogenic hyperthyroidism does not promote weight loss or prevent ageing-related increases in body mass in thyroid cancer survivors. Clin Endocrinol (Oxf) 2012;76:582–585. ArticlePubMed
- 8. Jonklaas J, Nsouli-Maktabi H. Weight changes in euthyroid patients undergoing thyroidectomy. Thyroid 2011;21:1343–1351. ArticlePubMedPMC
- 9. Knudsen N, Laurberg P, Rasmussen LB, Bulow I, Perrild H, Ovesen L, et al. Small differences in thyroid function may be important for body mass index and the occurrence of obesity in the population. J Clin Endocrinol Metab 2005;90:4019–4024. ArticlePubMed
- 10. Svare A, Nilsen TI, Bjoro T, Asvold BO, Langhammer A. Serum TSH related to measures of body mass: longitudinal data from the HUNT Study, Norway. Clin Endocrinol (Oxf) 2011;74:769–775. ArticlePubMed
- 11. Fox CS, Pencina MJ, D'Agostino RB, Murabito JM, Seely EW, Pearce EN, et al. Relations of thyroid function to body weight: cross-sectional and longitudinal observations in a community-based sample. Arch Intern Med 2008;168:587–592. ArticlePubMed
- 12. Zimmermann-Belsing T, Brabant G, Holst JJ, Feldt-Rasmussen U. Circulating leptin and thyroid dysfunction. Eur J Endocrinol 2003;149:257–271. ArticlePubMed
- 13. Leonhardt U, Ritzel U, Schafer G, Becker W, Ramadori G. Serum leptin levels in hypo- and hyperthyroidism. J Endocrinol 1998;157:75–79. ArticlePubMed
- 14. Feldt-Rasmussen U. Thyroid and leptin. Thyroid 2007;17:413–419. ArticlePubMed
- 15. Wolf M, Weigert A, Kreymann G. Body composition and energy expenditure in thyroidectomized patients during short-term hypothyroidism and thyrotropin-suppressive thyroxine therapy. Eur J Endocrinol 1996;134:168–173. ArticlePubMed
- 16. Jonklaas J, Davidson B, Bhagat S, Soldin SJ. Triiodothyronine levels in athyreotic individuals during levothyroxine therapy. JAMA 2008;299:769–777. ArticlePubMed
- 17. Escobar-Morreale HF, Obregon MJ, Escobar del Rey F, Morreale de Escobar G. Replacement therapy for hypothyroidism with thyroxine alone does not ensure euthyroidism in all tissues, as studied in thyroidectomized rats. J Clin Invest 1995;96:2828–2838. ArticlePubMedPMC
- 18. Gullo D, Latina A, Frasca F, Le Moli R, Pellegriti G, Vigneri R. Levothyroxine monotherapy cannot guarantee euthyroidism in all athyreotic patients. PLoS One 2011;6:e22552ArticlePubMedPMC
- 19. Lovejoy JC. The influence of sex hormones on obesity across the female life span. J Womens Health 1998;7:1247–1256. ArticlePubMed
- 20. Carr MC. The emergence of the metabolic syndrome with menopause. J Clin Endocrinol Metab 2003;88:2404–2411. ArticlePubMed
- 21. Park HA, Park JK, Park SA, Lee JS. Age, menopause, and cardiovascular risk factors among korean middle-aged women: the 2005 Korea National Health and Nutrition Examination Survey. J Womens Health (Larchmt) 2010;19:869–876. ArticlePubMed
- 22. Regalbuto C, Alagona C, Maiorana R, Di Paola R, Cianci M, Alagona G, et al. Acute changes in clinical parameters and thyroid function peripheral markers following L-T4 withdrawal in patients totally thyroidectomized for thyroid cancer. J Endocrinol Invest 2006;29:32–40. ArticlePubMedPDF
- 23. Shin DY, Kim KJ, Cho Y, Park KH, Hwang S, Chung WY, et al. Body mass index is associated with hypercholesterolemia following thyroid hormone withdrawal in thyroidectomized patients. Int J Endocrinol 2014;2014:649016ArticlePubMedPMCPDF
- 24. Chrisoulidou A, Pazaitou-Panayiotou K, Kaprara A, Platoyiannis D, Lafaras C, Boudina M, et al. Effects of thyroxine withdrawal in biochemical parameters and cardiac function and structure in patients with differentiated thyroid cancer. Minerva Endocrinol 2006;31:173–178. PubMed
- 25. Reinehr T, Andler W. Thyroid hormones before and after weight loss in obesity. Arch Dis Child 2002;87:320–323. ArticlePubMedPMC
- 26. Kok P, Roelfsema F, Langendonk JG, Frolich M, Burggraaf J, Meinders AE, et al. High circulating thyrotropin levels in obese women are reduced after body weight loss induced by caloric restriction. J Clin Endocrinol Metab 2005;90:4659–4663. ArticlePubMed
- 27. Reinehr T, Isa A, de Sousa G, Dieffenbach R, Andler W. Thyroid hormones and their relation to weight status. Horm Res 2008;70:51–57. ArticlePubMed
- 28. Arterburn D, Ichikawa L, Ludman EJ, Operskalski B, Linde JA, Anderson E, et al. Validity of clinical body weight measures as substitutes for missing data in a randomized trial. Obes Res Clin Pract 2008;2:277–281. ArticlePubMedPMC
- 29. DiMaria-Ghalili RA. Medical record versus researcher measures of height and weight. Biol Res Nurs 2006;8:15–23. ArticlePubMed
References
Weight gain by age group in female thyroid cancer patients who underwent thyroid hormone withdrawal before radioactive iodine ablation therapy. The values were evaluated with the Tukey post hoc test for group differences. aP<0.01 for group differences, age ≤40 years versus age 51 to 55 years and age >55 years.
Comparison of Characteristics between Thyroid Cancer Patients and Patients with Nodules
Changes in Measurements after Total Thyroidectomy in Patients with Thyroid Cancer
Values are expressed as mean±SD or median (range).
BMI, body mass index; TSH, thyroid stimulating hormone; T3, triiodothyronine.
aPaired t test, comparison of weight or BMI after total thyroidectomy versus baseline; bWilcoxon signed rank test, comparison of TSH or T3 after total thyroidectomy versus baseline.
Comparison of Weight and Body Mass Index Change between Groups
Changes in Weight and Body Mass Index after Total Thyroidectomy in Patients with Thyroid Cancer, according to Radioactive Iodine Ablation Therapy Preparation Method
Variables Associated with Weight Gain in Patients with Thyroid Cancer, 3 to 4 Years after Thyroidectomy
Values are expressed as number (%), mean±SD, or median (range).
NS, not significant; RAI, radioactive iodine; THW, thyroid hormone withdrawal; rhTSH, recombinant human thyroid stimulating hormone; TSH, thyroid stimulating hormone; T3, triiodothyronine.
aThe values were evaluated with the Tukey post hoc test for group differences; bP<0.01; cP<0.05 for group differences.
Figure & Data
References
Citations
- Impact of a mobile health intervention based on multi-theory model of health behavior change on self-management in patients with differentiated thyroid cancer: protocol for a randomized controlled trial
Yang Jiang, Xiangju Sun, Maomin Jiang, Hewei Min, Jing Wang, Xinghua Fu, Jiale Qi, Zhenjie Yu, Xiaomei Zhu, Yibo Wu
Frontiers in Public Health.2024;[Epub] CrossRef - Thyroidectomy Effects on the Body Mass Index and Thyroid-Stimulating Hormone: A Systematic Review and Meta-Analysis
Hyder Mirghani, Ahmad M Fnjan, Abdullah F Almalki, Ali F Almadan, Omar Abdullah M Alammar, Abdulaziz S Alhwiati, Amer A Laradhi, Ahmed M Bakour, Mohamad A Aljahed, Abdulmajeed M Alzahrani
Cureus.2024;[Epub] CrossRef - Pre-surgery dietician counseling can prevent post-thyroidectomy body weight gain: results of an intervention trial
Laura Croce, Cristina Pallavicini, Noemi Busca, Benedetto Calì, Giuseppe Bellastella, Francesca Coperchini, Flavia Magri, Luca Chiovato, Hellas Cena, Mario Rotondi
Endocrine.2023; 81(2): 246. CrossRef - Determinants and mediating mechanisms of quality of life and disease-specific symptoms among thyroid cancer patients: the design of the WaTCh study
Floortje Mols, Dounya Schoormans, Romana Netea-Maier, Olga Husson, Sandra Beijer, Katrijn Van Deun, Wouter Zandee, Marleen Kars, Pleun C. M. Wouters van Poppel, Suat Simsek, Patrick van Battum, Jérôme M. H. Kisters, Jan Paul de Boer, Elske Massolt, Rachel
Thyroid Research.2023;[Epub] CrossRef - Effects of a low-iodine diet in post-thyroidectomy thyroid cancer patients undergoing I131 therapy at the Vietnam National Cancer Hospital
Bach Viet Hoang, Tien Thi Hong Nguyen, Yen Thi Duong, Hoa Thi Thanh Nguyen, Thu Ha Nguyen, Thanh Thi Nguyen, Lieu Thi Thu Nguyen, Huong Thi Le
Nutrition and Health.2023;[Epub] CrossRef - Positive effects of thyroid replacement therapy on assisted reproductive technology outcomes in women with subclinical hypothyroidism with positive thyroid peroxidase autoantibodies
Himanshu Arora, Ineabelle Collazo, Katherine L. Palmerola, Madhumita Parmar, Manish Narasimman, Nicholas Hendon, Juergen Eisermann, Maria Bustillo
F&S Reports.2022; 3(1): 32. CrossRef - Weight Gain After Thyroidectomy: A Systematic Review and Meta-Analysis
Christine N Huynh, Janina V Pearce, Le Kang, Francesco S Celi
The Journal of Clinical Endocrinology & Metabolism.2021; 106(1): 282. CrossRef - Weight change in patients with differentiated thyroid carcinoma after total thyroidectomy versus lobectomy
Hae-Ryong Cho, Ra-Yeong Song, Kyung Ho Kang
Korean Journal of Clinical Oncology.2020; 16(2): 127. CrossRef - Postthyroidectomy obesity in a Korean population: does the extent of surgery matter?
Min-Young Park, Sang Eun Nam, Kyoung Sik Park, Madhuri Saindane, Young-Bum Yoo, Jung-Hyun Yang, Ah-Leum Ahn, Jae-Kyung Choi, Won Seo Park
Annals of Surgical Treatment and Research.2019; 97(3): 119. CrossRef - Body weight change is unpredictable after total thyroidectomy
Ron Glick, Paula Chang, Peter Michail, Jonathan W. Serpell, Simon Grodski, James C. Lee
ANZ Journal of Surgery.2018; 88(3): 162. CrossRef - Weight Changes After Thyroid Surgery for Patients with Benign Thyroid Nodules and Thyroid Cancer: Population-Based Study and Systematic Review and Meta-Analysis
Naykky Singh Ospina, Ana Castaneda-Guarderas, Oksana Hamidi, Oscar J. Ponce, Wang Zhen, Larry Prokop, Victor M. Montori, Juan P. Brito
Thyroid.2018; 28(5): 639. CrossRef - Does the Risk of Metabolic Syndrome Increase in Thyroid Cancer Survivors?
Min-Hee Kim, Jin-young Huh, Dong-jun Lim, Moo-Il Kang
Thyroid.2017; 27(7): 936. CrossRef - Thyroid hormone and its metabolites in relation to quality of life in patients treated for differentiated thyroid cancer
E.T. Massolt, M. van der Windt, T.I.M. Korevaar, B.L.R. Kam, J.W. Burger, G.J.H. Franssen, I. Lehmphul, J. Köhrle, W.E. Visser, R.P. Peeters
Clinical Endocrinology.2016; 85(5): 781. CrossRef - High Serum Levels of Thyroid-Stimulating Hormone and Sustained Weight Gain in Patients with Thyroid Cancer Undergoing Radioiodine Therapy
Hyo Jung Seo, June-Key Chung, Keon Wook Kang, E. Edmund Kim, Gi Jeong Cheon, Jin Chul Paeng, Dong Soo Lee, Young Joo Park, Do Joon Park, Jae Gol Choe
International Journal of Thyroidology.2016; 9(1): 19. CrossRef
 PubReader
 Cite
Cite

